Supplement to the
ARCHIVES
National Building Code
of Canada
f
990
Third Revisions and Errata
Issued by the
Canadian Commission on Building and Fire Codes
National Research Council of Canada
Ottawa
January 1993
The attached pages identify revisions and errata to
The errata are corrections which have been identified
the Supplement to the National Building Code of
and are included to facilitate the use of the Code.
Canada 1990. The revisions have been approved by
Revisions are identified by an
rin the margin nearest
the Canadian Commission on Building and Fire
the change;
r3 designates a revision issued in January
Codes for immediate implementation.
1993. Errata are identified by an
e.
In accordance with the CCBFC Policies and Proce-
dures, the lists of referenced documents in the 1990
Supplement are updated annually. The revisions
contained herein include updates to 30 June 1992.
Where changes to the title have been made, the
relevant requirements have also been updated.
The revisions listed for S, values are the result of a
reassessment by The Atmospheric Environment
Service of Environment Canada of the ground snow
loads for the mountainous regions of western Canada
(including British Columbia, the southern Yukon and
the foothills of Alberta). This reassessment is based
on new snow course observations from various
provincial and territorial agencies.
.
'third revisions and errata
Supplement t o the NBC 1990 January 1993
Chapter
1
Design Data for Selected Locations in
Canada,
pp.
13-15,29-30
Chapter
4
Commentary B Wind Loads
Rounded Structures, Para. 44
Commentary J Effects of Earthquakes
Table J-2
Commentary M Structural Integrity of Firewalls
Reference (1
)Province and Location 100 Mile House Abbotsford Agassiz Alberni
e
e
Beatton River Burns Lake Cache Creek Campbell River Carmie
Duncan Fernie Fort Nelson Fort St. John Castlegar Chetwynd Chilliwack Comox Courtenaye
e
Cranbrook Crescent Valley Crofton Dawson Creek Dog Creek Kamloops Kaslo Kelowna Kimberley Kitimat Plant Kitimat Townsite Lillooet Lytton Mackenzie Column 1e
e
Design Data for Selected Locations in Canada
Glacier Golden Grand Forks Greenwood Hope Degree- Days Below 1 8°C Design Temperature 15 Min. Rain mm One Day Rain mm 5 1 83 116 125 45 50 48 63 105 98 51 63 122 113 103 43 52 76 67 47 110 54 106 8 1 80 71 59 4 1 107 106 57 January Ann. Tot. Ppn. mm - 2 8 - 3 1 30 18 - 1 0 - 1 1 29 20 - 1 3 - 1 5 31 20 - 5 - 7 31 18 - 25 - 28 34 20 - 3 7 - 3 9 25 18 - 3 0 - 3 3 25 17 - 25 - 28 34 20 - 7 - 9 26 18 - 24 - 26 33 20 - 1 9 - 2 2 32 20 - 3 5 - 3 8 27 18 - 1 2 - 1 3 30 20 - 7 - 9 27 18 - 7 - 9 28 18 - 2 7 - 3 0 32 19 - 2 0 - 2 3 31 19 - 6 - 8 28 18 - 3 6 - 3 9 27 18 - 2 8 - 3 0 29 18 - 6 - 8 29 18 - 2 8 - 3 1 29 19 - 2 9 - 3 2 29 19 - 4 0 - 4 2 28 18 - 36 - 38 26 2.5 '10 "C July 2.5 O/O
I
seii;ic
I
GroundI
Hourly Pressures Wind 1 % "C Dry "C Wet "C Snowss
1110 kPa Load kPas,
za
2.4 1.8 2.2 2.7 1.5 3.0 2.7 1.5 3.0 3.5 3.8 2.2 2.0 2.4 2.4 2.7 3.8 1.6 2.3 1.6 1.6 3.3 4.1 2.2 2.5 8.5 3.4 2.5 3.6 2.5 1.6 2.5 1.5 2.7 5.0 5.9 1.9 2.5 3.4 10 1130 kPa 0.3 0.3 0.6 0.4 0.1 0.1 0.2 0.2 0.4 0.2 0.1 0.2 0.3 0.4 0.4 0.2 0.1 0.2 0.2 0.2 0.4 0.2 0.2 0.1 0.1 0.2 0.2 0.1 0.1 0.6 0.2 0.1 0.1 0.2 0.7 0.7 0.1 0.3 0.21
11 0.30 0.42 0.55 0.47 0.28 0.22 0.30 0.29 0.46 0.24 0.23 0.32 0.48 0.45 0.45 0.22 0.22 0.48 0.31 0.31 0.48 0.27 0.33 0.19 0.31 0.24 0.27 0.26 0.29 0.41 0.30 0.22 0.34 0.22 0.27 0.27 0.32 0.31 0.24 12 1/100 kPazV
Zonal Velocity Ratio v 13 0.36 0.55 0.75 0.58 0.35 0.27 0.36 0.35 0.58 0.33 0.30 0.37 0.63 0.58 0.58 0.29 0.29 0.58 0.37 0.37 0.58 0.37 0.43 0.24 0.36 0.29 0.32 0.36 0.39 0.55 0.37 0.28 0.43 0.29 0.33 0.33 0.39 0.39 0.29 13 1 4 3 5 1 0 1 1 6 1 1 0 4 6 6 1 1 5 0 1 5 1 1 0 0 1 1 1 1 3 1 1 1 1 2 2 1 2 0 15 0.43 0.71 1 .OO 0.70 0.43 0.34 0.43 0.43 0.72 0.44 0.39 0.44 0.83 0.74 0.74 0.37 0.37 0.69 0.44 0.44 0.69 0.50 0.55 0.29 0.42 0.35 0.38 0.48 0.52 0.73 0.45 0.36 0.53 0.37 0.40 0.40 0.49 0.49 0.35 14 1 4 3 5 2 1 3 2 6 1 1 1 4 6 6 1 1 5 1 2 5 1 1 1 1 1 1 1 1 3 1 1 1 1 4 4 2 2 2 16 0.05 0.20 0.15 0.30 0.10 0.05 0.15 0.10 0.40 0.05 0.05 0.05 0.20 0.40 0.40 0.05 0.05 0.30 0.05 0.10 0.30 0.05 0.05 0.05 0.05 0.05 0.05 0.05 0.05 0.15 0.05 0.05 0.05 0.05 0.20 0.20 0.10 0.10 0.10 17Design Data for Selected Locations in Canada
(Cont'd) Province and Location Masset McBride McLeod Lake Merritt Mission City Montrose Nakusp Nanaimo Nelson Ocean Falls OSOYOOS Penticton Port Alberni Port Hardy Port McNeill Powell River Prince George Prince Rupert Princeton Qualicum Beach Quesnel Revelstoke Salmon Arm Sandspit Sidney Smith River Smithers Squamish Stewart Taylor Terrace Tofino Trail UclueletVancouver & Region Burnaby (Simon Fraser Univ.) Cloverdale Haney
I
Column 1 Degree- Days Below 180C 3855 5078 5800 4348 3064 3683 3988 3065 3734 3627 3289 3502 3152 3674 3459 3056 5376 3987 4531 3236 4938 4201 3945 3668 3083 7616 5431 3379 4654 6122 4380 3316 3574 3120 3307 3102 3264 6 Design Temperature July Dry "C 17 30 27 34 30 32 31 26 31 23 33 33 31 20 22 26 28 19 32 27 30 32 33 15 26 26 25 29 23 January 2.5 O/o "C - 7 - 34 - 35 - 26 - 9 - 17 - 24 - 7 - 20 - 12 - 16 - 16 - 5 - 5 - 5 - 9 - 33 - 14 - 27 - 7 - 33 - 26 - 23 - 6 - 6 - 46 - 29 - 11 - 23 15 Min. Rain mm 13 13 10 8 13 10 10 8 10 13 10 10 10 13 13 8 15 13 10 10 10 13 13 13 8 8 13 10 13 15 13 13 10 13 10 8 10 7 2.5 o/o Wet "C 15 18 17 20 20 20 19 18 19 16 20 20 18 16 17 18 18 15 20 18 17 19 20 15 18 17 17 20 16 1 O/O - 9 - 37 - 37 - 29 - 11 - 20 - 27 - 9 - 24 - 14 - 18 - 18 - 7 - 7 - 7 - 11 - 36 - 16 - 30 - 9 - 35 - 29 - 26 - 7 - 8 - 48 - 31 - 13 - 25 18 16 16 20 16 17 20 20 5 - 3 6 - 20 - 3 8 26 - 22 25 19 One Day Rain. mm 76 50 63 57 98 51 51 92 66 234 35 45 140 131 127 80 50 14.1 37 102 72 78 43 80 102 68 60 112 178 56 117 174 51 140 172 102 117 8 Seismic 33 Ann. Tot. Ppn. mm 1403 652 802 319 1701 642 81 1 1019 669 4387 320 274 1987 1785 1555 1174 628 2463 372 1317 558 1006 533 1281 874 481 495 2285 1870 432 1234 3288 703 3335 1935 1322 2201 9za
6 0 0 1 4 1 1 4 1 2 1 1 5 6 6 5 0 3 2 4 0 1 1 6 6 1 1 3 2 - 2 - 7 - 8 - 9 2 - 4 19 - 9 25 - 1 0 , 29 ! - 11 30 3 1 4 1 DatazV
6 1 2 2 4 1 1 4 1 4 1 1 5 6 6 5 2 5 2 4 2 1 1 6 5 2 3 3 4 Zonal Velocity Ratio v 0.40 0.05 0.10 0.10 0.20 0.05 0.05 0.20 0.05 0.20 0.05 0.05 0.30 0.40 0.40 0.30 0.1 0 0.30 0.10 0.20 0.10 0.05 0.05 0.40 0.30 0.10 0.15 0.15 0.20 Ground Snow Hourly Wind 0.05 0.20 0.30 0.05 0.30 0.20 0.20 0.20 17 Load kPass
1.6 3.9 3.7 1.6 2.2 3.7 4.0 2.1 3.8 3.5 1 .O 1.2 2.7 0.8 1.0 1.7 3.1 1.7 2.6 2.0 3.1 5.3 3.2 1.6 1 .O 2.5 3.4 2.9 7.2 2.1 5.5 1 .O 3.7 0.9 2.6 2.3 2.2 10 0 1 2 4 1110 kPa 0.49 0.27 0.24 0.32 0.47 0.22 0.24 0.47 0.22 0.47 0.30 0.40 0.47 0.49 0.49 0.42 0.25 0.42 0.24 0.46 0.25 0.24 0.29 0.54 0.46 0.19 0.31s,
0.4 0.2 0.2 0.3 0.3 0.1 0.1 0.4 0.1 0.7 0.1 0.1 0.4 0.4 0.4 0.4 0.2 0.4 0.5 0.4 0.1 0.1 0.1 0.4 0.2 0.1 0.2 0.6 0.7 0.1 0.5 0.4 0.1 0.4 0.6 0.2 0.2 11 5 1 5 4 4 4 1 5 1 6 5 1 5 4 4 4 Pressures 1130 kPa 0.58 0.32 0.29 0.39 0.60 0.30 0.30 0.58 0.29 0.55 0.43 0.52 0.58 0.58 0.58 0.55 0.30 0.50 0.32 0.58 0.29 0.29 0.35 0.63 0.55 0.25 0.37 11100 kPa 0.68 0.38 0.35 0.49 0.77 0.41 0.37 0.71 0.37 0.65 0.59 0.68 0.70 0.66 0.68 0.71 0.36 0.59 0.42 0.72 0.34 0.35 0.43 0.74 0.66 0.33 0.44 0.65 0.48 0.44 0.40 0.74 0.33 0.74 0.72 0.72 0.77 14 0.38 0.50 0 3 2 0.39 0 . 3 2 , 0 . 3 7 0.27 1 0.33 0.54 0.17 0.54 0.49 0.46 0.47 12 0.63 0.24 0.63 0.58 0.58 0.60 13Design Data for Selected Locations in Canada (Cont'd) e e e e e Province and Location Ladner Langley New Westminster North Vancouver Richmond
Surrey (88 Ave. & 156 St) Vancouver
Vancouver (Granville & 41 Av) West Vancouver
Vernon Victoria & Region
Victoria (Gonzales Hts) Victoria (Mt Tolmie) Victoria Williams Lake Y O U ~ O U Alberta Athabasca Banff Barrhead Degree- Days Below 18°C 3253 31 17 2947 2978 3030 3067 2924 2880 3250 3887 2947 3150 3016 4920 2945 6256 5657 6088 Design January 2.5% "C - 6 - 8 - 8 - 7 - 7 - 8 - 7 - 6 - 8 - 20 - 5 - 6 - 5 - 31 - 5 - 35 - 30
/
- 34 5983 5307 5321 6088 5885 4870 4848 6166 5404 5879 5207 5283 5782 6027 6937 6166 4692 6661 6 1 % "C - 8 - 10 - 10 - 9 - 9 - 10 - 9 - 8 - 10 - 23 - 7 - 8 - 7 - 34 - 7 - 38 - 32 - 37 Temperature July Dry OC 27 29 29 26 27 29 26 28 28 33 23 24 24 29 31 28 27 28 l5 Min. Rain mm 10 8 10 10 8 10 10 10 9 13 9 9 5 10 10 18 18 20 - 38 - 34 - 33 - 37 - 35 - 33 -34 - 38 - 34 - 33 -34 -33 - 34 - 37 - 44 - 40 - 33 - 41 2.5 O/O Wet OC I 19 20 19 19 19 20 19 20 19 20 17 16 17 17 19 19 17 19 28 32 29 28 29 29 29 28 28 30 29 29 28 28 27 27 31 28 2 3 4 5 Beaverlodge 1 - 35 Brooks1
- 32 25 18 23 20 20 20 15 15 15 20 15 20 23 18 10 15 16 13 7 18 19 17 19 19 18 18 20 18 19 18 18 19 18 19 18 18 19 Calgary - 31 One Day Rain mm 62 118 132 100 114 131 94 93 139 40 83 74 81 37 114 88 53 102 Ann. TO[. Ppn. mm 982 1504 1578 1889 1113 1574 1329 1324 1933 381 647 790 845 400 1874 506 471 467 101 89 95 1 1 1 92 102 97 94 62 99 74 73 114 79 82 64 98 61 8 Campsie - 34 Camrose1
- 33 467 351 437 467 448 550 466 460 569 374 501 348 488 553 409 432 434 472 9 Ground Snow Cardston Claresholm Cold Lake Coleman Coronation Cowley Drumheller Edmonton Edson Embarras Portage Fairview Fort MacLeod Fort McMurray Column 1 15 Load kPass
1.2 2.2 2.1 2.7 1.4 2.2 1.6 1.7 2.2 2.0 1.4 1.9 1 .O 2.2 3.5 1.4 3.3 1.6 - 30 -31 - 36 - 31 - 31 1 - 3 1 -31 - 32 - 34 - 41 - 38 - 31 - 39 1110 kPa 0.45 0.45 0.44 0.44 0.45 0.46 0.45 0.45 0.45 0.32 0.49 0.49 0.48 0.30 0.46 0.30 0.39 0.32s,
~
0.2 0.2 0.2 0.3 0.2 0.3 0.2 0.3 0.2 0.1 0.3 0.3 0.2 0.2 0.6 0.1 0.1 0.1 2.2 1.1 1 .O 1.6 1.8 1.4 1.2 1.6 2.5 2.0 1.5 1.1 1.6 1.9 1.7 2.4 1.1 1.3 10 0.1 0.1 0.1 0.1 0.1 0.1 0.1 0.1 0.3 0.1 0.1 0.1 0.1 0.1 0.1 0.1 0.1 0.1 1 1 0.27 0.39 0.40 0.32 0.21 0.74 0.66 0.31 0.54 0.23 0.73 0.32 0.32 0.36 0.31 0.26 0.68 0.27 12 Hourly Wind Pressures 1130 kPa 0.55 0.58 0.55 0.55 0.55 0.58 0.55 0.55 0.55 0.39 0.58 0.58 0.58 0.35 0.55 0.37 0.45 0.39 Seismic Data Zonal Velocity Ratio v 0.20 0.20 0.20 0.20 0.20 0.20 0.20 0.20 0.20 0.05 0.30 0.30 0.30 0.10 0.20 0.05 0.05 0.05za
5 4 4 4 4 4 4 4 4 1 6 6 6 1 4 0 0 0 11100 kPa 0.67 0.73 0.68 0.68 0.67 0.72 0.67 0.67 0.67 0.49 0.69 0.69 0.70 0.41 0.66 0.45 0.52 0.49zv
4 4 4 4 4 4 4 4 4 1 5 5 5 2 4 1 1 1 0.33 0.48 0.46 0.39 0.29 0.93 0.80 0.37 0.69 0.32 0.91 0.39 0.40 0.43 0.37 0.32 0.83 0.32 13 0.05 0.00 0.05 0.05 0.00 0.00 0.00 0.00 0.05 0.00 0.05 0.00 0.05 0.05 0.00 0.05 0.00 0.00 17 0 0 0 0 0 0 0 0 1 0 0 0 0 0 0 0 0 0 15 0.40 0.57 0.54 0.49 0.39 1.15 0.96 0.44 0.87 0.43 1.13 0.49 0.51 0.50 0.45 0.39 1.00 0.38 14 1 0 1 1 0 0 0 0 1 0 1 0 1 1 0 1 0 0 16Design Data for Selected Locations in Canada
(Cont'd)e
e e e Province and Location Twin Falls Wabana Wabush Yukon Aishihik Dawson Destruction Bay Snag Teslin Watson Lake Whitehorse Northwest Territories Aklavik Alert Arctic Bay Baker Lake Cambridge Bay Chesterfield Inlet Clyde River Coppermine Coral Harbour Eskimo Point Eureka Fort Good Hope Fort Providence Fort Resolution Fort S~mpson Fort Smith Frobisher Bay Hay River Holman lnuvik lsachsen Mould Bay Norman Wells Nottingham Island Port Radium Rae-Edzo Column 1 Degree- Days Below 18°C 7650 4800 7939 8155 8409 8200 8773 7213 7766 6988 9849 13186 11693 10990 12037 10768 11006 10758 10751 10100 13733 9415 8031 8043 81 01 7786 9928 7902 11086 10101 13535 13047 8903 9716 91 14 8800 Design January 2.5% "C - 35 - 15 - 35 - 44 - 50 - 43 - 51 - 41 - 46 - 41 - 44 -43 - 43 - 45 - 45 - 40 - 41 - 44 - 41 - 40 - 47 - 46 - 44 -42 - 45 - 43 - 40 - 41 -43 - 46 - 46 - 45 - 46 - 38 - 44 - 44 1 % "C - 37 - 17 - 37 - 46 - 51 - 45 - 53 - 43 - 48 - 43 - 46 -45 - 45 - 46 - 46 - 41 - 43 - 45 - 43 - 41 - 48 - 48 - 46 -44 - 47 - 45 - 42 - 43 -45 - 48 - 48 - 47 - 47 - 40 - 46 - 46 Temperature july Dry "C 23 24 23 23 26 24 23 25 26 25 24 13 14 21 16 20 15 20 18 21 12 27 24 26 27 28 16 26 18 25 12 10 27 14 22 24 2 3 4 5l5
Min. Rain mm 15 18 15 8 8 8 8 8 8 8 5 3 3 3 3 5 5 5 5 5 3 5 8 8 8 8 5 8 3 5 3 3 5 5 5 5 6 7 8 2.5 46 Wet "C 18 20 18 16 16 15 16 16 16 15 16 9 10 15 13 14 9 13 13 16 9 17 18 18 18 19 1 1 18 12 16 9 8 17 13 16 17 One Day Rain mm 70 102 47 45 53 51 53 38 46 31 51 19 38 36 34 58 37 64 43 63 42 70 78 39 86 67 53 51 51 33 20 48 49 56 52 51 Ann. TO^. ppn. mm 950 1400 895 256 306 300 339 327 425 261 208 154 118 235 136 259 206 202 270 300 64 282 280 307 351 349 433 340 178 266 93 86 328 279 216 275 9 Ground Snow Load kPass
4.2 2.7 3.9 1.8 2.5 1.5 2.0 2.7 2.9 1.7 2.1 1.5 1.9 2.7 1.5 2.8 3.2 2.4 3.5 2.7 1.5 2.7 2.2 2.1 2.1 2.1 2.7 2.2 1.9 2.1 1.5 1.4 2.5 4.2 2.8 2.1 10 1/10 kPa 0.31 0.56 0.31 0.29 0.20 0.30 0.20 0.19 0.19 0.28 0.37 0.54 0.40 0.42 0.30 0.44 0.61 0.33 0.88 0.49 0.47 0.48 0.26 0.29 0.30 0.30 0.56 0.26 0.63 0.39 0.68 0.47 0.41 0.46 0.38 0.34 12s,
0.4 0.6 0.3 0.1 0.1 0.1 0.1 0.1 0.1 0.1 0.1 0.1 0.1 0.2 0.1 0.2 0.2 0.1 0.2 0.2 0.1 0.1 0.1 0.1 0.1 0.2 0.2 0.1 0.1 0.1 0.1 0.1 0.1 0.2 0.1 0.1 1 1za
0 1 1 3 2 4 3 1 1 2 1 0 1 0 0 0 5 0 1 0 1 1 0 0 0 0 1 0 0 1 4 1 0 1 0 0 15 Hourly Wind Pressures 1/30 kPa 0.37 0.69 0.37 0.35 0.24 0.35 0.24 0.25 0.24 0.34 0.52 0.69 0.50 0.50 0.34 0.52 0.80 0.42 1.20 0.59 0.60 0.67 0.32 0.36 0.37 0.37 0.69 0.32 0.78 0.55 0.83 0.60 0.58 0.58 0.48 0.43 13 1/100 kPa 0.44 0.84 0.44 0.42 0.28 0.42 0.28 0.34 0.30 0.42 0.72 0.87 0.62 0.59 0.39 0.62 1.02 0.52 1.59 0.71 0.76 0.93 0.39 0.44 0.46 0.46 0.84 0.39 0.95 0.76 1 .OO 0.76 0.79 0.72 0.59 0.53 14zV
0 1 1 5 4 6 5 4 2 4 2 0 1 0 0 0 3 1 0 0 0 1 1 1 1 1 0 1 1 2 1 1 1 0 1 1 116 Seismic Data Zonal Velocity Ratio v 0.00 0.05 0.05 0.30 0.20 0.40 0.30 0.20 0.10 0.20 0.10 0.00 0.05 0.00 0.00 0.00 0.1 5 0.05 0.05 0.00 0.05 0.05 0.05 0.05 0.05 0.05 0.05 0.05 0.05 0.1 0 0.05 0.05 0.05 0.05 0.05 0.05 17Design Data for Selected Locations in Canada
ICont'dl Province and Location Rankin Inlet Resolute Resolution Island Tungsten Yellowknife Column 1 One Day Rain. mm 51 25 70 51 45 8-
Design Temperature Dqree- Days Below 18°C 10700 12594 8878 7900 8530 6 Ann* Tot. Ppn. mm 280 131 313 645 267 9 l 5 Min. Rain mm 5 3 5 5 5 7 January 2.5 % "C - 40 - 44 - 35 - 49 - 43 2 July 2.5 % 1 Yo - 41 - 45 - 37 - 51 - 45 3 Dry "C 20 1 1 8 26 25 4 Wet "C 15 9 7 16 17 5 Ground Snow Load kPas,
2.8 1.6 4.8 4.0 2.0 10 Hourly Wind Pressures SR 0.2 0.1 0.2 0.1 0.1 1 1 1/10 kPa 0.46 0.52 0.85 0.29 0.34 12 Seismic Dataza
0 2 2 1 0 15 1130 kPa 0.55 0.63 1.10 0.39 0.43 13 11100 kPa 0.66 0.77 1.41 0.52 0.53 14zv
0 1 0 2 1 16 Zonal Velocity Ratio v 0.00 0.05 0.05 0.10 0.05 17third revisions and errata Chapter
4
Supplement t o the NBC f990 January f993
Commentary B Wind Loads
Rounded Structures
44.
For rounded structures (in contrast to sharp-
edged structures) the pressures vary with the wind
velocity, depending on the Reynolds nurrtber, Re,
(defined following Equation (11)). In Figures B-15, B-
16, B-19 and B-24, which have been translated and
reproduced from the Swiss tables,"" the Reynolds
number is expressed by d-,
where d is the di-
ameter of thLsphere or cylinder in metres and q is
essure in kilopascals. To convert to Re,
Table J-2
Peak Horizontal Ground Acceleration (PHA, g) and Peak Horizontal Ground Velocity (PHV, mls)
for Selected Localities and Probabilities of Exceedance
Probability of Annual Exceedance
Locality
('11
Notes to Table J-2:
1')
Geographical coordinates (ON, OW) used for the computation
are indicated.
(2)
Equivalent to the probability of 10 per cen,t in 50 years
employed for Figures J-1 and J-2.
P(50 yrs)
=1
-
(1
-
p(per a n n ~ m ) ) ~ ?
lnuvik
(68.30, 1 33.48)
Prince Rupert
(54.30, 130.43)
Victoria
(48.65, 123.43)
Vancouver
(49.18, 123.17)
Calgary
(51 .lo, 114.02)
Toronto
(43.67,79.63)
Ottawa
(45.32, 75.67)
Montreal
(45.47,73.75)
Quebec City
(46.80, 71.38)
Fredericton
(45.87,66.53)
IHalifax
(44.88, 63.52)
St. John's
(47.61,52.75)
Column 1
0.005
0.033
0.074
0.12
0.089
0.01 1
0.029
0.084
0.078
0.075
0.046
0.027
0.022
2
PH A
0.052
0.13
0.088
0.077
0.026
0.01 4
0.031
0.031
0.035
0.020
0.01 6
0.01 3
3
PHV
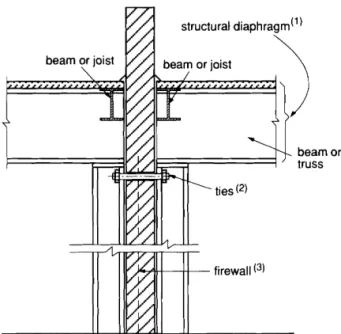
beam or joi
structural diaphragm(') st beam or ioist
Figure M-3
Schematic example of tied firewall
Notes to Figure M-3:
Structural diaphragm resistance may be required in accor-
dance with Paragraphs 1 1,12 and 13.
(2)
Ties must be located and detailed in accorda~ice
with
Paragraphs 11,12 and 13.
(3)
Firewall must be reinforced and detailed in accordance with
Paragraphs 4,5 and 10.
ties within a 10 m length of firewall; the other ties are
assumed to carry no force (see Figure M-5). The
factored resistance of the tie should include a reduc-
tion factor of 0.5 to take account of reduced yield
strength at high temperature.
13.
Alternatively, if the firewall is located so that
the roof structure has the same resistance to horizon-
tal forces on either side of the firewall (e.g., the
firewall is located mid-way between end walls or
expansion joints of a structurally symmetric build-
ing), only the tie need be designed for the factored
horizontal force wBL2
/
8s.
Reference
e
(1) Canadian Wood Council. Wood and Fire
Safety, Chapter 5, Structural Fire Protection,
Ottawa, 1991.
elongated hole (for
Figure M-4
Example of a weak-link connection used in wood
frame construction
Notes to Figure M-4:
( 1
Blocking connection to woodframe must be detailed to act as
a weak link in accordance with Paragraph 1 1
.
(2)