HAL Id: tel-01149552
https://tel.archives-ouvertes.fr/tel-01149552
Submitted on 7 May 2015HAL is a multi-disciplinary open access archive for the deposit and dissemination of sci-entific research documents, whether they are
pub-L’archive ouverte pluridisciplinaire HAL, est destinée au dépôt et à la diffusion de documents scientifiques de niveau recherche, publiés ou non,
Wei Gong
To cite this version:
Wei Gong. Heat storage of PCM inside a transparent building brick : Experimental study and LBM simulation on GPU. Thermics [physics.class-ph]. INSA de Lyon, 2014. English. �NNT : 2014ISAL0063�. �tel-01149552�
Thèse
Heat storage of PCM inside a transparent
building brick:
experimental study and LBM simulation
on GPU
Présentée devant
L’institut national des sciences appliquées de Lyon
Pour obtenir
Le grade de docteur
Formation doctorale
Energétique
École doctorale
École doctorale MEGA (Mécanique, Energétique, Génie Civil, Acoustique)
Par
Wei GONG
Soutenue le 25 Juin 2014 devant la Commission d’examen
Jury MM.
G. FRAISSE Professeur des universités (Université de Savoie) Rapporteur H. NAJI Professeur des universités (Université d’Artois) Rapporteur K. JOHANNES Maître de Conférences (UCBL Lyon 1)
F. KUZNIK Maître de Conférences, HDR (INSA de Lyon) J. VIRGONE Professeur des universités (INSA de Lyon)
CHIMIE
CHIMIE DE LYON
http://www.edchimielyon.fr
Sec : Renée EL MELHEM Bat Blaise Pascal 3e etage
04 72 43 80 46 Insa : R. GOURDON M. Jean Marc LANCELIN Université de Lyon – Collège Doctoral Bât ESCPE 43 bd du 11 novembre 1918 69622 VILLEURBANNE Cedex Tél : 04.72.43 13 95 directeur@edchimielyon.fr E.E.A. ELECTRONIQUE, ELECTROTECHNIQUE, AUTOMATIQUE http://edeea.eclyon.fr Sec : M.C. HAVGOUDOUKIAN eea@eclyon.fr M. Gérard SCORLETTI Ecole Centrale de Lyon 36 avenue Guy de Collongue 69134 ECULLY Tél : 04.72.18 60.97 Fax : 04 78 43 37 17 Gerard.scorletti@eclyon.fr
E2M2 EVOLUTION, ECOSYSTEME, MICROBIOLOGIE, MODELISATION
http://e2m2.universitelyon.fr
Sec : Safia AIT CHALAL Bat Darwin - UCB Lyon 1 04.72.43.28.91 Insa : H. CHARLES Mme Gudrun BORNETTE CNRS UMR 5023 LEHNA Université Claude Bernard Lyon 1 Bât Forel 43 bd du 11 novembre 1918 69622 VILLEURBANNE Cédex Tél : 06.07.53.89.13 e2m2@ univlyon1.fr EDISS INTERDISCIPLINAIRE SCIENCES-SANTE http://www.edisslyon.fr
Sec : Safia AIT CHALAL Hôpital Louis Pradel - Bron 04 72 68 49 09 Insa : M. LAGARDE Safia.aitchalal@univlyon1.fr Mme Emmanuelle CANETSOULAS INSERM U1060, CarMeN lab, Univ. Lyon 1 Bâtiment IMBL 11 avenue Jean Capelle INSA de Lyon 696621 Villeurbanne Tél : 04.72.68.49.09 Fax :04 72 68 49 16 Emmanuelle.canet@univlyon1.fr INFOMATHS INFORMATIQUE ET MATHEMATIQUES http://infomaths.univlyon1.fr
Sec :Renée EL MELHEM Bat Blaise Pascal 3e etage infomaths @univlyon1.fr Mme Sylvie CALABRETTO LIRIS – INSA de Lyon Bat Blaise Pascal 7 avenue Jean Capelle 69622 VILLEURBANNE Cedex Tél : 04.72. 43. 80. 46 Fax 04 72 43 16 87 Sylvie.calabretto@insalyon.fr Matériaux MATERIAUX DE LYON http://ed34.universitelyon.fr Sec : M. LABOUNE PM : 71.70 –Fax : 87.12 Bat. Saint Exupéry
Ed.materiaux@insalyon.fr M. JeanYves BUFFIERE INSA de Lyon MATEIS Bâtiment Saint Exupéry 7 avenue Jean Capelle 69621 VILLEURBANNE Cedex Tél : 04.72.43 83 18 Fax 04 72 43 85 28 Jeanyves.buffiere@insalyon.fr MEGA
MECANIQUE, ENERGETIQUE, GENIE CIVIL, ACOUSTIQUE
http://mega.universitelyon.fr
Sec : M. LABOUNE PM : 71.70 –Fax : 87.12 Bat. Saint Exupéry
mega@insalyon.fr M. Philippe BOISSE INSA de Lyon Laboratoire LAMCOS Bâtiment Jacquard 25 bis avenue Jean Capelle 69621 VILLEURBANNE Cedex Tél :04.72 .43.71.70 Fax : 04 72 43 72 37 Philippe.boisse@insalyon.fr ScSo ScSo* http://recherche.univlyon2.fr/scso/
Sec : Viviane POLSINELLI
Mme Isabelle VON BUELTZINGLOEWEN
Université Lyon 2 86 rue Pasteur 69365 LYON Cedex 07
Résumé
A présent, les bâtiments résidentiels et commerciaux sont en phase de de-venir le secteur le plus consommateur d’énergie dans de nombreux pays, comme par exemple en France. Diverses recherches ont été menées de ma-nière à réduire la consommation énergétiques des bâtiments et augmenter leur confort thermique. Parmi tous les différentes approches, la technolo-gie du stockage de chaleur latent se distingue par une très bonne capacité à stocker la chaleur afin de réduire les écarts entre la disponibilité et la demande d’énergie.
Dans le cadre de l’un de nos projets, nous avons l’intention d’intégrer au design des murs des bâtiments un type de brique transparente remplie de matériaux à changement de phase (MCP). Les MCP à l’intérieur de la brique sont soumis à des changements de phase liquide-solide. Cette thèse s’attaque à la problématique du processus de fusion au sein de la brique.
Au cours de cette thèse, une méthode expérimentale non-intrusive a été développée afin d’améliorer les techniques expérimentales existantes. La vélocimétrie des images des particules (VIP) et la fluorescence induite par laser (FIL) ont été couplées pour étudier la convection naturelle et la distribution de la température. Puisqu’aucun thermocouple n’a été inséré au sein de la brique, le processus de la fusion a été considéré sans perturba-tion. Les résultats montrent que cette conception expérimentale a un ave-nir prometteur, même si elle reste à améliorer. Par la suite, nous présentons deux simulations numériques. Ces simulations se fondent sur la méthode de Boltzmann sur réseau à temps de relaxation multiple (LBM MRT), em-ployée pour résoudre le champ de vitesse, et sur la méthode de différences finies, pour obtenir la distribution de la température. La méthode d’en-thalpie a quant à elle été utilisée pour simuler le changement de phase. Les simulations en deux dimensions et trois dimensions ont toutes deux été réalisées avec succès. Point important, ces simulations numériques ont été développées en langage C pour tourner spécifiquement sur un processeur graphique (GPU), afin d’augmenter l’efficacité de la simulation en profitant de la capacité de calcul d’un GPU. Les résultats des simulations concordent bien avec les résultats de nos expériences et avec les résultats analytiques publiés.
Mots-clefs : changement de phase, fusion, convection naturelle, détermi-nation de l’interface des phases, méthode enthalpique, matériaux à chan-gement de phase (MCP), stockage de chaleur latent, méthode Boltzmann sur réseau, calculs avec haute performance, processeur graphique (GPU), économie d’énergie dans les bâtiments.
Abstract
The domestic and commercial buildings are currently becoming the major sector that consumes the biggest share of the energy in many coun-tries, for example in France. Various researches have been carried out in order to reduce the energy consumption and increase the thermal com-fort of builds. Among all the possible approaches, the latent heat storage technology distinguishes itself because of its excellent heat storage ability which can be used to efficiently reduce the discrepancy between the energy consumption and supply.
In one of our project, we intend to integrate a type of transparent brick filled with phase change material (PCM) into the buildings’ wall design. The PCM inside the brick undergoes the solid-liquid phase change. This dissertation addresses the important issues of the melting process inside the brick.
In this dissertation, a non-intrusive experimental method was propo-sed to improve the existing experiment technique. The particle image velo-cimetry (PIV) and the laser-induced fluorescence (LIF) were coupled to in-vestigate the natural convection and the temperature distribution. Because there was no thermocouple installed inside the brick, the melting process was thus considered to be less impacted. The results showed that this ex-perimental design has a promising future, yet still needs to be improved.
Two sets of efficient numerical simulations were also presented in this dissertation. The simulations were based on the thermal lattice Boltzmann method (TLBM), where the natural convection got solved by the LBM and the temperature equation was solved by the finite difference scheme. The enthalpy method was employed to simulate the phase change. Both the 2-dimensional and 3-dimensional configurations were successfully simulated. Moreover, the simulation programs were specifically developed -using the C language - to be run on the graphic processing unit (GPU), in order to increase the simulation efficiency. The simulation results demons-trated a good agreement with our experimental results and the published analytical results.
Keywords :phase change, melting, natural convection, phase interface determination, enthalpy method, phase change material (PCM), latent heat storage, lattice Boltzmann method, high performance computing, graphics processing unit (GPU), building energy saving
Symbol Description Unit/definition General symbols eα LB velocity u macroscopic velocity m/s Cp specific heat J/(kg·◦C) k conductivity W/(m·◦C) l liquid fraction % t physical time s T temperature ◦C
H height of the PCM container
L width of the PCM container or latent heat content LX, LY, LZ the lattice dimension of calculation domain fα distribution function
fαeq Maxwell distribution function
ωα weight coefficient of Maxwell distribution
Greek letters
α thermal diffusivity m2/s
δx discretized space
δt discretized time
ν viscosity m2/s
β thermal expansion coefficient K−1
λ latent heat J/kg
ρ density kg/m3
ξ molecule velocity
Dimensionless numbers Fo Fourier number αt H2 Nu Nusselt number hH k Pr Prandtl number ν α Ra Rayleigh number gβ∆TH 3 να
Ste Stefan number cp∆T
Lh Superscript and Subscript
∗ dimensionless value
LB lattice values
x, y, z coordinates on x, y, z axes
α index of discrete value in LBM
w west wall
e east wall
s south wall or solid phase
n north wall
f front wall or melting
b back wall
l liquid phase
1.1 Percentages of different energy types in the total energy
con-sumed in 2012 . . . 5
1.2 Classification of energy storage [4] . . . 7
1.3 The general classification of PCMs . . . 13
1.4 Typical DSC measurement output curves [11] . . . 16
1.5 Time lag φ and decrement factor f of the indoor temperature as against the outdoor temperature [12] . . . 16
1.6 The indoor and outdoor temperature evolutions [13] . . . 17
1.7 The heat capacities of some building materials before and after the incorporation of PCMs [17] . . . 19
1.8 SEM image of PCM micro-capsules in gypsum plaster [19] . 20 1.9 Shape-stabilized PCM . . . 21
1.10 Direct mixing and laminated PCM board [30] . . . 22
1.11 Schematic of electric floor heating system with shape-stabilized PCM plates [35] . . . 23
1.12 Installation of ceiling panels in building interior as suspended ceiling [36]. . . 24
1.13 Trombe wall . . . 26
1.14 Crystallisation process of S27 (upper part of the window). The material solidifies in the shape of crystal needles which keep growing until they draw through the whole container (picture sequence up to down) [31]. . . 27
1.15 Four-region model for scale analysis [54] . . . 32
1.16 Transparent brick (filled with PCM) . . . 37
2.1 Diagram of a modern PIV system . . . 47
2.2 Polar distribution of the scattered light intensity of different particles sizes [92] . . . 49
2.3 Single frame technologies [93] . . . 51
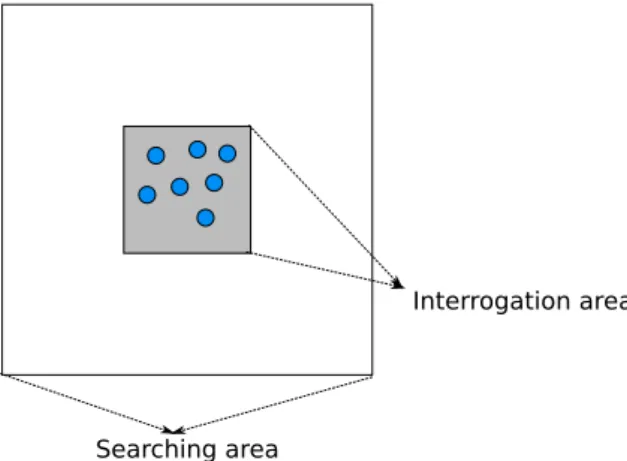
2.5 Interrogation area in the first frame and searching areas in
the second frame . . . 53
2.6 Diagram of combined LIF and PIV test . . . 54
2.7 The spectrum characteristics of Rhodamine B [89] . . . 56
2.8 Experimental equipments . . . 58
2.9 The mixture of n-octadecane and Rhodamine B (in liquid phase) . . . 60
2.10 Transparent brick (with n-octadecane inside) . . . 61
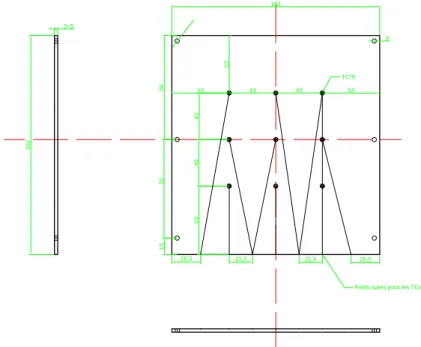
2.11 The design dimensions of the brick (unit: mm) . . . 61
2.12 The two vertical sides are replaced by two heat exchangers . 62 2.13 The design dimensions of the aluminium plate (unit: mm) . 62 2.14 Pass percentage of different wavelength of the filter . . . 63
2.15 The lenses to expand the laser beam to a sheet . . . 64
2.16 Boundary and initial conditions. Tw = Tinit = 27.8◦C, Te = 35◦C, under this configuration, the Ra=2.48×10⁸. . . . 66
2.17 The four melting stages of the solid-liquid interface . . . 67
2.18 The interface evolution at different heights . . . 68
2.19 Melting velocity of the interface at different y . . . 69
2.20 The melting interface. . . 69
2.21 Typical vector field . . . 70
2.22 Contour of velocity at moment 1 . . . 71
2.23 Contour of velocity at moment 2 . . . 72
2.24 Average Nu numbers of the hot wall . . . 73
2.25 The contours of temperature at three different moment . . . 74
3.1 Tow-body collision diagram . . . 84
3.2 D2Q9 scheme . . . 90
3.3 Experiment enclosure . . . 93
3.4 CUDA Block of threads and grid of blocks . . . 97
3.5 Memory structure of GPU . . . 98
3.6 CUDA hardware . . . 99
3.7 The propagation and temperature scheme . . . 101
3.8 Data structure . . . 101
3.9 Experiment configuration and diagram . . . 103
3.10 Grid dependence . . . 104
3.11 The evolution of melting interface with the dimensionless time: comparison between simulation and experiment. Ra= 2.48×10⁸, Pr=50, Ste =0.072 . . . 104
3.12 Average Nu number on the left vertical isothermal wall (Th) during melting of n-octadecane. Ra = 2.48×10⁸, Pr = 50, Ste=0.072 . . . 105
3.13 Temperature contours at four different τ. Ra = 2.48×10⁸, Pr=50, Ste=0.072 . . . 106
3.14 Streamlines at four different τ. Ra = 2.48×10⁸, Pr = 50,
Ste=0.072 . . . 107
3.15 Performance of implementation . . . 108
4.1 The D3Q19 stencil . . . 112
4.2 The algorithm for simulation . . . 116
4.3 Halo temperature arrangement . . . 118
4.4 Calculation domain . . . 119
4.5 The dispositions of the cross-sections, lines and their indexes 119 4.6 The relative errors of Nusselt number. (when time t=1500s, compared with the mean value and the Rayleigh number Ra=107) . . . 120
4.7 Isosurfaces of the velocity components when Ra = 2.48× 10⁸and τ=0.00312 (5000s) . . . 122
4.8 Streamlines on the cross-sections: S1, S2 and S3. When Ra= 2.48×10⁸and τ=0.00312 (5000s) . . . 123
4.9 The velocity components on the lines S1-1, S1-2 and L-S1-3. When Ra=2.48×10⁸and τ=0.00312 (5000s) . . . 125
4.10 The velocity components on the lines S2-1, S2-2 and L-S2-3. When Ra=2.48×10⁸and τ=0.00312 (5000s) . . . 126
4.11 The velocity components on the lines S3-1, S3-2 and L-S3-3. When Ra=2.48×10⁸and τ=0.00312 (5000s) . . . 127
4.12 The velocity components on the lines S4-1, S4-2 and L-S4-3. When Ra=2.48×10⁸and τ=0.00312 (5000s) . . . 128
4.13 The velocity components on the line L5. When Ra=2.48× 10⁸and τ=0.00312 (5000s) . . . 129
4.14 The temperature isosurfaces in the 3-dimensional simula-tion. Ra=2.48×10⁸and τ=0.00312 (5000s) . . . 130
4.15 The contours of temperature on the cross-sections: S1, S2 and S3. When Ra=2.48×10⁸and τ=0.00312 (5000s) . . . 131
4.16 The Nu number temporal evolution. The Ra = 2.48×10⁸ and τ=0.00312 (5000s) . . . 132
4.17 The solid-liquid interface at instant τ = 0.00312 (5000s): 2-dimensional and 3-2-dimensional simulations. (Ra=2.48×10⁸)132 4.18 The melting process when Ra=2.48×10⁸. . . 133
4.19 The average Nu number of the heating wall at different Ra numbers . . . 134
4.20 The average Nu number of the heat wall and the analytical results from [54] when Ra=106 . . . . 134
4.21 The average Nu number of the heat wall and the analytical results from [54] when Ra=107 . . . . 135
4.22 The average Nu number of the heat wall and the analytical results from [54] when Ra=108 . . . 135
4.23 The melting process when Ra=106. . . 137
4.24 The melting process when Ra=107. . . 138
1.1 Major regions’ energy consumption in the year 2012 (Million
tonne of oil equivalent) . . . 4
1.2 The energy consumed by different domains (France, 2008) [3] 5 1.3 A selection of PCMs . . . 15
2.1 Typical tracer particles for liquid flows [92] . . . 50
2.2 Possible error sources for LIF (extracted from [97,98]) . . . . 57
2.3 Thermophysical properties of n-octadecane [69] . . . 58
2.4 The sepcifications of Polyamide seeding particles . . . 59
2.5 Specifications of Refrigerated Bath . . . 60
2.6 Camera (model: Imager intense) specifications . . . 64
2.7 laser specifications . . . 64
2.8 Configuration for experiment setup under the laser light wave-length 532 nm and a desired pixel displacement of 16 pixels 66 2.9 Reference points for the evolution of interface (dimension-less form) . . . 68
3.1 Thermophysical properties of n-octadecane used for simu-lation [69] . . . 93
3.2 Specifications of the Tesla C2050 . . . 99
3.3 Experimental parameters . . . 103
4.1 Specifications of Tesla C2075 . . . 115
4.2 Simulation cases . . . 119
4.3 The values of Nusselt number at different mesh resolutions. When Ra=107, t=1500s . . . . 120
4.4 Band width of Nvidia Tesla C2075 GPU . . . 140
Résumé (in french) VII
Abstract IX
List of figures XVI
List of tables XVII
Preface 1
Background . . . 1
Organization of this thesis . . . 2
1 General Introduction 3 1.1 Energy and climate . . . 3
1.2 Energy storage . . . 6
1.2.1 Classification and applications . . . 7
1.2.1.1 Mechanical energy storage . . . 7
1.2.1.2 Chemical energy storage . . . 8
1.2.1.3 Biological storage . . . 9
1.2.1.4 Magnetic storage . . . 9
1.2.1.5 Thermal energy storage . . . 10
1.3 Latent heat storage . . . 11
1.3.1 Phase change materials . . . 12
1.3.1.1 General requirements . . . 12
1.3.1.2 Classification . . . 13
1.3.1.3 Thermophysical properties . . . 14
1.3.2 Application of LHS on buildings . . . 15
1.3.2.1 PCM implantation . . . 17
1.3.2.2 Different application scenarios . . . 22
1.3.2.2.1 The active heat storage system . . . 22
1.3.2.3 Heat performance enhancement . . . 28
1.3.3 Literature review on natural convection with phase change . . . 30
1.3.3.1 Experimental and analytical study . . . 30
1.3.3.2 Numerical study . . . 34
1.3.3.2.1 Adaptive mesh . . . 34
1.3.3.2.2 Fixed mesh . . . 35
1.4 Proposition of this research . . . 36
I Experimental method 41 2 Experimental study 45 2.1 Introduction . . . 45
2.2 Experimental design . . . 46
2.2.1 Study of the natural convection flow: particle image velocimetry . . . 46
2.2.1.1 Tracer particles . . . 47
2.2.1.1.1 Particle density and size . . . 48
2.2.1.1.2 Particles’ seeding . . . 49
2.2.1.2 Image recording . . . 50
2.2.1.3 PIV processing procedures . . . 50
2.2.1.3.1 Image preprocessing . . . 51
2.2.1.3.2 PIV processing . . . 52
2.2.1.3.3 Vectors post-processing . . . 53
2.2.2 Study of the temperature distribution: laser-induced fluorescence . . . 54
2.2.2.1 Theory of the LIF . . . 54
2.2.2.2 Spectra characteristics . . . 56
2.2.2.3 Error sources . . . 57
2.3 Experimental setup . . . 57
2.3.1 The PCM-Rhodamine mixture . . . 58
2.3.2 Transparent brick and water pump heat exchanger . 60 2.3.3 Heat flux meters and thermocouples . . . 61
2.3.4 Image capture and analysis unit . . . 63
2.3.4.1 Camera and filter . . . 63
2.3.4.2 Laser . . . 63
2.4 Experimental procedure . . . 64
2.4.1 The LIF calibration . . . 64
2.4.2 Experiment steps and configuration . . . 65
2.5 Results . . . 67
2.5.1 Melting process . . . 67
2.5.3 Velocity field . . . 68
2.5.4 Heat transfer rate . . . 73
2.5.5 Temperature contour . . . 74
2.6 Conclusions and remarks . . . 75
2.6.1 Conclusions . . . 75
2.6.2 Remarks on the combination of the PIV and the LIF . 76
II Numerical method 77
3 Numerical simulation on 2D 81
3.1 Introduction . . . 81
3.2 Lattice Boltzmann Method . . . 82
3.2.1 Boltzmann equation . . . 83
3.2.1.1 Collision invariant . . . 86
3.2.1.2 Maxwell distribution . . . 87
3.2.1.3 Boltzmann equation Bhatnagar-Gross-Krook (BGK) approximation . . . 87
3.2.2 Lattice Boltzmann equation . . . 88
3.2.2.1 LBGK . . . 88
3.2.2.1.1 Discretization of time and space . . 88
3.2.2.1.2 Discretization of molecule velocity 89
3.2.2.2 LBE-MRT . . . 90
3.3 Numerical modelling . . . 92
3.3.1 Definition of the problem . . . 92
3.3.2 Model construction . . . 93
3.3.2.1 The governing equations . . . 93
3.3.2.2 Energy equation . . . 94
3.3.2.3 Problem solving . . . 97
3.4 Nvidia GPU hardware and implementation . . . 97
3.4.1 GPU with CUDA architecture . . . 97
3.4.1.1 CUDA program pattern . . . 97
3.4.1.2 Memory types . . . 98
3.4.1.3 CUDA hardware . . . 99
3.4.2 Implementation . . . 100
3.4.2.1 Data and memory utilization . . . 100
3.4.2.2 Boundary conditions and simulation proce-dure . . . 101
3.5 Results and discussion . . . 102
3.5.1 Model validation . . . 102
3.5.1.1 Experiment configuration . . . 102
3.5.1.2 Model validation . . . 103
3.5.3 Performance of implementation . . . 108
3.6 Conclusions and remarks . . . 108
4 3-dimensional simulation results 111
4.1 Problem proposition . . . 111
4.2 Preliminary . . . 111
4.2.1 Hybrid LBM-MRT on the D3Q19 stencil . . . 111
4.2.2 Modelling for simulating melting . . . 114
4.3 Implementation . . . 115
4.3.1 GPU hardware . . . 115
4.3.2 GPU implementation . . . 115
4.3.2.1 Algorithm . . . 115
4.3.2.2 Maximizing the parallelism . . . 117
4.3.2.3 Decreasing the memory accessing latency . 117
4.3.2.4 Boundary conditions . . . 118
4.4 Results . . . 118
4.4.1 Grid dependence . . . 120
4.4.2 Velocity fields . . . 120
4.4.2.1 Isosurfaces of the velocities’ components . . 120
4.4.2.2 Velocities’ profiles on the cross-sections S1 S2 and S3 . . . 121
4.4.2.3 Velocities’ characteristics along the lines . . 121
4.4.3 Temperature distribution . . . 124
4.4.4 Heat transfer rate . . . 129
4.4.5 Solid-liquid interface . . . 130
4.4.6 Melting under different Rayleigh numbers . . . 132
4.4.7 Implementation performance . . . 136
4.5 Conclusions . . . 141
5 Conclusions and perspectives 143
Bibliography 149
Appendices 159
Background
W
E can never emphasize more the crucial role played by energy inthe sustainability of our human society nowadays than whenever before. This assertion attributes to two reasons. First, in the past decades, the biggest share of energy we used was from coal, natural gas and raw oil, known as fossil fuels. Notwithstanding until today we still count on them, the fact we must face is that these fossil fuels are going to an end. Second, the large utilization of traditional fossil energy has imposed huge impacts on our environment, such as notorious CO2 emission as well as the other sulfides.
Consequently, more and more researchers around the world are en-gaging themselves in finding new ways to get clean renewable sustain-able energy. Solar energy is undoubtedly one of the most attractive energy sources. It is available almost all the time, zero cost, no negative impacts on the environment. Basically, photoelectric and photothermal are two con-version methods to utilize solar energy. The main characteristic of solar energy is its time depending availability, which means only available in daytime and sunny hours. However, our needs for energy do not vary according to this. As a result, it needs an efficient heat storage way to col-lect the relatively abundant solar heat during the sunny daytime and use it later, for example, in the night.
Except for this significant application of heat storage technology from sustainable perspective, there exist plenty of other domains which also have something to do with heat storage technology in order to achieve their own purposes. Here illustrate two applications:
Electricity consumption varies between days and nights. The quotid-ian required electricity load for household changes based on the needs for maintaining the temperature inside a flat as well as cooking. This require-ment exaggerates especially at those places with notable temperature
fluc-tuation between day and night, as well as at those with extreme hot or cold environment. By contract, during midnight the requirement for elec-tricity becomes fable and the elecelec-tricity price is also lower. The existence of this peak need for electricity asks for a better design of electricity gen-eration plants and electrical distribution network, which absolutely will increase the cost of power plants. Besides, the end-users also need to de-crease their expenses on electricity. Those two basic requirements invoke the latent thermal energy storage which is an excellent way to partially transfer peak-load to another time period. For example, if we just take the big cities around the world into account, this thermal energy storage im-plementation could shift 200 to 300 MW every ten years for each of them.
Another phenomenon arises recent years is the so-called cloud calcu-lation in information domain. The fundamental infrastructure is located at lieu named data centres (most famous as Google, Facebook, Apple and Amazon). It has been announced that those data centres might be a huge black hole for energy especially for electricity. Beyond this, they all waste a great deal of energy in the form of wast heat mainly from the electronic de-vices. The heat storage technology can be used to store the waste heat then be took elsewhere and discharge this amount heat energy, such as heating up the flats.
Since the heat storage can be so versatile, there is no reason not to have a deeper understanding about it, such as its realization forms, material types, heat transfer peculiarities and sustainability etc.
Organization of this thesis
This thesis focuses on the latent heat storage, i.e. heat transfer process with solid-liquid phase change. In order to make this study self-contained, both experimental and numerical simulation are employed. Following a general introduction and bibliography study in chapter 1, chapter 2 dis-cusses the experimental part, a new experimental design will be proposed; chapter3and chapter4depict the numerical simulation, the melting pro-cess was calculated by thermal LBM method in both two and three dimen-sions. The solver is designed to run on a graphic process unit (GPU) to gain higher efficiency. This thesis finishes with the general conclusion and outlook.
Chapter
1
General Introduction
1.1
Energy and climate
The world’s overall industrialization process and humans’ increasing needs for better living conditions threaten the stability and reliability of the current energy structure. In addition to the conventional fossil fuels, known as coal, natural gas and crude oil, new energy sources have arisen, such as nuclear, biomass, wind or solar. What’s more, those unconven-tional energy sources are becoming more and more significant in the con-sideration of their environment friendly traits and sustainability.
In 1999, the total amount of energy consumed all over the world was 1.09×10¹⁴kWh (9.34×10⁹tonne of oil equivalent), of which different forms
accounted for: petroleum 4.34×10¹³kWh, natural gas 2.53×10¹³kWh, coal 2.46×10¹³kWh, nuclear 7.32×10¹²kWh, other energy (including
re-newable energy, hydro, geothermal, solar energy and wind energy) 8.67×10¹²kWh [1]. The world population in 1999 hit 6 billion, therefore the energy
con-sumption per capita in 1999 was around 1.82×10⁴kWh (about 1.56 tonne of oil equivalent), As a comparison the energy for sustaining basic human body need is 1.4×10⁴kJ/year (about 3.33×10⁻⁴tonne of oil equivalent).
In 2012, the world energy consumption was shown in table1.1[2]. The primary energy consumption reaches 12476.6 million tonne of oil equiva-lent, which is 33.6 % higher than that in 1999. At the same time, the renew-able and hydro energy consumption rises 43.8 % from 1999 to 2012, that is to say faster than the total primary energy consumption growth rate. We can see from theFigure 1.1that the major countries/regions in the world, the fossil fuels consistently account for more than 80 % of the total energy consumption, France being a slight exception with less than 55 %.
T able 1.1 – Major regions’ ener gy consumption in the year 2012 (Million tonne of oil equivalent) Regions T ype of energy source Oil Natural gas Coal Nuclear ener gy Hydr oelectricity Renewable ener gy Primary ener gy France 80.9 42.5 11.4 96.3 13.2 5.4 245.4 Germany 111.5 75.2 79.2 22.5 4.8 26.0 311.7 The United Kingdom 68.5 78.3 39.1 15.9 1.2 8.4 203.6 China 483.7 143.8 1873.3 22.0 194.8 31.9 2735.2 Japan 218.2 116.7 124.4 4.1 18.3 8.2 478.2 The United States 819.9 722.1 437.8 183.2 63.2 50.7 2208.8 Eur ope Union 611.3 443.9 293.7 199.8 74.0 95.0 1673.4 T otal of the world 4130.5 3314.4 3730.1 560.4 831.1 237.4 12476.6
0% 20% 40% 60% 80% 100% Fra
nceGermaTheny UKChinaJapanTheUSEU
Pe
rc
en
ta
ge Natural gasOil
Coal Nuclear energy Hydroelelctricity Renewable energy
Figure 1.1 – Percentages of different energy types in the total energy con-sumed in 2012
The total energy is roughly consumed by three major sectors, domestic and commercial buildings, industries, and transportation. Since housings require more and more energy to satisfy people’s needs for thermal com-fort, out of the the three means, domestic and commercial buildings are becoming one of the sector that consumes the most energy, especially in developed countries. For example, in 2008 the residential buildings con-sumed between 39.3% to 42.5% of the total energy concon-sumed in France [3], and 34.17% in Unite States [1]. The detailed energy consumption shares in France are shown in tableTable 1.2.
Table 1.2 – The energy consumed by different domains (France, 2008) [3]
Agriculture Buildings Industry Metallurgy Transportation Others (excluding metallurgy)
2.9% 39.3% 16.6% 3.8% 28.0% 9.4%
As mentioned before, the traditional fossil fuels are still massively em-ployed. Unfortunately causes severer environmental problems. The vast amount of carbon dioxide gas and other green house gasses released into the atmosphere, results in climate changing, unnatural heat waves and pre-cipitations, sea level rising and the deterioration of ozone layer. What’s more, the fossil fuels may still last for a couple of decades, but this period
of time should not be taken for granted. Whether to preserve our planet or to insure a reliable energy supply, we must took some measures to solve this environmental and energy problem.
At present, the thermal energy storage technologies are widely proven as an effectively way to alleviate the dependency on convectional fossil fu-els and as well as to increase the energy usage efficiency in the same time. In the next sections, we will give a detailed introduction about all the as-pects of energy storage, focusing on thermal energy storage technologies, from the classification of different heat storage ways, phase change mate-rials to their applications and so on.
1.2
Energy storage
The concept of energy storage has existed for long time, but the past recent years have seen an increasing attention being given to the subject. The principal purpose of energy storage is to enhance the energy utiliza-tions’ efficiency. It stores energy in one form or another at one time; so that the stored energy can be later withdrew for a particular need. As can be seen, this approach successfully separates the energy supply and the need. In reality, energy availability and demand rarely concur: solar energy is not available during the nights, wind energy is intermittent over the year. Besides, as the two examples mentioned above testified, it is in general more critical for renewable energy sources to decrease the discrepancy of availability and demand. The energy storage technologies thus are quite an essential topic in the research domain of the alternative energy.
Apart from the advantages aforementioned, energy storage has extra merits, such as [4]: reducing energy cost and consumption; reducing en-ergy system initial and maintenance cost; reducing equipment size and increasing its operation flexibility; reducing green house gasses; and, last but not least, decreasing the usage of convectional fossil fuels.
The energy demand in either industrial or domestic sectors vary with time. The energy suppliers have then to meet this demand. Generally speaking, there are two ways to achieve this: either by devising a more flexible energy supply system which adjusts according to the energy de-mand, or by finding a method to absorb the peak demand. From the eco-nomic point of view, devising a more complex and adaptable system re-quires more investment and maintenance. Energy storage, on the contrary, requires less investment.
In addition to the potential applications in the energy supply-demand industry, energy storage also exhibits its versatility in other domains. For commercial and residential buildings, energy storage can be used as an alternative to air-conditioning, significantly reducing the electricity con-sumption and alleviating the imbalance between the need and demand.
Figure 1.2 – Classification of energy storage [4]
At the same time, energy storage technologies also can help reducing the petroleum used for transportation as more and more cars and trucks will be driven by batteries in the future.
All in all, energy storage is a promising technology for solving our cur-rent problems regarding energy crisis, environmental deterioration. Its highly adaptable applications scenarios make it essential to upgrade the traditional fossil fuels utilization patterns; and as well to help developing highly efficient approaches to alternative energy sources. In next section, we summarize the classification and relevant applications of energy stor-age.
1.2.1 Classification and applications
The energy storage process is simply based on energy charging, dis-tributing and discharging on the end-user side. Depending on different re-alization systems and mechanisms, the energy storage technologies spread themselves into several distinct categories.Figure 1.2shows the classifica-tion of different energy storage approaches.
1.2.1.1 Mechanical energy storage
The fundamental principle is to store the energy in the form of mechan-ical energy. Generally it includes the potential energy and kinetic energy.
In some electricity generation plants, during the off-peak hours, the ex-tra power can be used to pumped up water to a high positioned reservoir. The electric energy is thus stored in the form of potential energy in the wa-ter. When there is a rush demand for electricity, the water is released and flows down trough a turbine to lower position and accordingly generates electricity. This is a very simple application, but has been largely used in a good deal of cases. The drawbacks are: 1. that the power plants must be lo-cated where it it possible to pump up water; 2. that the energy storage has low energy conversion rate, causing a large amount of energy to dissipate during the conversion.
Another similar case is the compressed air storage technology. When compressed by compressor, the air stores the energy with high pressure. Later, the compressed air can then release this part of energy by driving a gas turbine to generate electricity. To find the ideal containers to accommo-date the pressed air is quite a critical work. Currently, the possible choices are natural or man made caves under ground.
One of the cases that uses kinetic energy storage technology is the usage of flywheels, which store the energy in rotating flywheels made of either metals or other materials. The energy stored in flywheels is quantitatively small. For instance 1 Wh of equivalent energy is equal to the energy pos-sessed by a flywheel with mass of 1.8 kg at rotating velocity of 600 rpm. The flywheels can be used to store energy for temporary use. The automobiles, especially those in public transportation encounter a plenty of acceleration and deceleration when close to each stop. Normally, the brakes are widely used to decelerate. In this situation, a large amount of energy is wasted in the form of heat. However, flywheel can be used to store the energy dur-ing the deceleration process, and then release the energy when the engines are fired for acceleration. This substitution can economize at lease 50% of energy.
1.2.1.2 Chemical energy storage
The energy stored by chemical energy storage is obtained through re-versible chemical reactions. The reactions used to store energy can be clas-sified as thermochemical reactions and electrochemical reactions.
The thermochemical reactions which are suitable for energy storage are in general endothermic reactions. Those reactions must produce some types of output chemical products which are relatively physical stable and easily separable as well. This concept is shown as:
A+B+Thermal Energy−*)−C+D
When one reaction starts from left to right, it absorbs thermal energy in and produce C and D. C and D should have relatively stable forms and
could be easily separated. Thermal energy is stored after the reaction fin-ished. When the reaction starts in the opposite direction, the thermal ergy stored will therefore be released, which accomplishes the whole en-ergy storage cycle.
Oxidation reactions of metals or their oxides such as aluminum and potassium are good candidates [5]. Their reactions are expressed as:
2 Al2O3+Heat−*)−4 Al+3 O2 and
4 KO2+Heat−*)−2 K2O+3 O2
All of them can store massive amount of energy of the magnitude of MJ/kg. The operation temperature is also relatively high, between 300◦C to 800◦C. The applications of electrochemical reactions are well-known as batter-ies. The typical value of energy conversion rate of a battery is between 70-80%, which is higher than the one of mechanical energy conversion. Batteries are widely used in automotive industry, and have the potential to be implemented into the renewable energy system such as wind or photo-voltaic electricity generation. Nowadays, the major problems about bat-teries development remain the high cost, relative short life cycles and low unit energy capacity and energy density of the batteries.
1.2.1.3 Biological storage
The energy also can be stored in a biological system. Until now, there are somewhat scarce results published about biological energy storage [6]. Its low conversion rate is most probably the main hindrance.
1.2.1.4 Magnetic storage
The magnetic storage technology is based on the superconducting phe-nomenon [7]. Metals which have superconducting ability can have a large electricity current circulating within them without big dissipation. This is a very promising way to store electricity and transport it, since a large amount of electricity power is lost during the long-distance transportation. The key to trigger the superconducting phenomenon is to maintain a tem-perature close to absolute zero, which requires complex system and main-tenance. As a result, the high cost to implement large scale magnetic stor-age remains the main problem to be solved.
1.2.1.5 Thermal energy storage
In most situations, the energy is consumed in the form of energy flux, namely energy current. Thermal energy is the ultimate energy form that is widely used. Even for the electricity generation, heat is also used to gen-erate high temperature and high pressure stream to drive the generator to produce electricity. As a result, storing thermal energy is a highly efficient and fundamental way to store energy. Thermal energy can be stored ei-ther by rising the substance’s temperature or by changing the substances’ phase. According to the two different ways, thermal energy storage in-cludes sensible heat storage (SHS) and latent heat storage (LHS). In addi-tion, some researchers judge thermochemical energy storage as the third way for thermal energy storage. However in this thesis, thermochemical energy storage is categorized into the chemical energy storage.
Sensible heat storage
Theoretically, the sensible heat storage is realized by increasing the ma-terials’ temperature. Its storage ability depends on the mama-terials’ specific heat capacities and temperature difference, see Eq. (1.1)
Qsen =
Z T1
T0
mCpdT (1.1)
Where the T0, T1 refer to the initial temperature and final temperature
re-spectively. For same amount of mass(m) and same temperature difference (∆T = T1−T0), the whole quantity of heat stored is influenced only by
specific heat Cp. Normally, the specific heat capacity of different
materi-als is quite small, for example, the Cp of water is 4.2 kJ/kg· K and rock’s
is1.0 kJ/kg· K, paraffin RT58/RT60’s is even smaller, 0.9 kJ/kg · K.
Rocks/sands and water are the most widely chosen storage media. Based on different operation temperature ranges, the heat stored has dif-ferent exergy quality, so the sensible heat storage has difdif-ferent applica-tions [8]. For high temperature storage, sensible heat storage can be use in many industrial activities, such as waste heat recovery in most power plants and metallurgical factories. Low temperature heat storage has more applications in domestic life, for example, solar heating, building heating and cooling, and air-conditioning. The advantage of sensible heat storage is its relative low cost and easy implementation. Besides in most cases, the materials used to store sensible heat have high heat conductivity. While its disadvantage is also prominent. Due to the low specific heat capacity of the materials, the sensible heat storage systems are always giant in size, as they encounters a large temperature fluctuation, and needs a better dura-tion design.
Latent heat storage
As contrast, latent heat storage is based on the phase change heat. When phase change materials undergo melting, they absorb heat as fusion heat; when phase change materials become solid, they release the latent heat. The first advantage of latent heat storage is that , during phase change, the operation temperature has a narrow fluctuation, and sometimes the oper-ation temperature is even fixed; another advantage is that latent heat of fusion of phase change materials is noticeable large. As a result, the la-tent heat storage system achieves more compact sizes than its sensible heat storage counterpart. However, its significant weakness is that most phase change materials have lower heat conductivity. As a result, extra heat transfer enhancement approaches need to be considered in order to get better heat performance. The detailed introduction and literature review about latent heat storage will appear in the following section (Sec.1.3).
1.3
Latent heat storage
When taking latent heat storage into account, all the drawbacks of sen-sible heat storage convert to the advantages of latent heat storage. Phase change consists of solid-liquid phase change, liquid-gas phase change and gas-solid phase change, called evaporation or condensation, solidification or melting, sublimation or deposition respectively. Because of the existence of gas phase, gas-liquid phase change and gas-solid phase change undergo a considerable volume expansion, so they are not ideal ways for latent heat storage. As a result, when we talk about latent heat storage in this thesis, we are solely dealing with solidification and melting processes.
The materials used to store heat and at the same time encountering solidification and melting are called phase change materials (PCMs). From temperature T0lower than its melting temperature Tf to final temperature
T1 >Tf, the heat stored by PCMs can be formulated as follow:
Qlat =Qsen,l+mλ+Qsen,s (1.2)
where the subindex l, s signify liquid phase and solid phase; Qsenand Qlatare
sensible heat and latent heat, respectively. λ is latent heat of fusion. As we can see from the equation aforementioned, contrasted with sen-sible heat storage, the latent heat of PCM is generally very large, for in-stance, the latent heat of fusion of a typical PCM n-octadecane(C18H38) is 125 kJ/kg. To store Q kJ heat under temperature gradient∆T = 10◦C, for n-octadecane, the mass needed without melting is about 11 times more than in the process with melting. Thus, in order to store the same quan-tity of heat, latent heat storage requires lesser amount of material. Further-more, many kinds of PCM’s have a relatively negligible fusion temperature
fluctuation range, sometimes even isothermal. It means that heat transfer during the solidification and melting can progress under a high and sta-ble temperature gradient, and consequently, maintains a high heat transfer rate.
In the next sections, we will talk about the main aspects of solid-liquid latent heat storage.
1.3.1 Phase change materials
1.3.1.1 General requirements
Phase change materials (PCMs) are considered as critical element in or-der to fulfil the latent heat storage process. The phase change materials’ properties required for thermal energy storage vary according to applica-tion cases. However, there are a number of basic criteria that can be taken into consideration in order to select suitable substances as PCMs. Those criteria include thermal, physical, kinetic and chemical properties. One profound introduction about PCMs can be found in A. Abhat’s article [9].
From the aspect of thermal properties, the candidates should have: / high heat conductivity, which ensures high thermal performance; / reasonable phase change temperature, which is compatible with the
specific application;
/ high heat of fusion, which reduces the PCMs’ volume when storing a given amount of heat.
From the viewpoint of kinetic properties, they should have excellent nucleation ability and rate. This is a very critical index to judge the PCM’s supercooling effect during solidification. When the ambient temperature is lower than the fusion temperature, the PCM in the form of liquid will encounter solidification. The initial stage of solidification is attributed to nucleation. The nucleation generates small nucleus. Then the liquid PCM in the vicinity of nucleus starts to aggregate around those nucleus, and fi-nally, liquid becomes solid. However, PCMs that possess weak nucleation ability would maintain liquid phase even when the ambient temperature is lower than the fusion temperature. This phenomenon is called supercool-ing which is not welcomsupercool-ing when selectsupercool-ing the suitable PCMs.
Furthermore, the favourable physical properties that the PCM candi-dates should have are [10]:
/ nice phase equilibrium; / high density;
/ feeble volume change; / low vapour pressure;
Inorganic
Salt hydrade Metallics Paraffin Non-paraffin
Fa y acids Others
Figure 1.3 – The general classification of PCMs
and the favourable chemical properties are [10]: / long-term chemical stability;
/ absence of decay on the container materials; / absence of toxicity to humans;
/ not being combustible
Among those criteria, some need to be strictly observed, e.g. the chemi-cal properties; and some are not extremely critichemi-cal but can give better ther-mal performance if satisfied, e.g. thermophysical properties.
The next subsection will depict the classification of PCMs.
1.3.1.2 Classification
Basically, the PCMs can be categorized in three major groups [10]: or-ganic, inorganic and their mixtures (Figure 1.3).
In the category of organic PCMs, they can be subdivided into paraf-fins and parafparaf-fins, the latter consisting of fatty acids and other non-paraffins. Paraffins include mainly n-alkane, as well as some p-alkane, naphthalene and aromatic. Among them the mostly utilized type as PCMs is n-alkanes. Paraffins as PCM usually have chemically stable properties in application temperature range, and are neither toxic nor corrosive; paraf-fins also have considerably large latent heat of fusion, which can reduce the geometric size of the containers. In addition, the melting process of paraf-fins is congruent, has a fast nucleation rate and a very rare supercooling phenomenon. The shortcomings are also prominent. The paraffins have
relatively small heat conductivities, and smaller latent heat of fusion than inorganic PCMs; they can also decay the plastic used as containers; and are somewhat inflammable. Except for paraffins in the group of organic, the fatty acids are very common non-paraffin PCMs. The fatty acids in gen-eral have similar properties to paraffins but have a relatively higher latent heat of fusion; they also cost more than paraffins and possess noticeable corrosive ability.
The group of inorganic PCMs is composed of salt hydrates for the most part. They are the combination of salts with water molecules. Salt hydrates have high latent heat of fusion, higher heat conductivity than paraffins, are less corrosive on plastic; and usually can be bought for a reasonably low price. The drawbacks of salt hydrates is that they have supercooling phenomena at the beginning of solidification, which can reduce the heat performance; in addition, their melting process is not congruent, which can prevent salt hydrates from solidification-fusion recycling.
Another type of inorganic PCMs are pure metallics with low fusion temperature, for instance galium (Ga). The metallics have very distinct properties from the other PCMs. They have very high latent heat of fu-sion per unit mass and high density, as well as high heat conductivity and low specific heat capacity. Those properties give metallics different phase change phenomena which require more intense studies.
The third category, in a more strictly point of view, is derived from the other two categories. In this third group, the PCMs are mixtures of dif-ferent organic and/or inorganic substances. One special case occurs when this mixture has a relatively unique lower melting temperature than any of their ingredients. Consequently, this type of mixtures is called eutectic system.
Some typical PCMs from the three different categories were shown
inTable 1.3.
1.3.1.3 Thermophysical properties
As in the previous section, the thermophysical properties of PCMs in-clude heat conductivity, latent heat of fusion, specific heat capacity and temperature of fusion. In order to perform either experiments or numeri-cal simulations of phase change, it is of great importance to precisely obtain the thermophysical properties. However, the relevant properties recorded in the published references inevitably include some imprecisions and from time to time even errors. Consequently, it is recommended to perform test to obtain the thermophysical properties before the analysis a PCM phase change system.
There is a couple of different methods that could be used to carry out this measurement. For instance, differential thermal analysis (DTA) and
Table 1.3 – A selection of PCMs
Inorganic Organic Eutectic
Water-ice MgCl2· 4 H2O MgCl2· 6 H2O Mg(NO3)2· 4 H2O Zn(NO3)2· 4 H2O NaOH· H2O Na2CO4· 10 H2O CaBr2· 6 H2O FeCl3· 6 H2O FeCl3· 2 H2O NA2SIO3· 4 H2O Na2PO4· 12 H2O Gallium Paraffin RT60/RT58 n-Octadecane Acetic acid Capric acid Eladic acid Lauric acid Polyethelene glycol Tristearin Stearic acid Phenol Cetyl alcohol Oxalate Lauric-palmitic acid LiF−CaF2(80.5:19.5) ZnCl2−KCL (0.319:0.681) Bi−Cd−In eutectic Bi−Pb−In Bi−Pb−tin Bi−Pb
differential scanning calorimetry (DSC). The DSC is largely employed. It has two different configurations: power compensation DSC and heat flux DSC. Generally, a DSC measures the difference in heat flow rate (common unit: mW= mJ/s) between a sample (PCM) and inert reference (usually Al2O3) as a function of time or temperature. The sample size of a DSC test is very small, depending on the properties of the sample. For PCM, this value is typically couple of milligram.
The heat flow signal (dQ
dt) measured by DSC is defined in Eq.1.3, where f(T, t)is the heat flow that is a function of time at an absolute temperature;
dT
dt is the heating rate and C is the sample heat capacity equal to "sample
specific heat Cp×sample weight".
dQ dt =C
dT
dt + f(T, t) (1.3)
The typical output of a heat flux DSC measurement is one/several heat flow (mW/g) curve(s) as a function of temperature (◦C) at one/several heating rate (◦C/min). From those curves, we can obtain latent heat of fu-sion (the area between the curve peak and the phase change temperature); the phase change temperature (the intersection between the tangent line of the biggest slope and the base line), and the specific heat. A typical DSC curve is illustrated inFigure 1.4.
1.3.2 Application of LHS on buildings
The principal motive behind the employment of PCMs during modern building design is that the PCMs are able to increase the heat efficiency of
Figure 1.4 – Typical DSC measurement output curves [11]
Figure 1.5 – Time lag φ and decrement factor f of the indoor temperature as against the outdoor temperature [12]
modern buildings. One of the most important functions of buildings is to provide an amiable ambient temperature for us. This amiable temperature generally ranges from 18◦C to 28◦C . However, buildings’ inside temper-ature is considerably impacted by the exterior circumstances, for instance, the outside temperature, the wind speed, the solar radiation etc. The re-lation between indoor and outdoor temperatures are shown inFigure 1.5, from this figure we can find that the inside temperature fluctuates with the outside ambient temperature but has "time lag φ" and "decrement factor
f " [12].
On a larger scale of time than that inFigure 1.5, e.g. one year, the ex-terior and inex-terior temperatures evolve as shown inFigure 1.6. When the indoor temperature passes beyond the amiable temperature range, the ex-tra heat load must be added or removed either by air-conditioning or by
Figure 1.6 – The indoor and outdoor temperature evolutions [13]
heating system. Undoubtedly, the PCMs can be used to compensate this extra heat load, and as a result, to attenuate interior temperature fluctua-tion.
Furthermore, PCMs can also be used to economize expense by storing heat generated by electrical heating system during winter night and then release it in the daytime, since in many countries electricity price has an off-peak price discount. In addition, in summer, PCMs can be used to absorb the excessive solar radiation heat and maintain a bracing indoor ambience. From the brief description above, it is clear that the PCMs have a funda-mental role in optimization of buildings’ heat performance. Therefore, in this section we are going to give an account of the main aspects of a viable application of LHS - by means of PCMs - on buildings. It covers:
/ the possible ways to realize the PCMs implantation into buildings, their advantages and disadvantages (sec.1.3.2.1);
/ different application scenarios and their heat performances (sec.1.3.2.2); / the attainable approaches to enhance heat performance (sec.1.3.2.3);
1.3.2.1 PCM implantation
There exist many ways to implement the PCMs into buildings. One of the elaborate review articles on the subject of the PCMs implementation in building walls is given by Frédéric K. et al. [14]. However, we are going to classify these incorporation approaches from a different point of view.
PCMs without their physical forms In this approach of incorporation, PCMs
lose their original physical forms and mix well with the building envelop construction materials such as cement, concrete, gypsum and so on. This method can be called direct method.
The simplest direct incorporation is to mix the PCMs in liquid phase or solid powder status with the natural porous materials during the fabrica-tion process of building envelop, named as direct mixing approach. Feldman D. et al.made a laboratory scale gypsum board with 21%-22% of commer-cial butyl stearate. They announced that this new type of gypsum board had comparable physico-mechanical properties with the tradition gypsum board [15] but had ten-fold increase in capacity for storing and discharging of heat. This method of incorporation does not add extra procedure to the traditional building envelop fabrication process, and thus does not need additional facilities. Notwithstanding, the leakage is the major imperfec-tion [16].
Another direct incorporation method is characterized by its immersion process. The idea is similar to the direct mixing approach, as the PCMs are stored inside the pores of building materials. However, the incorpora-tion process is not integrated into the normal fabricaincorpora-tion process. Instead, the traditional building materials are dealt with by being completely im-mersed into liquid PCMs and until they get saturated with PCMs. After this treatment, the PCMs can stay inside the porous materials. H. Kaasinen studied the absorption of different PCMs into the porous building mate-rials [17], and found that the porous wall-board and gypsum board filled with PCMs had a considerable increment of heat capacity (Figure 1.7), and that different types of PCMs can give different heat capacity augmenta-tions (Figure1.7a, Figure1.7b). Regrettably, without post-treatment of the building materials, such as coating, the leakage still exists.
The common defections of the two methods are that the PCMs leak and that some PCMs have negative impacts on the mechanical characteristics of building materials [18,19]. In order to get rid of this leakage trouble and the interaction between PCMs with building matrix materials, the micro-encapsulations of PCMs appear as an alternative.
With micro-encapsulation, the PCMs are encapsulated inside polymer capsules before incorporated into the building materials. Because of the enclosure of the capsule, the leakage disappears. Those micro-capsules are incorporated into the building materials with the same process as the direct mixing approach. From the SEM picture (Figure 1.8), we could see the micro-capsules scatter homogeneously within a gypsum board and have a diameter around several µm [19]. Besides, if made of the appropriate inert materials as the capsule, the micro-encapsulation does not interact with the building matrix materials. As a results, the micro-encapsulation PCM materials have not only the same advantages as direct mixing approach, for instant easy incorporation, but also its proper advantage, such as increased heat transfer rate [19].
The three basic parameters of micro-encapsulation PCM power are the mean diameter of the capsule, the thickness of the capsules’ shell and the
(a) Carbonxylic acid as PCM
(b) Polyalcoholes acid as PCM
Figure 1.7 – The heat capacities of some building materials before and after the incorporation of PCMs [17]
Figure 1.8 – SEM image of PCM micro-capsules in gypsum plaster [19]
mass ratio of PCM as against the total mass. All of them can exert im-pacts on the thermal performance and mechanical characteristics of micro-encapsulation PCM powder. Yamagishi Y. et al. [20] studied the thermal
properties, rheological properties and the structural integrity of micro-encapsulation PCM powder. They evaluated the micro-encapsulation PCM powder with
diameters ranging from 5 µm to 1000 µm; and discovered that the struc-tural stability of the micro-encapsulation PCM powder had a dependence on their diameters. In addition, the supercooling of micro-encapsulated PCM induced by the size was detected through differential scanning calorime-try (DSC). The supercooling is attributed to the lack of nucleating agent when the size of micro-encapsulated PCM decreases. By adding 10.0 wt% of 1-octadecanol as a nucleating agent, X.-X. Zhang announced that the degree of supercooling of micro-encapsulated n-octadecane decreased ac-cording to DSC experimental results [21].
In the past couple of years, apart from the previous direct incorpo-ration methods, an innovative approach using shape-stabilized PCM has become a hot research topic [16,22,23]. A shape-stabilized PCM is a mix-ture of PCMs and supporting materials. The reported supporting materials are high-density polyethylene (HDPE) [24] and styrene-butadiene-styrene (SBS) [16]. TheFigure 1.9illustrates the shape-stabilized PCM and its micro structure.
A well-fabricated shape-stabilized PCM can incorporate PCMs with a mass proportion up to 80% and during the working cycles, there are no leaking cases are reported yet. As a matter of fact, due to the high mass proportion of PCM, shape-stabilized PCM’s thermophysical properties are similar to the traditional PCMs. Consequently it inherits both the advan-tages and disadvanadvan-tages of traditional PCMs, such as low heat conductiv-ity. However, published research papers reported that a suitable additive
(a) A piece of shape-stabilized PCM [25] (b) SEM image [22]
Figure 1.9 – Shape-stabilized PCM
can increase this heat conductivity [26].
PCMs with their physical forms In this approaches, the PCMs do not need to
be mixed with neither building materials nor support materials. They are filled into containers of variable geometrical shapes. Those filled contain-ers are after embedded into building envelop. The common shapes of those containers are rectangular and cylindrical. The containers’ materials are, for example, PVC or metals.
Rectangular shape In general, this type of containers are used as a
panel. Together with other types of panels, they could be employed to fabricate the building envelop, e.g. [27,28]. A. Carbonari et al. [29] numer-ically and experimentally tested this type building walls named as sand-wich panels. They found this sandsand-wich panels have a good heat perfor-mance and can also facilitate the fabrication of building envelop. Kim and Darkwa [30] evaluated another type of PCM multi-layer panels (
Fig-ure 1.10), and found that this panel could achieve 7% more phase change
process and 27% more latent heat than the PCM board from the direct mix-ing approach. Weinlader [31] filled PCM in a double glazing and said this type of windows had promising characteristics. This double glazing has 0.4 of light transmittances and 30% less heat loss in south oriented facades.
Cylindrical shape The PCMs are filled inside a cylindrical container and then built inside the building envelops. Voelker et al. [32] filled PCM into six tubes (63×1000 mm) and put them under the ceiling of testing room. Their results show that in summer the indoor peak temperature decreased by at least 4◦C.
Figure 1.10 – Direct mixing and laminated PCM board [30]
1.3.2.2 Different application scenarios
No matter which type of incorporation and where the PCMs are inte-grated into building, their essential task is to charge and discharge energy in the form of latent heat. Depending whether the process of LHS is driven by electricity or not, the PCM applications on buildings are classified as the positive system and the negative system.
1.3.2.2.1 The active heat storage system In the active systems, the phase change latent heat storage is driven by electricity, including building heating and cooling. Active systems are suitable to and mainly used to economize ex-pense on electricity, because the electricity consumption varies over day and night. In general, men consume less electricity during the night than the day. As a result, in most countries and regions, floating electricity pric-ing mechanisms are deployed, which means the electricity price adapts to this consumption variation, cheaper in the off-peak time period.
1.3.2.2.1.1 Electric heating floors One application scenario of the ac-tive system is floor heating in cold days. M. Amir [33] experimentally estimated the heat performance of two types of electric heat floors, one type being filled with water and another with n-octadecane. Two testing cases were carried out, where heat was stored in the form of sensible heat and latent heat. The results demonstrated that the concrete containing n-octadecane had less volumetric size, higher heat mass capacity and could attenuate the indoor temperature fluctuation more effectively than the con-crete containing water. Farid and Chen [34] simulated the utilization of a underfloor PCM layer combined with an electrical heating unit. The main purpose was to evaluate the possible advantages of increasing the heat mass of the building floor. The simulation results showed that after 8 hours
preheated by electricity during the off-peak period, this 30 mm thick PCM layer could continuously discharge heat and maintain the room tempera-ture for the entire coming daytime. The author also asserted that this type of underfloor application was also valid when applied to building walls or ceilings. Lin et al. [35] used the shape-stabilized PCM board in an under-floor heating system (Figure 1.11). The shape-stabilized PCM consisted of 75 wt· % paraffin as a dispersed PCM and 25 wt · % polyethylene as a sup-porting material (Figure1.9a). The paraffin’s phase transition temperature is 52◦C and its latent heat of fusion is about 200 kJ/kg. Three conclusions were drawn: 1. The system increased the indoor temperature without in-creasing the temperature difference; 2. The temperature of the PCM plates was kept at the phase transition temperature for a long period after the heaters stopped working. More than half of the total electric heat energy was shifted from the peak period to the off-peak period, which would pro-vide significant economic benefits; 3. Small indoor temperature difference along vertical direction appeared because the under-floor heating could warm the indoor air uniformly. The heating system was comfortable and energy-efficient.
Figure 1.11 – Schematic of electric floor heating system with shape-stabilized PCM plates [35]
1.3.2.2.1.2 Air-conditioning ceiling On the contrary of electric heat-ing system which is used in winter to store latent heat durheat-ing electricity off-peak time and discharge it over daytime (e.g.Figure 1.12), air-conditioning ceilings are used mostly in regions where the climate temperature varies significantly between day and night. During the day, the solar radiation is stored inside of PCM incorporated in the ceiling in the form of latent heat; during the night, the PCM is cooled down by, for example, fresh air venti-lation propelled by electricity driven fans or by compression refrigerators.
M. Koschenz et al. [36] described a thermally activated ceiling panel which included the compression refrigerators providing the necessary cool-ing energy. It was demonstrated, by numerical simulations and labora-tory tests, that a 5 mm layer of micro-encapsulated PCM (25% by weight)
Figure 1.12 – Installation of ceiling panels in building interior as suspended ceiling [36].
and gypsum suffices to maintain a comfortable room temperature in stan-dard office buildings. The system’s features also make it ideal for use in lightweight structures, the incorporation of additional thermal mass offer-ing an efficient means of moderatoffer-ing temperature amplitudes in this type of building. M. Jaworski [37] numerically and mathematically studied a form of PCM ceiling panel made of gypsum and micro-encapsulated PCM. Relevant experiments were performed to validate the numerical model. Results confirms that these ceiling panels effectively decrease the air tem-perature oscillation inside buildings.
1.3.2.2.2 The passive heat storage system The term passive means that, during
the heat storage process, the heat or cold sources are not from artificial energy, e.g. electricity, but from the nature. Solar radiation is one of the sources of greatest importance. Low temperature air during the summer night also is an ideal source of coldness. In a passive system, there is no commercial energy involved, making this type of system more attractive than the other.
The roofs and walls, together with the windows, are the most impor-tant parts that can absorb directly the solar radiation. Many successful application cases published can be found.
1.3.2.2.2.1 PCM walls One of the most well-applied and well-known
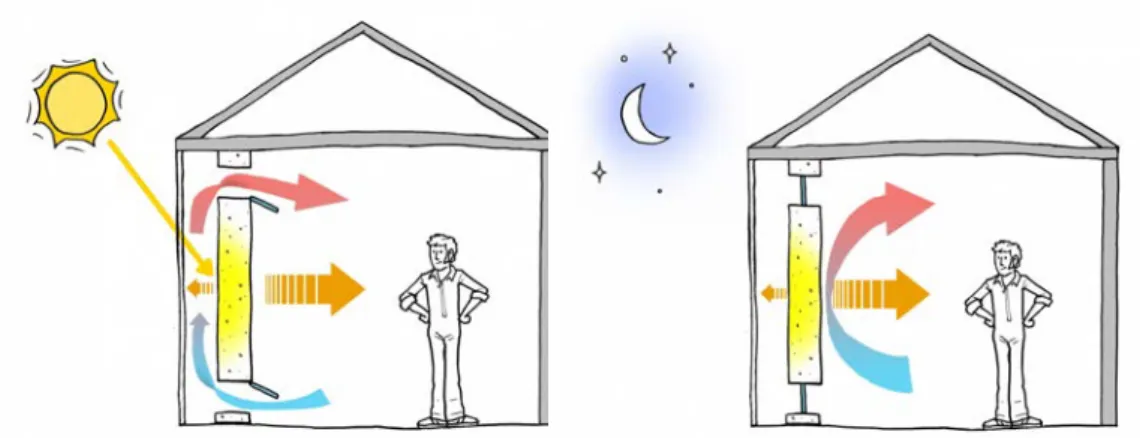
passive system applications is Trombe wall (Figure 1.13). It consists in a south-oriented masonry wall with a transparent glazing in front. The air can flow through between the masonry wall and glazing thanks to the nat-ural convection. The glazing let the solar radiation pass trough and be finally absorbed by the masonry wall (except for the reflection) during the
![Figure 1.3 – The general classification of PCMs and the favourable chemical properties are [10]:](https://thumb-eu.123doks.com/thumbv2/123doknet/14501105.719236/36.892.181.592.136.441/figure-general-classification-pcms-favourable-chemical-properties.webp)
![Figure 1.4 – Typical DSC measurement output curves [11]](https://thumb-eu.123doks.com/thumbv2/123doknet/14501105.719236/39.892.318.693.132.388/figure-typical-dsc-measurement-output-curves.webp)
![Figure 1.7 – The heat capacities of some building materials before and after the incorporation of PCMs [17]](https://thumb-eu.123doks.com/thumbv2/123doknet/14501105.719236/42.892.190.567.184.901/figure-heat-capacities-building-materials-incorporation-pcms.webp)
![Figure 1.8 – SEM image of PCM micro-capsules in gypsum plaster [19]](https://thumb-eu.123doks.com/thumbv2/123doknet/14501105.719236/43.892.340.672.132.383/figure-sem-image-pcm-micro-capsules-gypsum-plaster.webp)
![Figure 1.12 – Installation of ceiling panels in building interior as suspended ceiling [36].](https://thumb-eu.123doks.com/thumbv2/123doknet/14501105.719236/47.892.394.616.132.379/figure-installation-ceiling-panels-building-interior-suspended-ceiling.webp)
![Figure 1.14 – Crystallisation process of S27 (upper part of the window). The material solidifies in the shape of crystal needles which keep growing until they draw through the whole container (picture sequence up to down) [31].](https://thumb-eu.123doks.com/thumbv2/123doknet/14501105.719236/50.892.123.654.130.486/figure-crystallisation-process-material-solidifies-crystal-container-sequence.webp)
![Figure 2.2 – Polar distribution of the scattered light intensity of different particles sizes [92]](https://thumb-eu.123doks.com/thumbv2/123doknet/14501105.719236/72.892.125.658.130.452/figure-polar-distribution-scattered-light-intensity-different-particles.webp)