HAL Id: tel-02926158
https://tel.archives-ouvertes.fr/tel-02926158
Submitted on 31 Aug 2020HAL is a multi-disciplinary open access
archive for the deposit and dissemination of sci-entific research documents, whether they are pub-lished or not. The documents may come from teaching and research institutions in France or abroad, or from public or private research centers.
L’archive ouverte pluridisciplinaire HAL, est destinée au dépôt et à la diffusion de documents scientifiques de niveau recherche, publiés ou non, émanant des établissements d’enseignement et de recherche français ou étrangers, des laboratoires publics ou privés.
fundamental and quantitative aspects
Oliver Harper
To cite this version:
Oliver Harper. VUV photoionisation of astrophysical molecules : fundamental and quantitative as-pects. Chemical Physics [physics.chem-ph]. Université Paris-Saclay, 2020. English. �NNT : 2020UP-ASS102�. �tel-02926158�
Thè
se de
doctorat
NNT : 2020UP ASS102VUV photoionisation of
astrophysical molecules:
fundamental and quantitative
aspects
Thèse de doctorat de l’Université Paris-SaclayÉcole Doctorale n◦ 572, Ondes et Matière (EDOM) Spécialité de doctorat : Physique
Unité de recherche : Institut des Sciences Moléculaires d’Orsay (ISMO), Université Paris-Saclay, CNRS, Institut des Sciences Moléculaires d’Orsay, 91405, Orsay, France Référent : Faculté des sciences d’Orsay
Thèse présentée et soutenue à Orsay, le 03/07/2020, par
Oliver J. HARPER
Composition du jury :
Laurent Nahon Président du jury Directeur de recherche assimilé, Synchrotron SOLEIL
(St-Aubin)
Amanda Ross Rapportrice Directrice de recherche, Institut Lumière Matière (Lyon)
Ian Sims Rapporteur Professeur des Universités, Institut de Physique de
Rennes (Rennes)
Christian Alcaraz Examinateur Directeur de recherche, Institut de Chimie Physique
(Or-say)
Astrid Bergeat Examinatrice Maître de conférences, Institut des Sciences Moléculaires
(Bordeaux)
Séverine Boyé-Péronne Directrice de thèse Professeure des Universités, Institut des Sciences
Moléculaires d’Orsay (Orsay)
Bérenger Gans Co-encadrant Chargé de recherche, Institut des Sciences Moléculaires
i
Résumé
L’évolution de la matière diluée dans les milieux astrophysiques tels que le milieu inter-stellaire, les atmosphères planétaires ou la coma des comètes, résulte d’une photochimie très complexe faisant intervenir en particulier un grand nombre d’espèces stables et réactives en phase gazeuse. Cette photochimie est induite par le rayonnement galactique ou par le rayon-nement solaire dans le domaine spectral de l’ultra-violet du vide (VUV, longueur d’onde < 200 nm). Une bonne compréhension de cette évolution nécessite une modélisation précise de la photochimie de ces milieux, en prenant en compte l’ensemble des réactions chimiques et des processus photo-induits. Dans ce contexte, le travail principal de cette thèse porte sur le pro-cessus de photoionisation (M + hν→M++ e−).
Un des buts de cette thèse était de déterminer des paramètres quantitatifs, souvent jamais mesurés, pour décrire le processus de photoionisation de composés d’intérêt astrophysique, en particulier d’espèces réactives. Pour ce faire, le montage moyenne – haute résolution (SAPHIRS) de la ligne DESIRS du synchrotron SOLEIL et le nouveau montage laser VUV haute résolution (VULCAIM) de l’ISMO basé sur un spectromètre de photoélectrons à énergie cinétique nulle (ZEKE) ont été utilisés pour mener diverses études expérimentales. Cette thèse présente aussi le développement de cette nouvelle expérience, unique en France, et la caractérisation de ses principales performances. Les deux expériences employées dans cette thèse sont comparées et leur complémentarité est soulignée.
Un paramètre quantitatif important est la section efficace de photoionisation, reliant le nom-bre d’ions produits au nomnom-bre initial d’espèces neutres. Pour les espèces réactives, ce paramètre est rarement connu à cause des difficultés inhérentes à ce type de mesure. Ce travail présente deux mesures de sections efficaces de photoionisation (pour les radicaux NH2et OH). D’autres résultats préliminaires sur des sections efficaces de radicaux dérivés du méthanol sont égale-ment présentés et discutés. D’un point de vue pratique et en plus de leur intérêt astrophysique, ces sections efficaces permettent indirectement de quantifier la présence d’espèces neutres. Dans le cadre de cette thèse, cela a été utile lors de l’étude d’autres processus de relaxation (i.e. la photodissociation d’espèces neutres et stables) à travers des expériences pompe VUV – sonde VUV, qui sont aussi décrites dans le manuscrit.
En plus de l’importance de ces expériences pour les applications, ces études permettent d’obtenir des informations fondamentales et détaillées sur le processus de photoionisation, surtout via la spectroscopie de photoélectrons. Au synchrotron SOLEIL, les structures vibro-niques de différentes molécules astrophysiques (C2 et CH3NCO) ont été étudiées au voisi-nage de leurs premiers potentiels d’ionisation adiabatiques. Au laboratoire, le nouveau laser VUV s’est montré très performant pour des expériences de spectroscopie VUV à des résolu-tions rarement atteintes dans ce domaine spectral (jusqu’à 0.06 cm−1). Ce nouveau montage a été validée par spectroscopie PFI-ZEKE en étudiant la transition CO+2 X+ 2Πg ←CO2 X1Σ+g. L’état électronique fondamental du cation est particulièrement intéressant d’un point de vue spectroscopique puisqu’il présente des couplages spin-orbite et Renner-Teller et également une résonance de Fermi. Les structures rotationnelles d’un grand nombre de niveaux vibroniques de cet état ont été étudiées et comprises grâce à des simulations qui s’appuyent sur des hamil-toniens effectifs. En plus de ce travail spectroscopique, l’utilisation de ce laser VUV pour la spectroscopie de photoélectron couplée à une technique d’analyse d’images révèle la possibil-ité d’entreprendre des études de photoionisation à haute résolution avec un meilleur rapport signal sur bruit par rapport aux méthodes traditionnelles, ce qui permettra la détermination de nouvelles informations spectroscopiques concernant la structure rovibronique d’un grand nombre de cations, et en particulier d’espèces radicalaires.
iii
Acknowledgements
The majority of the work undertaken during this PhD was at the Institut des Sciences Molécu-laires d’Orsay. I would therefore like to start by thanking the successive directors Bernard
BOURGUIGNONand Thomas PINO for hosting me at the institute.
I would also like to thank the two referees Amanda ROSS and Ian SIMS for accepting to scrutinise this manuscript along with Astrid BERGEAT, Christian ALCARAZ, and Laurent
NAHON who accepted to form my PhD jury. I am all the more grateful given the circum-stances in which this PhD ended, with the Covid 19 pandemic, which made all of our lives more difficult. I also thank Christian ALCARAZ for his lending of the ZEKE spectrometer.
I cannot put into words how grateful I am for the unwavering support of my supervisors
Séverine BOYE-PERONNEand Bérenger GANS. As I look back over the last three years, I am surprised at how much I have learnt and how much I have grown as both a scientist and a human being. Your availability and trust were invaluable throughout. You had big parts to play in this adventure and I cannot thank you enough. Even during the lockdown, you were always at my side... at least electronically speaking.
Séverine, je te remercie pour les gâteaux, les conseils, les questions, les réponses, les discus-sions sur l’enseignement et sur la physique moléculaire ou encore l’optique. Ton recul sur la science associé à ta gentillesse m’ont toujours permis de tirer quelque chose de nos discussions.
Bérenger, coach sportif, expérimentateur / bricoleur hors-pair, expert en spectroscopie et R, je te remercie pour ta patience et ta pédagogie qui m’ont accompagnées en salle de manip et au-delà ! J’ai appris énormément de choses à maniper à côté de toi et à discuter de tout à tout moment avec toi.
I would like to thank all the people who assisted us during the synchrotron SOLEIL cam-paigns and in particular the DESIRS beamline scientists Gustavo GARCIA and Nelson de
OLIVEIRAwho were always available to help and answer any queries, both on and off the beamline. During these campaigns, I enjoyed fruitful exchanges with exterior collaborators. I thank Jean-Claude GUILLEMIN for synthesising molecular samples of study: CH3NC and CH3NCO. I thank Jean-Christophe LOISON for his passion and enthusiasm concerning flow tube reactions and his theoretical background concerning the observed phenomena. Likewise, I thank Stephen PRATT for the interesting discussions on free radical photoionisation cross sections and his theoretical view point.
During my time at ISMO, I also appreciated conversations I had with members of the SYS-TEMAE team. I thank Stéphane DOUIN for his interest and encouragement in my work and experimental top-tips, Karine BEROFF for the discussions on breakdown curves, and Laurent
COUDERTfor his seemingly bottomless well of theoretical knowledge, that helped us under-stand a great deal about CH3NCO, and his LATEX know-how. On top of this, I am very grateful to the whole team for the good atmosphere, which meant I was always happy to come to the lab, and which made the whole experience even more beneficial. Outside the team, I thank
Michel BROQUIERand Satchin SOORKIA for their always-useful input, support and multi-ple lendings of equipment.
This brings me to the PhD students of ISMO who, on the whole, do not have the best singing voices or the most honed skills at escaping rooms, but whose infallible and friendly support were precious on a daily basis. En particulier je remercie la dreamteam avec qui j’ai eu l’honneur de partager un bureau et dont la folie m’a permis de rester sain !
A l’ISMO, j’ai bénéficié d’un excellent soutien de la part des équipes techniques. Neuf fois sur dix, je pense que vous avez pu m’aider le jour-même. Purement pour raisons de fréquence de visite, je voudrais remercier tout particulièrement Christophe CHARRIERE, Thierry
CHAMAILLE, Sébastien DEBEST, Catherine LEBRIS, Christophe LEFUMEUX, Julien
VIN-CENTet tout l’atelier de mécanique et l’administration mais j’en oublie très certaintement. Last but not least, I would like to thank my family, especially my parents who have selflessly always put me first in every undertaking. Je voudrais remercier mes amis qui me soutiennent dans tous mes projets d’année en année. Eloi, binôme de confiance, compère de brasserie, com-pagnon de voyage, musicien talentueux et grand physicien, un grand et tendre merci d’avoir toujours été là.
v
Contents
Résumé i Acknowledgements iii Introduction 1 1 Experimental tools 7 1.1 Synchrotron SOLEIL . . . 71.1.1 The SOLEIL synchrotron facility . . . 7
1.1.2 The DESIRS beamline . . . 8
1.1.3 SAPHIRS . . . 9
The DELICIOUS 3 spectrometer . . . 10
Molecular samples . . . 15
1.2 VUV laser setup . . . 17
1.2.1 VUV laser production . . . 18
1.2.2 Implementation of VUV laser production . . . 19
1.2.3 High resolution tunable UV laser chain . . . 21
1.2.4 High resolution dye laser . . . 25
1.2.5 VUV spectral range . . . 26
1.2.6 VUV photon flux monitoring . . . 27
1.2.7 Vacuum experimental setup . . . 28
Gas-phase sample and molecular beam generation . . . 28
Time Of Flight mass spectrometer . . . 29
Temporal synchronisation of the setup . . . 30
1.2.8 First VUV laser experiment with Icare on N2 . . . 31
1.2.9 From Icare to VULCAIM . . . 32
Theoretical reminders on Rydberg states . . . 32
Probing Rydberg states using Pulsed-Field-Ionisation spectroscopy . . . . 34
Probing rare gas Rydberg states using Pulsed-Field-Ionisation (PFI) spec-troscopy with Icare . . . 35
The birth of VULCAIM . . . 36
Probing rare gas Rydberg states using Pulsed-Field-Ionisation (PFI) spec-troscopy with VULCAIM . . . 38
Detecting electrons using VULCAIM . . . 41
1.3 Complementary VUV light sources on the Saclay Plateau . . . 42
2 Ion yields and absolute photoionisation cross section measurements 43 Motivations . . . 43
2.1 Absolute photoionisation cross section determination: general method . . . 46
2.1.2 Uncertainty determination . . . 47
2.1.3 Ion yields . . . 49
2.1.4 Choosing the photon energy for the absolute measurement . . . 49
2.1.5 Specificities to our experimental setup . . . 50
2.2 The absolute photoionisation cross section of the hydroxyl (OH) free radical . . . 52
2.2.1 The OH free radical: current state-of-the-art . . . 52
2.2.2 The OH+photoion yield . . . 53
2.2.3 The fixed energy measurement of the OH photoionisation cross section . 53 2.2.4 The OH photoionisation cross section from threshold up to 15 eV. . . 55
2.2.5 A follow-up study . . . 57
2.3 The absolute photoionisation cross section of the amino (NH2) free radical . . . . 60
2.3.1 The NH2free radical: current state-of-the-art . . . 60
2.3.2 The NH+2 ion yields . . . 60
2.3.3 Fixed energy absolute measurements . . . 62
2.3.4 NH2photoionisation cross section determination . . . 64
2.4 Preliminary study on the carbonated fragments of methanol . . . 68
2.4.1 Context and motivation . . . 68
2.4.2 Specific experimental details . . . 69
2.4.3 Ion yields . . . 70
Precursor ion yields (CH3OH+) . . . 70
Single H-abstraction product ion yields . . . 71
Double H-abstraction product ion yields . . . 73
Triple H-abstraction product ion yields . . . 74
Methanol isotopologue summary . . . 75
2.5 Photoionisation cross section and ion yield conclusions . . . 75
3 Photoelectron spectroscopy, from medium to high resolution 79 3.1 Photoelectron spectroscopy with synchrotron radiation . . . 80
3.1.1 Threshold photoelectron spectroscopy of CH3NCO . . . 80
Astrophysical context . . . 80
Spectroscopic context . . . 80
Specific experimental details . . . 81
Theoretical model . . . 82
Results and discussion . . . 82
Conclusion . . . 84
3.1.2 First single-photon ionisation study of C2 . . . 85
Astrophysical context . . . 85
Spectroscopic context . . . 85
Specific experimental details . . . 85
Ab initio calculations . . . 87
Assignment of the Threshold-Photoelectron spectrum of C2 . . . 88
Ion yield . . . 92
Conclusion on the C2study . . . 93
3.2 High-resolution photoelectron spectroscopy . . . 94
3.2.1 Pulsed Field Ionisation - ZEro Kinetic Energy (PFI-ZEKE) spectroscopy . 94 Introduction . . . 94
Ionisation rates of Rydberg states . . . 95
vii
3.2.2 CO2PFI-ZEKE spectroscopy . . . 97
Motivations . . . 97
Overview of the X+2ΠgCO+2 ground state . . . 98
Spin-orbit components of X+2Πg(v1=0, v2=0, v3=0) . . . 100
Rotational energy levels of a linear triatomic molecule in a2Π electronic state - simulations . . . 102
Stark-shift corrections . . . 103
The CO+2 X+2Π3/2 vibronic state . . . 104
The CO+2 X+2Π1/2 vibronic state . . . 106
Vibronic states of the(v1 =0, v2 =1, v3 =0)band. . . 107
Vibronic states of the(v1= 0, v2 =2, v3= 0)and(v1= 1, v2 =0, v3 =0) bands. . . 109 CO2photoionisation summary . . . 111 3.2.3 Pulsed-Ramped-Field-Ionisation ZEro-Kinetic-Energy . . . 111 Technique description . . . 111 Image treatment . . . 112 Discussion . . . 113
Conclusions & perspectives 116 A Exploratory studies of the photodissociation process 121 A.1 Experimental setup . . . 122
A.1.1 General principle of the measurement: pump-probe scheme . . . 122
A.1.2 Modified Icare setup . . . 123
A.1.3 VUV production via four-wave mixing in a rare gas cell . . . 123
A.2 NH3photodissociation at 213 nm . . . 125
A.2.1 Context and motivations . . . 125
Astrophysical interest . . . 125
NH3photodissociation, state-of-the-art . . . 125
Choice of photodissociation photon energy . . . 126
A.2.2 Experimental specificities . . . 128
A.2.3 Results . . . 128
A.2.4 Conclusions and perspectives . . . 131
Towards free radical photoionisation cross section measurements . . . 131
Summary . . . 132
A.3 CH3OH photodissociation studies . . . 132
A.3.1 Context and motivations . . . 132
Astrophysical interest . . . 132
CH3OH photodissociation, state-of-the-art . . . 132
Choice of photodissociation photon energy . . . 134
A.3.2 Experimental specificities . . . 134
A.3.3 CH4photodissociation . . . 136
A.3.4 CH3OH photodissociation at 118.2 nm: results . . . 137
B Dissociative ionisation of CH3NCO 141 B.1 Experimental details . . . 141 B.2 Context . . . 141 B.3 Ion yields and assignments of the products of CH3NCO dissociative ionisation . 142 B.4 TPES of dissociative states . . . 146 B.5 CH3NCO dissociative ionisation summary . . . 147
C List of publications as co-author 149
ix
List of Figures
1 Main relaxation pathways for the amino free radical (NH2) after absorbing a VUV photon. . . 1 1.1 Schematic layout of the Synchrotron SOLEIL [19] along with its various
compo-nents. . . 8 1.2 Left: layout of the DESIRS beamline displaying its various components and branches,
adapted from ref. [19]. Right: simplified layout of the DESIRS beamline as seen from above; . . . 8 1.3 Left: photo of the SAPHIRS molecular beam chamber. Right: Technical layout of
the SAPHIRS molecular beam chamber containing the flow-tube reactor and the DELICIOUS 3 spectrometer adapted from ref. [23] . . . 10 1.4 Illustration of the DELICIOUS 3 spectrometer. Added are example images of
electrons (bottom) and ions (top). . . 10 1.5 Example of ion image treatment. a) Ion image on detector with red rectangle
showing region of interest with ions originating from the molecular beam. b) Raw mass spectrum constructed using all ions in ion image a). c) Same mass spectrum with ion contributions reduced to region of interest in ion image c). . . 11 1.6 Example of electron image treatment for N2photoionisation adapted from ref. [25].
a) Mass-selected (from N2) raw electron image on detector for a photon energy of 19.5 eV and a repeller voltage set to 750 V. b) Inverted electron image. c) Cor-responding mass-selected PES with blue arrows linking spectral features to areas in the image b). . . 11 1.7 Photo-Ion Yield and Threshold Photoelectrom Spectrum principle demonstrated
on R + hν→R++ e−reaction. If the photon energy hν is equal or greater than the energy of the cationic vibronic state, photoelectrons can be issued from that state along with photo-ions. As hν increases, higher energy cationic states are reached producing yet more electrons and ions. This access to states manifests itself by the appearance of steps in the photo-ion yield. Photoelectrons whose kinetic energies are vanishing are recorded in the Threshold Photoelectron Spectrum for photon energies close to those of cationic states. . . 12 1.8 a) Raw PES matrix of CH3NCO between 10.4 and 12 eV with a 300 V repeller
voltage. b) Rotated PES matrix to make diagonal lines vertical. c) Zoom on non-rotated PES matrix to visualise slow electrons. d) Zoom on non-rotated PES matrix to visualise slow electrons. e) TPES: Integration of electron counts in non-rotated PES matrix for electrons slower than 0.01 eV represented by a thin dashed box in c) andR symbol. f) SPES: Integration of electron counts in rotated PES matrix for electrons slower than 0.01 eV represented by a thin dashed box in d) andR symbol. Comparing e) and f), using the same electrons, the rotation in the SPES treatment offers the better compromise between signal-to-noise and resolution compared to TPES. . . 14
1.9 Photo-Ion Yield and Threshold PhotoElectron Spectroscopy principle demon-strated on R + hν → R+ + e− as in Fig. 1.7, but with autoionisation. R* and R** are neutral states situated above the first IP and are respectively resonant and non-resonant with cationic states. Autoionisation leads to resonances in the ion yield and enhances peaks in the TPES if resonant. . . 15 1.10 Schematic of the flowtube reactor where H-abstraction of CH4 by F atoms
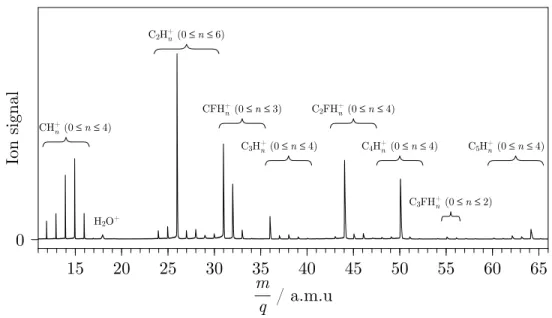
pro-duces CH3, CH2, etc. The injector distance is noted d; d can be tuned to adjust conditions within the reactor. . . 16 1.11 Typical mass spectrum obtained by summing all mass spectra recorded between
12.4 and 13.6 eV when using CH4as a precursor during the experiments on C2 (see section 3.1.2). . . 17 1.12 Rough general layout of the laboratory-based high-resolution VUV laser setup at
ISMO. . . 18 1.13 Four-wave mixing resonant scheme combining UV and visible radiation in rare
gas. Dashed lines represent virtual states in the rare gas; full lines represent actual states in the rare gas that are exploited as resonances. . . 18 1.14 Implementation of four-wave mixing scheme in a freely expanded rare gas used
to generated tunable VUV radiation. Reflective VUV grating selects the intended wavelength for the study to pass through the 1 to 2 mm in diameter iris. Only 0th and 1storder components from the grating are presented. . . . 20 1.15 Top: Photo of the high-resolution UV laser chain at ISMO. Bottom: Illustration of
the high-resolution UV laser chain at ISMO with main characteristics. . . 21 1.16 Optical layout of the Sirah Matisse ring dye-laser from ref. [32] . . . 22 1.17 Optical layout of the Sirah Pulsed Amplifier from ref. [32] . . . 23 1.18 Schematic spectra of overlap between UV laser bandwidth and two-photon
tran-sition width in a rare gas. a) Spectrum displaying a narrow UV laser bandwidth with all spectral components within the rare-gas transition that all contribute in VUV production (∆νUV <∆νRG). b) Spectrum displaying a wide UV laser band-width with spectral components outside the rare-gas transition (∆νUV >∆νRG). As more laser spectral components in the a) spectrum overlap with the rare gas transition as compared to the b) spectrum, VUV production will have a higher efficiency in a). . . 24 1.19 Normalised VUV intensity as a function of UV wavenumber. Lorentzian curves
fit the data sets whose average UV laser energy are 0.06 mJ/pulse (green line) and 1 mJ/pulse (red line). . . 24 1.20 Top: Photo of the Cobra-Stretch double grating dye-laser pumped by a
Spectra-Physics Quanta Ray Nd:YAG laser. Bottom: Optical layout of the Sirah Cobra Stretch double grating dye-laser from ref. [32] . . . 25 1.21 I2laser-induced-fluorescence spectrum resulting from the excitation of I2 with a
Cobra Stretch dye laser (black) compared to FT absorption spectrum (blue) from ref. [35] . . . 26 1.22 VUV laser spectral range for each rare gas resonance (same notations as Tables
1.4 and 1.7). Green (blue) zones represent spectral regions using νvisproduced by the Cobra-Stretch pumped at 532 nm (355 nm). . . 27 1.23 Schematic drawing of a gas expanding through a nozzle followed by a skimmer
which selects the innermost part of the jet. A reduction of the velocity distribu-tion (black arrows) leads to lower transladistribu-tional temperatures after the skimmer. . 29 1.24 Temporal synchronisation of the various elements of the experimental setup. . . 30
xi
1.25 Left: Two-photon, two-colour ionisation scheme to probe at rotational resolution the c’4 1Σ+u (v = 3) state of N2. Right: Rotationally resolved spectra of the c’4 1Σ+
u (v = 3) ← X 1Σ+g transition in N2 with a 1 mm (top) and 2 mm (bottom) in diameter skimmers. These experimental spectra (black) are simulated using PGOPHER software (blue). . . 31 1.26 Simplified 2D schemes of an electron (green dot) in a potential well (V)
repre-senting the bound nature of an electron within the atom. a) Arrival of a VUV laser pulse to excite the atom and promote an electron to a highly excited Ryd-berg state. b) The laser pulse has passed, the RydRyd-berg atom has been formed. c) PFI: Application of electric field F which deforms the potential well allowing the electron to escape. . . 34 1.27 Icare PFI spectra of Rydberg series of Ar (top) and Kr (bottom) converging to
their first IPs, the ground states of their respective ions (noted in pink). Rydberg states are resolved and visible for up to n≈55 in both Ar and Kr. . . 36 1.28 Degeneracy lifting of n = 40 Rydberg state with electric field F. Observation of
blue and red shifted states. Black arrow at F≈1.5 V.cm−1represents the 0.3 cm−1 experimental resolution . . . 37 1.29 Top left: Photo of the VULCAIM setup with the various laser sources in the
back-ground. Top right: Close-up photo of the VULCAIM vacuum chambers. Bottom: Schematic layout within VULCAIM. . . 38 1.30 VULCAIM PFI spectra of Rydberg series of Ar (top) and Kr (bottom)
converg-ing to their first IPs, the ground states of their respective ions (noted in pink). Rydberg states are resolved and visible for up to n≈80 in Ar and n≈130 in Kr. 39 1.31 Comparative PFI spectra of Rydberg series of84Kr (top) and40Ar (bottom) recorded
using Icare (blue) and VULCAIM (black). In the case of the Icare experiment, higher extraction fields were used which explains why Rydberg states of lower n are observed. . . 40 1.32 Maximum resolution measurement of photon resolution of VULCAIM using the
39d[3/2](J=1) Rydberg state in82Kr. A red dashed gaussian line whose FWHM=0.06 cm−1 is superimposed on the experimental spectrum. . . 41 1.33 Simulated degeneracy lifting of a n= 40 Rydberg state with electric field F.
Ob-servation of blue and red shifted states. Black arrow at F≈0.2 V.cm−1represents the upper limit for parasitic electric fields in the experiment. . . 41 2.1 Illustration of mass spectra recorded in two experimental conditions. a) Only the
precursor P is present in situation 1. b) Free radical species R are produced from the precursor in situation 2. c) The lowest spectrum is the difference spectrum b) - a). . . 46 2.2 Block diagram of the Monte Carlo uncertainty propagation procedure generating
the R photoionisation cross section distribution, whose mean value is taken as the final cross section value and two standard (2σ) deviations constitute the error bars 48 2.3 Effect of experimental resolution on measured resonance (schematic illustration).
A simulated pair of resonances (black line) corresponding to the energy differ-ence between energy states is measured using apparatus whose resolution is 0.5 (green), 2 (blue) and 5 (red) times the natural width of the resonance. . . 50 2.4 Typical astrophysical water regeneration cycle featuring the photoionisation of
2.5 OH+ion yields from Cutler et al. (top) [73], Dehmer (middle) [72] and this work (bottom) taken from ref. [46,47]. . . 53 2.6 Mass spectra recorded at 13.800 eV with the F-atom-producing discharge off (top)
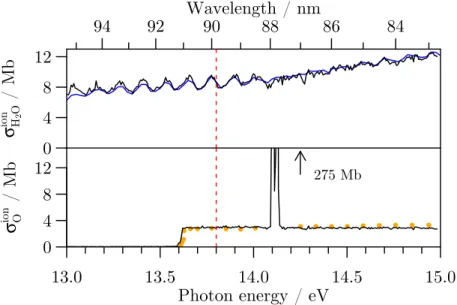
and on (middle) and the difference spectrum (bottom). The same arbitrary unit is used in all spectra. . . 55 2.7 Measured H2O+(top) and O+(bottom) set to an absolute photoionisation cross
section scale respectively using data from Fillion et al. (blue line) [81] and Angel and Samson (orange dots) [82] . Note the vertical scale of the lower panel is cut truncating the atomic oxygen resonances around 14.1 eV. The red dashed vertical line marks the photon energy (13.800 eV) of the absolute measurements of this work. . . 56 2.8 Absolute photoionisation cross section of OH from this work [46,47] (black curve)
as a function of photon energy; the blue area represents the error bars presented with a 2σ confidence level. They take into account both the error bar on the cross section value, and the uncertainty on the photon energy value (absolute mea-surement as well as scaling of the photoion yield). The red cross at 13.800 eV constitutes the absolute fixed energy measurement and associated uncertainty. The green points represent the absolute measurements from Dodson et al. [45] performed at 13.346 and 14.193 eV. . . 56 2.9 Mass spectra recorded at 14.505 eV (left-hand panels) and 13.250 eV (right-hand
panels) with the F-atom-producing discharge off (top) and on (middle) and the difference spectrum (bottom). For each energy, the same arbitrary unit is used in three corresponding panels. . . 58 2.10 Absolute photoionisation cross section of OH from this work (black curve) as a
function of photon energy from ref. [46,47]; the blue area represents the error bars presented with a 2σ confidence level. The red cross at 13.800 eV constitutes the absolute fixed energy measurement and associated uncertainties on both x- and y-values from ref. [46,47]. The green points represent the absolute measurements from Dodson et al. [45]. Red triangles represent cross section values determined in this follow-up study at 13.250 and 14.505 eV. . . 59 2.11 a) NH+2 ion yield from Gibson et al. [90]. b) Ion yield measured during this PhD
for m/q = 16 a.m.u. attributed mainly to NH2+. Sharp and imposing resonances at 14.1 eV are attributed to atomic oxygen autoionisation resonances. Purple as-terisks mark Ar absorption lines from the beamline gas filter used to calibrate the photon energy. Both panels feature dot-dashed blue lines pinpointing the three lowest electronic states of NH+2 [92]. Panel b) contains dashed red verti-cal lines pinpointing the energies of the absolute measurements at 12.700, 13.200, and 14.000 eV. . . 61 2.12 Left-hand panels a) to c): mass spectra recorded at 13.200 eV in NH2study.
Spec-tra recorded with F-atom-producing discharge off (panel a)), on (panel b)) and difference spectrum (panel c)). Right-hand panels d) to f): mass spectra recorded at 17.500 eV in NH2study without injecting any NH3. Spectra recorded with F-atom-producing discharge off (panel d)), on (panel e)) and difference spectrum (panel f)). Mass peaks are assigned to various ionic fragments as indicated in the middle panel. The bottom panel shows which species are consumed (negative peaks) and which are formed by switching the F producing discharge on. . . 62
xiii
2.13 Top: ion yield of m/q=30 a.m.u. of our study (black line) compared to the NO+ ion yield of Watanabe et al. [44] (green line). Bottom: ion yield of m/q=32 a.m.u. of our study (black line) compared to the O+2 ion yield of Holland et al. [84] (green line) . . . 63 2.14 NH2photoionisation cross section as a function of photon energy. Panels a) and
b) display our ion yield and the ion yield of Gibson et al. [90]), respectively, set to an absolute scale using our fixed-energy values at 12.700 and 13.200 eV, noted in red along with their respective error bars (see Table 2.6). An orange cross marks a fixed-energy cross section value at 14.000 eV, corrected for O+ contributions, but not used in the scaling of the ion yield. The blue area denotes error bars ex-tended over the whole range. A grey area in the top panel around 14.1 eV masks the O+ resonance that could not be corrected, cross section values could not be determined in this narrow area. Drops in the spectrum due to gas filter absorp-tion lines also constitute points where cross secabsorp-tion values cannot be determined (purple asterisks). . . 66 2.15 NH2photoionisation cross section as a function of photon energy. All values and
notations are the same as in Fig. 2.14 a) with in addition a green line representing NH2cross section values from the Leiden database [8]. . . 67 2.16 Typical mass spectrum obtained by summing all mass spectra recorded between
7.4 and 11.4 eV when using CD3OH as a precursor. . . 69 2.17 Typical mass spectrum at 11.4 eV when using CD3OH as a precursor and the
microwave discharge turned off. . . 71 2.18 Ion yields resulting from the direct ionisation of CH3OH (black line) and CD3OH
(red line). A TPES of CH3OH is also presented in grey. A purple dashed line at 10.846 eV locates the IP(CH3OH) [105]. . . 71 2.19 Single H-abstraction product ion yields. a) The m/q = 33 a.m.u. ion yield from
the CD3OH study assigned to CD2OH+ with a dashed vertical line at 7.55 eV locating the IP of CH2OH [106]. b) The m/q = 34 a.m.u. ion yield from the CD3OH study assigned to CD3O+with a dashed vertical line at 10.72 eV locating the IP of CH3O [106]. c) The m/q = 31 a.m.u. ion yield (black line) from the CH3OH study is compared to a linear combination (red dashed line) of panels a) and b) with a 60/40 ratio. The same y-axis arbitrary unit is used in all panels. Purple asterisks locate Kr absorption lines caused by the beamline gas filter used to calibrate the photon energy for all non-deuterated scans of this section. . . 72 2.20 Double H-abstraction product ion yields. a) The m/q=32 a.m.u. ion yield from
the CD3OH study assigned to CD2O+. b) The m/q=31 a.m.u. ion yield from the CD3OH study assigned to CDOH+. c) The m/q=30 a.m.u. ion yield (black line) from the CH3OH study is compared to a linear combination (red dashed line) of panels a) and b) with a 95/5 ratio. This panel also features a H2CO+ ion yield from Dodson el al. [50] in green. Vertical purple dashed lines at 8.86 and 10.72 eV locate the ionisation potentials of CHOH [108] and CH2O [107], respectively. The same y-axis arbitrary unit is used in all panels. . . 73 2.21 Triple H-abstraction product ion yields. The m/q = 29 a.m.u. ion yield (black
line) from the CH3OH study is compared to the m/q = 30 a.m.u. ion yield (red line) from the CD3OH study. A vertical purple dashed line at 8.14 eV locates the IP(HCO) [109]. . . 74
2.22 Schematic representation of a photoionisation cross section as a function of in-cident photon energy. The plateau value is reached at photon energies above vibrational levels of the cationic electronic ground state with non-vanishing FCF, but below the first excited state. . . 76 3.1 Scheme illustrating the difference between vertical and adiabatic IPs (pink
ar-rows). Projections of the neutral (X) and cationic (X+) potential energy surfaces along an internal coordinate are drawn along with vibrational energy levels. The internal coordinate can be a bond length, an angle, or a function of several geo-metric parameters. . . 79 3.2 Sketch of the CH3NCO molecule (geometry adopted in the neutral ground
elec-tronic state ˜X1A’). White, grey, blue, and red spheres represent hydrogen, carbon, nitrogen, and oxygen atoms, respectively. The coordinates of the two large am-plitude motions are marked (angles τ and ρ). . . . 81 3.3 Experimental TPES (black) of CH3NCO with the peak labelling referring to
Ta-ble 3.3 compared to a calculated spectrum (blue) using a vibrational temperature of 300 K. The ab initio calculated spectrum is shifted -0.133 eV to fit the exper-imental spectrum. Assignments in the calculated spectrum refer to vibrational bands of the ˜X+2A”←X˜ 1A’ photoionising transition. The labels correspond to vibrational mode numbers (see Table 3.3) followed by cationic (superscript) and neutral (subscript) vibrational quantum numbers. . . 83 3.4 Typical mass spectrum obtained by summing all mass spectra recorded between
12.4 and 13.6 eV using CH4as a precursor. . . 86 3.5 Experimental TPES (red line) and PIY (black) of C2. Purple asterisks locate Ar
absorption lines visible in the PIY and used to calibrate the energy scale of the spectrum. . . 87 3.6 Theoretical potential energy curves of C2and C2+from ref. [147] . . . 88 3.7 Experimental TPE spectrum of C2(upper panel) compared to FCF simulations of
vibronic transitions (other panels) from ref. [147]. The same colour code as in Fig. 3.6 is used for the final state of the transition. Full line spectra correspond to transitions from the neutral metastable a 3Πu state and those with dashed lines correspond to transitions from the neutral ground state X1Σ+g. Black stick spec-tra in the simulated specspec-tra correspond to FCF, the resulting specspec-tra result from convoluting the FCF by a gaussian function whose FW HM = 25 meV. . . 90 3.8 Experimental TPE spectrum of C2 (upper black trace) compared to a simulated
spectrum (lower red trace) which combines the simulated a+2Πu ← X1Σ+g, X+4Σ−
g ← a3Πu, and a+2Πu ← a3Πuvibronic transitions from ref. [147]. The red stick spectrum represents FCF values and the red trace, their convolution by a gaussian function whose FW HM is 25 meV. . . 91 3.9 C+2 ion yield adapted from ref. [147]. The vertical lines mark the transition
en-ergies (EI,calc.corr.ZPE) from the a3Πu state (full line) or X1Σ+g state (dashed line). Triangles locate the position of autoionising features. The grey area represents the statistical error on the C+2 ion signal. A purple line represents the integrated experimental TPES. . . 92
xv
3.10 Illustration of PFI-ZEKE scheme. Left: Rydberg states, reached using a VUV photon (pink), converging to IP. Right: voltage scheme applied to electrons in interaction zone after laser excitation; an electron signal on the MCP is detected for each voltage step after a time-of-flight. Each section of Rydberg states (colour code) is ionised at each successive voltage step (same colour code). . . 94 3.11 Simulated degeneracy lifting of a n = 180 (m = 0) Rydberg state with electric
field F, only states with n2a multiple of 10 are represented for clarity (except for n2 =179) adapted from ref. [18]. Black dots locate field thresholds for which the ionisation rate is high enough for detection. States represented by light pink lines are ionised under a 65 V.m−1field. States represented by green lines are ionised under a -65 V.m−1field. In grey are states ionised by neither voltage. . . 95 3.12 PFI-ZEKE spectrum (points) around the first IP of Kr. Superimposed on this
experimental spectrum is a red-dashed gaussian line shape whose FW HM is 0.14 cm−1. . . 97 3.13 Raw PFI-ZEKE spectrum of the lowest vibrational levels of the CO+2 X+ 2Πg
ground state. . . 99 3.14 Energy diagram of the lowest vibrational levels of the CO+2 X+2Π
gground state accounting for the Renner-Teller and spin-orbit effects adapted from ref. [157]. . . 100 3.15 PFI-ZEKE spectrum of both spin-orbit components of the CO+2 X+ 2Πg(v1 =
0, v2 =0, v3 =0). . . 101 3.16 Illustration of an autoionisation process from a Rydberg state converging to the
2Π
1/2to the2Π3/2ground state in CO2+(X+). This process yields an electron with non-zero kinetic energy (EK >0). . . 101 3.17 Zoom on PFI-ZEKE experimental spectra of the vibrationless X+2Π3/2 ←X1Σ+g
transition recorded at different voltage steps. Using colour coding, the spectrum for each voltage step is represented, shifted vertically for clarity. Red dots locate maxima for a given transition which move to lower energies, the lower the voltage.104 3.18 PFI-ZEKE experimental (black) and simulated (blue) spectra of the vibrationless
X+2Π
3/2 ←X1Σ+g transition. Note the simulated spectrum used T = 10 K and is inverted with respect to the experimental spectrum to facilitate comparisons. Assignments to∆J branches are noted with the ground state rotational quantum J underneath. . . 105 3.19 PFI-ZEKE experimental (black) and simulated (blue) spectra of the vibrationless
X+2Π1/2 ←X1Σ+g transition. Note the simulated spectrum uses T = 10 K and is inverted with respect to the experimental spectrum to facilitate comparisons. Assignments to∆J branches are noted with the ground state rotational quantum J underneath. . . 106
3.20 Raw PFI-ZEKE experimental (black) and simulated (blue) spectra of the X+2Π(0, 1, 0) ←X1Σ+g transition. Note the simulated spectrum uses T = 10 K and is inverted with
re-spect to the experimental re-spectrum to facilitate comparisons. Assignments to vibronic states are noted. . . 107
3.21 Raw PFI-ZEKE experimental (black) and simulated (blue) spectra of the X+2Π(0, 2, 0) ←X1Σ+g and X+ 2Π(1, 0, 0) ←X1Σg+transitions. Note the simulated spectrum uses T =
10 K and is inverted with respect to the experimental spectrum to facilitate com-parisons. Assignments to vibronic states are noted. The positions of the2Φ states are noted with green vertical lines according to the model, but are not observed experimentally. . . 109
3.22 Illustration of the PRFI-ZEKE spectroscopy technique. a) Fixed photon energy ramped voltage scheme analogous to the step voltage scheme of Fig. 3.10. b) Zero-field stick spectrum. c) PRFI-ZEKE matrix gathering electron signals from ramped voltage schemes (a)) for every photon energy step of the scan, note the shift of spectral maxima (b)) with voltage follows a quadratic law (orange curves). 112 3.23 PRFI-ZEKE ramped voltage scheme (black line). A traditional PFI-ZEKE scheme
(red dashed line) is used to relate electron arrival times to voltage values. . . 113 3.24 PRFI-ZEKE image treatment on the X+ 2Π1/2 ←X1Σg+photoionising transition
in CO2. a) Raw PRFI-ZEKE matrix. b) Linearised PRFI-ZEKE matrix. c) Lin-earised and rotated PRFI-ZEKE matrix. d) PRFI-ZEKE spectrum (black) obtained by summing all electron signals in dashed box in c), compared to a simulated spectrum. . . 114 A.1 NH3photodissociation scheme. Following photoexcitation, excited NH3 can
re-lax via a number of different photodissociation channels. Branching ratios (BR) are noted for each. . . 121 A.2 General pump-probe scheme dissociating a generic molecule M producing
neu-tral fragments (F1, F2,...). The neutral fragments are then ionised to form cations which are detected after a time-of-flight (TOF) and recorded in a mass spectrum. Note that if hνprobe > IP(M), M+also appears in the mass spectrum. . . 122 A.3 Icare adaptation scheme for pump-probe setup. Each UV laser can be used
di-rectly or frequency tripled (via four-wave mixing) to provide VUV radiation if needed. . . 124 A.4 Implementation of four-wave mixing to generate VUV laser radiation in a rare
gas cell. . . 124 A.5 Illustration of the role of the MgF2prism to disperse the radiation exiting the rare
gas cell. An iris selects the VUV radiation for the experiment. . . 125 A.6 a) Typical VUV solar flux taken from ref. [191]. b) NH3 VUV photodissociation
cross section [8]. c) Product of the solar flux with the photodissociation cross section (c) = a)×b)), a blue vertical line at 213 nm (5.82 eV) locates the photodis-sociation energy of this work. . . 126 A.7 Pump-probe scheme of Fig. A.2 adapted to this specific NH3study. . . 128 A.8 Mass spectra obtained during the NH3photodissociation study using a
photodis-sociating pump at 5.82 eV (213 nm) and a photoionising probe at 13.6 eV (91 nm) in different laser configurations: a) Pump + probe (see e) for zoom) b) Pump only (see f) for zoom) c) Probe only (see g) for zoom) d) difference spectrum (= a) b) -c)) (see h)= e) - f) - g) for zoom) . . . 129 A.9 The NH2+ signal as a function of incident UV laser intensity on a log-log scale.
Circles represent experimental points, the linear fit, whose slope is 1.03±0.04, is represented as a red line. . . 130 A.10 a) Typical VUV solar flux taken from [191]. b) CH3OH VUV photodissociation
cross section [8]. c) Product of the solar flux with the photodissociation cross section (c) = a)×b)), a dashed blue vertical line at 118.2 nm (10.49 eV) locates the photodissociation energy of this work. A dashed purple vertical line at 121.6 nm (10.20 eV) locates the relevant wavelength for astrophysical applications. . . 135 A.11 Pump-probe scheme of Fig. A.2 adapted to this specific CH3OH study. . . 136 A.12 Mass spectra obtained during the CH4photodissociation at 10.49 eV (118.2 nm)
xvii
A.13 Mass spectra obtained during the CH3OH photodissociation at 10.49 eV (118.2 nm) probed at 10.78 eV (115 nm) in different laser configurations: a) Pump + probe b) Pump only c) Probe only d) difference spectrum (= a) - b) - c)) . . . 138 B.1 Summed mass spectrum over the whole scan (10.3 to 15.7 eV). CH3NCO
disso-ciative ionisation products are identified. . . 142 B.2 Ion yields of the products of CH3NCO dissociative ionisation. Blue- and
red-dashed lines correspond to the thermodynamic thresholds (ET) and theoretical thresholds (Eth) of Table B.1, respectively. Black arrows pinpoint appearance en-ergies (Ea) of the corresponding fragments, also summarised in Table B.1. Purple asterisks locate Ar absorption lines from the beamline gas filter used to calibrate the energy scale. . . 143 B.3 a) TPES of m/q =55 (red) and 57 a.m.u. (blue) spectra from this work, assigned
to CHCNO+ and CH3NCO+, respectively; m/q = 55 a.m.u. has a ×20 zoom. b) TPES combining the two spectra from panel a). c) Digitalised He I PES of CH3NCO from ref. [130]. . . 146
xix
List of Tables
1 Molecules observed in the Interstellar Space Medium and in circumstellar shells, from the CDMS website [3]. Around 30 % of the species are free radicals or their corresponding ions, noted in bold. Species studied in this thesis are highlighted in red. Questions marks label species whose observation is ambiguous. . . 2 1.1 IPs of rare gases used in the DESIRS beamline gas filter . . . 9 1.2 Free radical production techniques: advantages and disadvantages . . . 16 1.3 Typical settings for the flow tube reactor . . . 16 1.4 Two-photon rare gas transitions used in VUV laser generation via four-wave
mix-ing. . . 19 1.5 Horiba TGM300 VUV grating characteristics. . . 20 1.6 Equipment characteristics on the high-resolution UV laser chain. . . 22 1.7 Two-photon rare gas transitions and corresponding UV generation processes. . . 23 1.8 Quantum defects of Ar Rydberg series from ref. [34] . . . 35 1.9 Quantum defects of Kr Rydberg series from ref. [34] . . . 36 1.10 Characteristics of VUV light sources on the Saclay Plateau . . . 42 2.1 Summary of all known experimental photoionisation cross section measurements
for free radicals . . . 45 2.2 Summary of the photoionisation cross section determination method . . . 51 2.3 Ionisation Potentials (IP) of species implicated in the OH photoionisation cross
section determination of this work. . . 54 2.4 OH photoionisation cross section values. . . 58 2.5 Ionisation potentials of species implicated in the NH2photoionisation cross
sec-tion determinasec-tion of this work. . . 61 2.6 NH2absolute photoionisation cross section values . . . 64 2.7 m/q values and IPs of methanol isotopomers and their flow-tube products . . . 69 2.8 Photoionisation cross section evaluation using a simple model. . . 77 3.1 Summary of internal coordiantes of CH3NCO in the three electronic states of
interest extracted from the ab initio calculations. . . 81 3.2 Summary of physical properties of CH3NCO . . . 82 3.3 Peak energiesaand assignments. . . . 84 3.4 C2 and C+2 electronic state energies extrapolated to the CBS limit (see text) as
presented in ref. [147]. . . 89 3.5 Adiabatic ionization energies of C2. . . 91 3.6 Energy differences between C2and C2+states. . . 92 3.7 Vibrational modes of CO2(X) and CO+2(X+) . . . 98 3.8 ∆J branch weightings for the vibrationless X+2Π3/2 ←X1Σ+g transition . . . 105 3.9 Adiabatic IP of CO2. . . 106 3.10 ∆J branch weightings for the vibrationless X+2Π1/2 ←X1Σ+g transition . . . 106
3.11 Spin-orbit parameter of CO+2 . . . 107 3.12 Fit parameters for2Σ states of (0, 1, 0) states of CO+2 from ref. [159]. . . 108 3.13 Effective parameters (in cm−1) for2Π states of (0, 2, 0) and (1, 0, 0) states of CO+2
from ref. [161]. . . 110 A.1 NH3( ˜X1A1) photodissociation relaxation channels and their calculated
thermo-dynamic thresholds (assuming there is no potential energy barrier) at 0 K [118]. Accessible channels whose thresholds are below 5.82 eV are separated from the others with a dashed line. . . 127 A.2 Ionisation Potentials of species implicated in the NH3photodissociation study of
this work. . . 128 A.3 CH3OH( ˜X1A’) photodissociation relaxation channels (forming fragments in their
ground electronic states) and their calculated thermodynamic thresholds (assum-ing there is no potential energy barrier) at 0 K [118]. All products are thermody-namically accessible at 121.6 nm (10.20 eV). . . 133 A.4 CH3OH branching ratios at different photolysis wavelengths (photon energies)
from the literature. . . 134 A.5 Ionisation potentials of species implicated in the CH3OH photodissociation study
of this work. . . 136 B.1 Observed cationic fragments following the dissociative ionisation of CH3NCO
and corresponding measured appearance energies (Ea). These energies are com-pared to the thermodynamic (ET) and theoretical thresholds (Eth) that sometimes account for transition states (TS). . . 144
xxi
List of Abbreviations
a. m. u. atomic mass unitsarb. u. arbitrary units
CASSCF Complete Active Space Self-Consistent Field
CBS Complete Basis Set
COM Complex Organic Molecule
DELICIOUS Dichroism and ELectron / Ion Coincidence in IOnization Using Synchrotron
DESIRS Dichroïsme Et Spectroscopie par Interaction avec le Rayonnement Synchrotron
FC(F) Franck-Condon (Factor)
FT(S) Fourier-Transform (Spectroscopy)
FWHM Full Width at Half Maximum
IP Ionisation Potential
IR InfraRed
ISM Interstellar Space Medium
ISMO Institut des Sciences Moléculaires d’Orsay
MATI Mass-Analysed Threshold Ionisation
MCP Micro-Channel Plates
MRCI (+Q) Multi-Reference Configuration Interaction (Davidson correction)
PEPICO PhotoElectron PhotoIon COincidence
PES PhotoElectron Spectroscopy / Spectrum
PFI Pulsed-Field Ionisation
PIY PhotoIon Yield
PRFI Pulsed-Ramped-Field Ionisation
REMPI Resonance-Enhanced MultiPhoton Ionisation
RT Renner-Teller
SAPHIRS Spectroscopie d’Agrégats PhotoIonisés par le Rayonnement Synchrotron
SO Spin-Orbit
SOLEIL Source Optimisée de Lumière d’Energie Intermédiaire
du Laboratoire pour l’utilisation du rayonnement électromagnétique
SPES Slow PhotoElectron Spectroscopy
TOF Time-Of-Flight
TPEPICO Threshold PhotoElectron PhotoIon COincidence
TPES Threshold PhotoElectron Spectroscopy / Spectrum
UV UltraViolet
VUV Vacuum UltraViolet
XPS X-ray Photoelectron Spectroscopy
xxiii
"If I have seen further, it is by standing on the shoulders of giants"
I. Newton
1
Introduction
It has been known since the 1920s that light-induced processes can control the abundances of molecules in Space [1]. In practically all astrophysical media, high UV and VUV (Vacuum UltraViolet) fluxes, defined by wavelengths situated between 60 and 200 nm (20 - 6 eV), irradiate molecules found therein, which cause them to fragment. In the vicinity of stars for example, there are solar fluxes whose wavelength-dependency resembles that of a 4000 K black body along with absorption and emission features due to elements in the heliosphere. In particular the Lyman-α hydrogen emission line at 121.6 nm is a dominant spectral feature in the VUV, several orders of magnitude more intense than the background black body radiation. Far away from stars and even in dark regions, there are still intense UV and VUV fluxes, in particular the Draine flux [2], also called the interstellar radiation field. This type of radiation is produced by the photoelectric emission of interstellar grains following heating by cosmic rays and other sources.
Following irradiation and absorption of a VUV photon, a number of relaxation channels are possible for the molecule, namely fragmentation, ionisation, or dissociative ionisation. These are illustrated on NH2in Fig.1.
FIGURE1: Main relaxation pathways for the amino free radical (NH2) after ab-sorbing a VUV photon.
As of April 2020 [3], over 200 molecules have been detected in the Interstellar Space Medium and in circumstellar shells. Even more have been found in cometary or planetary atmospheres of our solar system. The recent instrumental developments have allowed the detailed analysis of the composition of cometary environments, both of the coma and even of the surface, notably using the COSAC experiment of the Philae lander on comet 67P/Churyumov-Gerasimenko [4]. On top of identifying species and quantifying their abundance, chemical reactivities are also ex-plored. In these cold environments, many chemical networks require the implication of photons to initiate reactivity [5].
TABLE1: Molecules observed in the Interstellar Space Medium and in circumstel-lar shells, from the CDMS website [3]. Around 30 % of the species are free radicals or their corresponding ions, noted in bold. Species studied in this thesis are high-lighted in red. Questions marks label species whose observation is ambiguous.
2 atoms 3 atoms 4 atoms 5 atoms 6 atoms 7 atoms
H2 C3 c-C3H C5 C5H C6H AlF C2H l-C3H C4H l-H2C4 CH2CHCN AlCl C2O C3N C4Si C2H4 CH3C2H C2 C2S C3O l-C3H2 CH3CN HC5N CH CH2 C3S c-C3H2 CH3NC CH3CHO CH+ HCN C2H2 H2CCN CH3OH CH3NH2 CN HCO NH3 CH4 CH3SH c-C2H4O CO HCO+ HCCN HC3N HC3NH+ H2CCHOH (?) CO+ HCS+ HCNH+ HC2NC HC2CHO C6H−
CP HOC+ HNCO HCOOH NH2CHO CH3NCO
SiC H2O HNCS H2CNH C5N HC5O HCl H2S HOCO+ H2C2O l-HC4H HOCH2CN KCl HNC H2CO H2NCN l-HC4N NH HNO H2CN HNC3 c-H2C3O NO MgCN H2CS SiH4 H2CCNH (?) NS MgNC H3O+ H2COH+ C5N− NaCl N2H+ c-SiC3 C4H− HNCHCN OH N2O CH3 HC(O)CN SiH3CN PN NaCN C3N− HNCNH C5S (?) SO OCS PH3 CH3O MgC4H SO+ SO2 HCNO NH4+
SiN c-SiC2 HOCN H2NCO+
SiO CO2 HSCN NCCNH+ SiS NH2 H2O2 CH3Cl CS H3+ C3H+ MgC3N HF SiCN HMgNC HD AlNC HCCO FeO? SiNC CNCN O2 HCP HONO CF+ CCP MgC2H SiH? AlOH PO H2O+ AlO H2Cl+ OH+ KCN CN− FeCN SH+ HO2 SH TiO2 HCl+ C2N TiO Si2C ArH+ HS2 N2 HCS NO+? HSC NS+ NCO HeH+ CaNC
3
Table1continued
8 atoms 9 atoms 10 atoms 11 atoms 12 atoms > 12 atoms
CH3C3N CH3C4H CH3C5N HC9N c-C6H6 C60
HC(O)OCH3 CH3CH2CN (CH3)2CO CH3C6H n−C3H7CN C70 CH3COOH (CH3)2O (CH2OH)2 C2H5OCHO i-C3H7CN C60+
C7H CH3CH2OH CH3CH2CHO CH3OC(O)CH3 C2H5OCH3 c-C6H5CN
C6H2 HC7N CH3CHCH2O CH2OHCHO C8H CH3OCH2OH l-HC6H CH3C(O)NH2 CH2CHCHO(?) C8H− CH2CCHCN C3H6 H2NCH2CN CH3CH2SH(?) CH3CHNH CH3NHCHO CH3SiH3 HC7O H2NC(O)NH2
The 200 plus molecules detected are summarised in Table1. As this table shows, a wide va-riety of species have been observed: small and large (complex molecules), neutral and charged, reactive (free radicals) and stable species. Many contain carbon so can be called organic. The nature of the molecule tells the story of the environment where it was observed and its past evolution. In a similar fashion to the molecules of Table1, these can be very diverse ranging from cold and icy grains or dust to giant molecular clouds containing young stellar objects and hot cores.
These observations guide the laboratory experiments [6], which, in turn, yield information on the photophysics and photochemistry that can be incorporated into models to better de-scribe the astrophysical media. Dozens of databases (e.g. KIDA [7], LAMBDA [8],...) collect quantitative information to be used in models. Observations, models, and laboratory-based ex-periments therefore form a powerful trio of tools for understanding astrophysical environments and the molecules found therein.
In the context of this PhD, the relaxation channels of astrophysically relevant molecules have been studied via laboratory-based experiments. The process at the heart of this work is photoionisation, which can be defined as the process by which a molecule emits an electron as a means of relaxation following the absorption of a photon. The importance of photon-induced processes for astrophysical molecules has already been noted. Photoionisation, in particular, is a means for a neutral stable molecule to become a charged ion, which is often more reactive. Even neutral but reactive species (e.g. free radicals) can gain in reactivity once ionised in some cases.
One of the aims of this work is to provide unprecedented quantitative data for describing photoionisation. This involves the determination of photoionisation cross sections, which relate the produced quantity of photoions to the initial quantity of neutral species. They are essential quantitative parameters to be included in models, but seldom available due to experimental difficulties. Indeed, free radicals are species that are difficult to produce in quantity and in a reliable fashion. The production of VUV radiation is non-trivial as the corresponding light sources are not commercially available. Finally, detection methods must be sensitive enough to probe the low quantities of radicals amongst much more abundant species (e.g. precursor molecules).
or data from the literature. In addition to providing quantitative results, carefully evaluated error bars are also needed. They are essential for models using the quantitative data in order to constrain the predictions.
Other aspects of this work, in particular the use of spectroscopy, give access to other infor-mation on photoionisation processes. For example, ionisation energies are measured, which are important for determining thresholds for photoionisation; they also lead to the determination of key thermodynamic quantities such as enthalpies of formation or even bond dissociation en-ergies when combined with other thermodynamic data. All of these quantitative parameters are essential for adequately modelling or simulating the relevant environments.
Spectroscopy also offers more qualitative information. In the VUV range, highly excited electronic neutral states, even above the ionisation threshold, and cationic states can be studied including their (ro)vibrational structure; all of which are of great fundamental interest in addi-tion to their applicaaddi-tion value. Photoionisaaddi-tion also offers the means of directly producing and studying simultaneously reactive cations from a stable neutral species without having to first produce and then conduct studies in the cation.
Fundamental interest and applications in photoionisation have motivated experimental works to pursue higher and higher resolution for over 50 years. One of the first pioneers in high-resolution photoelectron spectroscopy was Nobel laureate Kai Siegbahn who used X-ray sources in the 1950s to analyse the chemical composition of the surfaces of solids (X-ray Pho-toelectron Spectroscopy: XPS). He then applied this technique to atomic vapours in order to determine binding energies by photoionising core electrons with accuracies of around 1 eV. Higher resolution was achieved by the use of UV or VUV sources rather than X-rays. Notably, David Turner developped the use of He lamps in the 1960s, exploiting the 21.3 eV resonance [9], giving access to sub-eV resolution when probing valence electron ionisation. Other elements in lamps were also used to exploit different resonance energies. Turner studied, for example, the first ionisation potential (IP) of Ar at a resolution of 0.015 eV (121 cm−1) in 1967 [10]. This sort of resolution is quite sufficient to resolve the vibrational structures.
In this first method of PhotoElectron Spectroscopy (PES), the photon energy of the source is fixed. The kinetic energy of the emitted photoelectrons is analysed in order to retrieve in-formation on the cation. In parallel to the development of this fixed-energy technique, another technique was developped in the 1960s by the group of Mark Inghram with Tomas Baer [11,
12] that used a photon source whose energy is tunable thanks to a monochromator (Hopfield-continuum source & grating). Their experiments constrain the detection of photoelectrons to those with vanishing kinetic energy, i.e. threshold electrons. Hence, electrons are only detected if the incident photon energy corresponds to the transition energy towards a cationic state. This technique is thus called Threshold PhotoElectron Spectroscopy (TPES) [13]. Initial resolutions were typically 0.05 to 0.04 eV, but these were improved over time to become competitive with PES techniques. A major improvement in TPES was the use of velocity map imaging, which relies on stronger extraction fields. The result was higher resolution, but also the possibility of extracting the ions instead of electrons. The next step was to detect ions and electrons in co-incidence: (Threshold) PhotoElectron PhotoIon COincidence ((T)PEPICO spectroscopy), which allows the production of mass-selective photoelectron spectra [14]. Nowadays, these techniques can produce mass-selective photoelectron spectra at sub-meV (0.8 meV, 6 cm−1) resolutions [15]. This technique is used extensively in this thesis to produce medium-high-resolution spectra.
With the development of tunable lasers in the 1980s, these became popular photon sources for conducting high-resolution spectroscopy, especially as the laser line width was below the
5
resolution of traditional UV spectrometers. Much of this work was pioneered by Mueller-Dethlefs et al. who used REsonant MultiPhoton Ionisation (REMPI) and also Pulsed Field Ioni-sation (PFI) techniques to produce spectra of around 1 cm−1[16]. In order to further improve the resolution, PFI setups were coupled to narrow-bandwidth tunable VUV lasers capable of pro-ducing monochromatic VUV radiation with a bandwidth down to 0.008 cm−1 (10−6 eV) [17]. These setups were developped in the groups of Timothy Softley and then Frédéric Merkt and respresent a means of accessing the highest photoelectron resolution (0.06 cm−1, 7.10−6 eV) to-day [18]. This is the sort of setup that I helped develop and characterise during my PhD and will be described in full in Chapter1; some first results were also obtained with this setup and are presented in the manuscript.
All of these developments in photoelectron spectroscopy mean that the rotational structure can now be studied in detail via photoionisation. The spectroscopic constants that are deduced have great fundamental value, but are also of interest to scientific areas where these cations come into play. In astrophysics for example, most molecular detections are made in the Infrared or Millimetre domain based on the assignments of pure rotational transitions. The cationic spectroscopic constants determined in VUV photoelectron spectroscopy can therefore guide the observations and assist the assignments, when pure rotational data are not available.
Although photoionisation is the main focus of this work, other relaxation pathways are possible for a molecule following the absorption of a VUV photon (see Fig.1), namely pho-todissociation (the formation of neutral fragments) and dissociative ionisation (the formation of a charged and neutral fragments or, in some cases, the production of an ion pair cation / an-ion). Again in an astrophysical context, these relaxation processes are ways of forming reactive species from stable species, which go on to react to form more complex molecules.
This manuscript is split into three chapters:
• Chapter1details the experimental setups used to study the VUV photoionisation of as-trophysical molecules. Two setups are distinguished. The first is the DELICIOUS 3 spec-trometer of the DESIRS beamline at synchrotron SOLEIL. The second is the new VUL-CAIM laboratory setup of ISMO featuring a new high-resolution VUV laser, which was developed during my PhD. The experimental development and characterisation of this new setup are described in this chapter. The experimental techniques used in both setups are explained. Finally, comparisons are drawn between both setups to highlight their complementarity.
• Chapter2focuses on the relative and absolute photoionisation cross sections of free radi-cals (OH, NH2, and methanol-derived isotopologues) recorded at SOLEIL.
• Chapter3presents photoelectron spectroscopy results. The medium high-resolution pho-toelectron spectroscopy of CH3NCO and C2, obtained using the SOLEIL setup, are dis-cussed first of all. The second part of this chapter is dedicated to the first high-resolution results of VULCAIM using PFI-ZEKE spectroscopy. Finally, this chapter describes a promis-ing imagpromis-ing technique that has the capability of recordpromis-ing high-resolution spectra with a high signal-to-noise ratio in a fraction of the time of that used in traditional PFI-ZEKE spectroscopy.
In order to ensure constant coherence throughout the three chapters of the manuscript, fo-cusing on photoionisation, I chose to present in the appendices the work I performed on the other relaxation channels consecutive to a VUV photoexcitation:
• Appendix Adescribes exploratory works on the photodissociation of NH3and CH3OH using the laboratory setup adapted for a pump-probe study.
• Appendix B extends the photoionisation study of CH3NCO presented in chapter 3 to higher energies to study dissociative ionisation.
In addition, AppendixC lists my publication records as co-author. Conclusions and per-spectives are given at the end of each main section. These are summarised and generalised in a final conclusion.
7
Chapter 1
Experimental tools
In this chapter, I will present the two main experimental setups of this work. Both use a VUV light source to probe molecules of astrophysical interest in the gas phase:
• The first is a synchrotron-based experiment and will be described in the first section. • The second is a laboratory setup based around a high-resolution VUV laser as described
in the second section of this chapter. It constitutes a unique laser setup to France and there are only two others in Europe, and to our knowledge the world, one at Vrije Universiteit Amsterdam in the team of Wim Ubachs and one at ETH Zurich in the team of Frédéric Merkt.
As the synchrotron setup has been outlined in previous works, only a brief overview will be given here with an emphasis on the specificities of its use in the context of this work. As the VUV laser setup is very recent and was developed during this PhD, a more in-depth presenta-tion will describe its various elements and characteristics.
A final section will stress the importance and complementarity of these two experiments.
1.1
Synchrotron SOLEIL
1.1.1 The SOLEIL synchrotron facility
A synchrotron is a cyclic particle accelerator. Once accelerated and injected into the storage ring, particles are deviated by magnetic fields to maintain the cyclic trajectory. Associated to the Uni-versity of Paris-Saclay is the French synchrotron facility SOLEIL (Source Optimisée de Lumière d’Énergie Intermédiaire du Laboratoire pour l’utilisation du rayonnement électromagnétique). As pictured in Fig. 1.1, SOLEIL’s ring, measuring 354 m in circumference, contains several packets of electrons travelling with an energy of 2.75 GeV at almost the speed of light [19]. It takes just 1.2 µs for an electron to complete a lap of the ring. Given the extremely high repetition rate, it is therefore a good approximation to consider this light source continuous.
A closer look at SOLEIL’s ring reveals that it is not exactly a circle, but rather a 24-sided poly-gon made up of straight sections and small bends. In 1stand 2ndgeneration synchrotrons used bending magnets to accelerate electrons around the bends causing the emission of radiation known as Bremsstrahlung or synchrotron radiation. On 3rd generation rings, such as SOLEIL, insertion devices (undulatory or wigglers) are used instead of bending magnets, which produce a sinusoidal magnetic field. This field, via the Laplace force, puts the electron on a sinusoidal trajectory. Radiation is then emitted at each wiggle. The successive emissions interfere (en-hanced coherence), leading to a discrete spectrum (fundamental plus harmonics). The resulting radiation is much more brilliant than bending magnet emission, by a factor N2where N is the
FIGURE1.1: Schematic layout of the Synchrotron SOLEIL [19] along with its var-ious components.
number of periods of the undulator. The position of the resonant emission wavelength can be tuned by varying the magnetic fields seen by the electron beam, controlled by the intensity of electric current fed through the electromagnetic undulator. Even on a given beamline, the un-dulator is tuned to produce photons at various energies. In the context of this work, we used the DESIRS beamline whose undulator produces synchrotron radiation in the VUV range (6 to 40 eV). The spectral width for the produced radiation is around 7%. If need be, this radiation can then be monochromatised using a VUV grating.
1.1.2 The DESIRS beamline
The DESIRS beamline (Dichroïsme Et Spectroscopie par Interaction avec le Rayonnement Syn-chrotron) is easily tuned over the VUV range at medium high resolution (down to 1 meV) [20]. It is well adapted for photoionisation studies and medium high resolution spectroscopy studies presented in this work.
FIGURE 1.2: Left: layout of the DESIRS beamline displaying its various compo-nents and branches, adapted from ref. [19]. Right: simplified layout of the DESIRS