Publisher’s version / Version de l'éditeur:
Vous avez des questions? Nous pouvons vous aider. Pour communiquer directement avec un auteur, consultez
la première page de la revue dans laquelle son article a été publié afin de trouver ses coordonnées. Si vous n’arrivez pas à les repérer, communiquez avec nous à PublicationsArchive-ArchivesPublications@nrc-cnrc.gc.ca.
Questions? Contact the NRC Publications Archive team at
PublicationsArchive-ArchivesPublications@nrc-cnrc.gc.ca. If you wish to email the authors directly, please see the first page of the publication for their contact information.
https://publications-cnrc.canada.ca/fra/droits
L’accès à ce site Web et l’utilisation de son contenu sont assujettis aux conditions présentées dans le site LISEZ CES CONDITIONS ATTENTIVEMENT AVANT D’UTILISER CE SITE WEB.
25th International Conference on Offshore Mechanics and Arctic Engineering
[Proceedings], 2006
READ THESE TERMS AND CONDITIONS CAREFULLY BEFORE USING THIS WEBSITE. https://nrc-publications.canada.ca/eng/copyright
NRC Publications Archive Record / Notice des Archives des publications du CNRC :
https://nrc-publications.canada.ca/eng/view/object/?id=584cb841-211c-47dc-bec6-345f8a96380b
https://publications-cnrc.canada.ca/fra/voir/objet/?id=584cb841-211c-47dc-bec6-345f8a96380b
NRC Publications Archive
Archives des publications du CNRC
This publication could be one of several versions: author’s original, accepted manuscript or the publisher’s version. / La version de cette publication peut être l’une des suivantes : la version prépublication de l’auteur, la version acceptée du manuscrit ou la version de l’éditeur.
Access and use of this website and the material on it are subject to the Terms and Conditions set forth at
Design and optimization of an ice class propeller under shallow water,
semi-tunnel hull and heavy load conditions
Proceedings of OMAE 2006 25th International Conference on Offshore Mechanics and Arctic Engineering June 4-9, 2006, Hamburg, Germany
OMAE2006-92027
DESIGN AND OPTIMIZATION OF AN ICE CLASS PROPELLER UNDER SHALLOW WATER,
SEMI-TUNNEL HULL AND HEAVY LOAD CONDITIONS
Pengfei Liu* Mohammed Fakhrul Islam Shawn Searle
Institute for Ocean Technology, National Research Council, St. John’s, NL
Canada A1B 3T5 Email: Penfei.Liu@nrc.ca
Faculty of Engineering and Applied Sciences, Memorial University of Newfoundland, St. John’s, NL Canada
A1B 3X5
Oceanic Consulting Corporation Ltd, St. John’s,
NL Canada, A1B 2X5
Andrew McNeil Andrew Prior
Oceanic Consulting Corporation Ltd, St. John’s, NL Canada A1B 2X5
Fleetway Inc., Suite 800, 141 Laurier Avenue West, Ottawa, Ontario, Canada K1P 5J3
ABSTRACT
A design and optimization procedure developed and used for a propeller installed on a twin-semi-tunnel-hull ship navigating in very shallow and icy water under heavy load conditions is presented. The base propeller was first determined using classical design routines under open water condition utilizing existing model test data. In the optimization process, a panel method code (PROPELLA) was used to vary the pitch values and distributions and take into account the inflow wake distribution, tunnel gap and cavitation effects. The optimized propeller was able to numerically achieve a ship speed 0.02 knots higher than the desired speed and 0.06 knots higher than the classical B-series propeller. The analysis of the effect of inflow wake, hull tunnel, cavitation and blade rake angle on propulsive performance will be the focus of this paper
INTRODUCTION
With the development of computational technology, numerical expertise and increasing demand of propellers working under extreme conditions, conventional design method alone has long been inadequate for designing these propellers. Computational hydrodynamic methods have a great advantage of reducing the cost of manufacturing model propellers and facility time, and providing some performance results that could be very difficult to obtain in model tests. There exist huge amount of publications on lifting surface and panel method codes to evaluate hydrodynamic performance of a marine propeller. For example, Kerwin and Lee [Kerwin and Lee 1978], presented a hydrodynamic evaluation code by using a lifting surface method. The first application of panel method which was a more advanced method, for marine propellers was presented by Hess and Valarezo [Hess and Valarezo 1985]. Few of these lifting surface theories or panel methods codes were applied and presented for a detailed design and optimization process, or in other words, very few marine propeller design cases that fully utilized numerical codes were documented in literature. A couple of these examples includes a scientific fishing ship propeller design by using the panel method code [Hotaling et. al. 2001] and a podded propeller that was designed by using an in-house panel method code [Bertaglia et al. 2004]. This work is to develop and use such a
procedure to design and optimize a propeller and to shed some lights as a guideline on marine propeller design and optimization.
PROCEDURE AND METHOD
This section describes the design and optimization procedure and method. They were divided in to the following subsections:
• Given conditions that were obtained from a self propulsion report [Baranowski 2005], including ship data with constraints, resistance and power prediction data for minimum required propulsion efficiency, sea trial propulsion data for minimum thrust requirement and maximum allowable torque requirement; • Base propeller geometry determination in terms of pitch and
expanded area ratio that employs a classical BP-δ design method
with a Wageningen B4 type propeller of several expanded area ratios in terms of minimum required area based on cavitation; • New base propeller determination that contains the method of
determining the new base propeller, which is mainly a combination of the classical method with analysis in consideration of particular working conditions; and
• Optimization of the new base propeller that includes a brief introduction of the panel method code and optimization in terms of the variation of pitch values and distribution under the full scale cavitation number, with the hull effect and inflow wake that is surveyed and extrapolated for full scale. During optimization, the in-house panel method code PROPELLA, along with pre- and postprocessors were used.
PROCEDURE AND METHOD
This section describes the design and optimization procedure and method. It is divided in to the following subsections:
• Given conditions that were obtained from a self propulsion report [Baranowski 2005], including ship data with constraints, resistance and power prediction data for minimum required propulsion efficiency, sea trial propulsion data for minimum thrust requirement and maximum allowable torque requirement;
Proceedings of OMAE2006
25th International Conference on Offshore Mechanics and Arctic Engineering
June 4-9, 2006, Hamburg, Germany
• Base propeller geometry determination in terms of pitch and expanded area ratio that employs a classical BP-δ design method
with a Wageningen B4 type propeller of several expanded area ratios in terms of minimum required area based on cavitation; • New base propeller determination that contains the method of
determining the new base propeller, which is mainly a combination of the classical method with analysis in consideration of particular working conditions; and
• Optimization of the new base propeller that includes a brief introduction of the panel method code and optimization in terms of the variation of pitch values and distribution under the full scale cavitation number, with the hull effect and inflow wake that is surveyed and extrapolated for full scale. During optimization, the in-house panel method code PROPELLA, along with pre- and postprocessors were used.
Figures 1, 2 and 3 shows the full form diagram of the dual-semi-tunnel shallow water ice class ship, side view of the model ship and the propeller arrangement at the stern of the twin-propeller ship. The diameter of the full-scale propeller is limited to 1.60 meters.
Figure 1. HULL FORM DIAGRAM OF THE DUAL-SEMI-TUNNEL SHALLOW WATER ICE CLASS SHIP.
Figure 2. A PICTURE OF THE SIDE VIEW OF THE MODEL SHIP.
Figure 3. PROPELLER ARRANGEMENT AT THE STERN OF THE TWIN-PROPELLER SHIP.
Self Propulsion Propeller Data. These data are as follows:
• Propeller Model (s): P468 & P475 • Number of Blades z: 4 • Propeller Diameter D: 1.60 m • Pitch/D ratio at 0.7R: 1.1100 • Propeller revolution N: 449.50 (rpm)
FIGURE 4 SHOWS TWO DIFFERENT REAR VIEWS OF THE ICE BREAKER PROPULSION ARRANGEMENT.
Table 1 shows the self propulsion results for the hull with two stock propellers. Table 2 presents the extrapolated thrust and torque coefficients for full scale propeller.
Table 1. POWER PREDICTION FROM SELF PROPULSION TESTS.
SHIP Condition: Trials
VS[kn] PES[kW] 2xPDS[kW] nS[rpm] TS[kW] QS[kNm] Fnh 6 66 258 171.3 20 7 0.551 6.44 72 286 179.9 22 8 0.591 7.07 127 478 213 32 11 0.649 7.53 197 1561 316 78 24 0.691 8.05 328 4492 449.3 161 48 0.738 8.61 682 5042 467.2 176 52 0.79 9.04 1001 5055 467.2 176 52 0.829 10.02 1299 5059 467.6 176 52 0.92
Table 2. PROPULSION PERFORMANCE FROM SELF PROPULSION TESTS.
Thrust Coefficient and Torque Coefficient for Full Scale Trials Condition (Sorted)
Vs [Kn] Js Ship Kts Kqs 10Kqs Efficiency 8.0500 0.3457 0.2193 0.0409 0.4087 0.2953 8.6100 0.3556 0.2217 0.0409 0.4094 0.3065 9.0400 0.3733 0.2217 0.0409 0.4094 0.3218 8.0500 0.4134 0.2213 0.0409 0.4087 0.3563 7.5300 0.4598 0.2148 0.0413 0.4131 0.3805 7.0700 0.6404 0.1940 0.0417 0.4167 0.4744 6.0000 0.6758 0.1874 0.0410 0.4100 0.4917 6.4400 0.6907 0.1869 0.0425 0.4248 0.4837 A classical Bp-δ diagram method was used to estimate the requirement of propulsive performance. Table 3 shows the estimated required thrusts and efficiencies at different ship speeds.
Table 3. REQUIRED PROPULSIVE PERFORMANCE AT DIFFERENT SPEEDS.
Propeller Diameter in m 1.60
Revolution Speed in rpm 449.50
Fluid Density in Tonne/m3 1.0250
Delivered Power for each
Propeller (KW) 859.00
Effective Power for each
propeller (KW) 102.00 100.00 112.50 101.00 101.50 102.50 Ship Speed in knot 7.60 7.5300 7.8000 7.5600 7.5800 7.6200 Ship Speed in m/s 3.91 3.8742 4.0131 3.8896 3.8999 3.9205 Propeller Advance Speed 4.20 4.0292 4.7286 4.1074 4.1543 4.2509 Ship Advance Coef., Js 0.3262 0.3232 0.3348 0.3245 0.3254 0.3271
Wake Fraction, Ws -0.0747 -0.0400 -0.1783 -0.0560 -0.0652 -0.0843
Thrust Deduction Fraction, t 0.6982 0.6740 0.7409 0.6865 0.6925 0.7037 Propeller Advance
Coefficient, Jp
0.3506 0.3361 0.3945 0.3427 0.3466 0.3546 Required Resistance,
R=Pe/Vs in KN 52.17 51.62 56.07 51.93 52.05 52.29 Required Thrust for each
Propeller, T in KN, Pe=T*Va 86.445 79.178 108.18 82.84 84.64 88.24 Required Kt for each
propeller 0.229 0.2100 0.2869 0.2197 0.2245 0.2340 Required Torque for each
Propeller, Q in KN-m, Pd=2*PI*n*Q
18.24 18.24 18.24 18.24 18.24 18.24 Required Kq for each
propeller 0.0303 0.0303 0.0303 0.0303 0.0303 0.0303 Required Propeller
Efficiency, η 0.4229 0.3714 0.5955 0.3961 0.4094 0.4366
Table 3 reveals that to achieve a speed of 7.6 knots, the propeller should have an efficiency of 0.4229 or higher, a thrust coefficient of 0.2293 or higher and a torque coefficient of 0.0303 or lower, according to the thrust power prediction curve for the ship hull obtained from the self propulsion test and the fixed value of the single engineer delivered power.
Wake Survey. Wake survey data was provided in the self propulsion tests report. Equivalent ship wake fraction, thrust deduction fraction and relative rotational efficiency were then obtained. Figure 5 shows the axial wake in the propeller plane, view from the stern
.
Figure 5. AXIAL WAKE DISTRIBUTIONS IN THE PROPELLER PLANE
Figure 6 shows the circumferential distribution of the axial wake in the form of input for the code, in terms of 1-Vx/Vm, where Vm is the
model ship advance speed. Note that the horizontal axis of the figure is the vertical axis in ship, i.e., zero degree in the plot pointing at the North and the plot was viewing from bow and the circumferential positions were counted clockwise.
Figure 6. CIRCUMFERENTIAL DISTRIBUTION OF AXIAL WAKE IN THE FORM FOR THE CODE INPUT.
Figure 7 shows the normalized radial components of the wake. Due to the hull shape (semi-tunnel) at the propeller plane, the velocity profile is not perfectly symmetrical between the port and starboard side, but is obviously asymmetrical between near hull wall side (top) and bottom side.
Figure 7. NORMALIZED RADIAL COMPONENTS OF THE WAKE.
Figure 8 shows the normalized tangential components of the wake in the propeller plane.
Figure 8. TANGENTIAL COMPONENTS OF THE WAKE IN THE PROPELLER PLANE.
For the propeller in the left semi-tunnel, a very strong asymmetry of the tangential velocity is shown between the mid-ship (90°) side and the port side (180°).
Base Propeller Determination
The number of blades and diameter of the propeller were fixed as a basic requirement for the base propeller determination. The classic BP-δ design method with a Wageningen B4 propeller of several
expanded area ratios in terms of cavitation performance were used to make decision about the particulars of the base propeller. Table 8 presents the preliminary of particulars. In calculations, the diameter of propeller, shaft revolution speed and engine output power (shaft torque limit) are fixed.
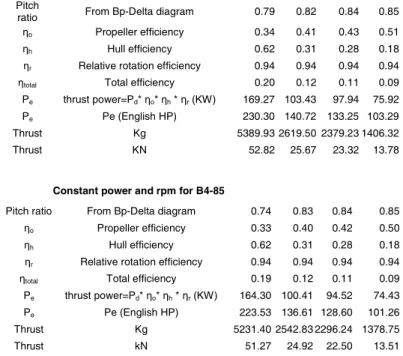
Performance Estimation. Table 4 shows the procedure that determines the base propeller, using the traditional methods. Based on the given fixed number of blades and diameter, at constant rotational speed and delivered power, the maximum reachable speed for a B4-55, -70 and -85 propeller was around 7.57, 7.56 and 7.53 knots, respectively. The target was to achieve 7.6 knots or more satisfying all the given operating conditions. Therefore, a new propeller must be designed and optimized to exceed the performance of these B-series propellers.
Table 4. DETERMINATION OF THE BASE PROPELLER BASED ON B-SERIES.
Constant power and rpm for B4-55
Pd Delivered power (Emperor HP) 1167.35 1167.35 1167.351167.35
Vs Knot 7.07 7.53 7.60 8.05
Ws Wake fraction 0.12 -0.04 -0.07 -0.33
t Thrust deduction 0.46 0.67 0.70 0.75
J Ship advance coefficient 0.30 0.32 0.33 0.35
Va Knot 6.23 7.83 8.16 10.71
Jp Propeller disk advance coefficient 0.27 0.34 0.35 0.46
Pitch
ratio From Bp-Delta diagram 0.77 0.79 0.81 0.82
ηo Propeller efficiency 0.35 0.42 0.43 0.53
ηh Hull efficiency 0.62 0.31 0.28 0.18
ηr Relative rotation efficiency 0.88 0.94 0.94 0.95
ηtotal Total efficiency 0.19 0.12 0.11 0.09
Pe thrust power=Pd* ηo* ηh * ηr (KW) 164.45 106.42 98.48 80.19
Pe Pe (English HP) 223.74 144.78 133.99 109.10
Thrust Kg 5236.31 2695.07 2392.421485.4
7
Thrust KN 51.32 26.42 23.45 14.56
Constant power and rpm for B4-70
Pitch
ratio From Bp-Delta diagram 0.79 0.82 0.84 0.85
ηo Propeller efficiency 0.34 0.41 0.43 0.51
ηh Hull efficiency 0.62 0.31 0.28 0.18
ηr Relative rotation efficiency 0.94 0.94 0.94 0.94
ηtotal Total efficiency 0.20 0.12 0.11 0.09
Pe thrust power=Pd* ηo* ηh * ηr (KW) 169.27 103.43 97.94 75.92
Pe Pe (English HP) 230.30 140.72 133.25 103.29
Thrust Kg 5389.93 2619.50 2379.23 1406.32
Thrust KN 52.82 25.67 23.32 13.78
Constant power and rpm for B4-85
Pitch ratio From Bp-Delta diagram 0.74 0.83 0.84 0.85
ηo Propeller efficiency 0.33 0.40 0.42 0.50
ηh Hull efficiency 0.62 0.31 0.28 0.18
ηr Relative rotation efficiency 0.94 0.94 0.94 0.94
ηtotal Total efficiency 0.19 0.12 0.11 0.09
Pe thrust power=Pd* ηo* ηh * ηr (KW) 164.30 100.41 94.52 74.43
Pe Pe (English HP) 223.53 136.61 128.60 101.26
Thrust Kg 5231.40 2542.83 2296.24 1378.75
Thrust kN 51.27 24.92 22.50 13.51
Figure 9 shows the required effective power versus ship speed and the thrust power capability of the B-series propellers with three different expanded area ratios (EAR).
Determination of speed and power 90 95 100 105 110 115 120 7.50 7.55 7.60 7.65 7.70 Ship Speed in Knots
Re qu ir ed Ef fe ct iv e Po we r, PE
one prop PES B4-55 B4-70 B4-85
Figure 9. DETERMINATION OF SPEED AND POWER FOR THE BASE PROPELLER.
Determining the Minimum Required Expanded Area Ratio. The expanded area ratios are normally determined by the cavitation allowance. Using the classical Burrill’s method, the required blade area based on cavitation for the ice class propeller CCGS Eckaloo is determined (intersection of the two lines) and shown in figure 10. 0.9 1.0 1.1 1.2 1.3 1.4 1.5 0.55 0.65 0.75 0.85 EAR Ar ea i n me te r sq ua re d Minimum required area Actual area
Figure 10. DETERMINATION OF MINIMUM REQUIRED AREA FOR HEAVILY LOADED PROPELLER.
With the target speed of 7.6 knots, the expanded area ratio EAR is EAR=0.7919 (the intersection of the two curves in Figure 10) and P/D=0.83. In this case, the equivalent propeller open water advance coefficient is J=0.33 based on the estimated wake fraction factor from the self propulsion tests. Cavitation number based on the formula in the current version of the code is then:
= − − + 2 2 5 . 0 ) ( D n P R H g Patm vapor ρ ρ 4433 . 1 6 . 1 ) 60 / 5 . 449 ( 1000 5 . 0 1730 ) 8 . 0 22 . 1 ( 8 . 9 1000 101300 2 2 = × × − − × × + , and
cavitation number based on classical references/chart calculation:
= − − + 2 2 5 . 0 ) ( D n P R H g Patm vapor ρ ρ 2985 . 0 ] 6 . 1 ) 60 / 5 . 449 ( 7 . 0 [ 1000 5 . 0 1730 ) 8 . 0 22 . 1 ( 8 . 9 1000 101300 2 2 2 + = × × − − × × + a V π
Strength Validation for the Base Propeller. With the maximum thickness at r/R=0.0 and 1.0 of tmax = 137.8 mm =
0.0861 D and tmax = 7.88 mm = 0.0049D, respectively, chord length at
0.2 R of 0.512 m, rake angle of 12 degrees, number of blades of 4, diameter of the propeller of 1.6 m, shaft speed of 449.5 rpm, delivered power 1175 HP and ice class III propeller thickness correction, it gives the blade thickness distribution in table 6.
Table 5. MODIFIED THICKNESS DISTRIBUTION FOR THE BASE PROPELLER. r/R t/D t/c 0.0000 0.1124 0.2000 0.0870 0.3000 0.0749 0.2018 0.4000 0.0635 0.1533 0.5000 0.0530 0.1179 0.6000 0.0430 0.0912 0.7000 0.0338 0.0715 0.8000 0.0251 0.0564 0.9000 0.0168 0.0455 0.9500 0.0129 0.0454 1.0000 0.0090 0.0552
New Base Propeller Determination
As mentioned in the previous subsection, the base propeller cannot reach the required propulsive performance to get the ship at a speed of 7.6 knots. The base propeller has to be modified. An NACA 66 MOD sectional geometry with a mean line of A=0.8 was chosen. If this sectional type cannot still satisfy the propulsion performance, a more detailed modification on the individual section is then necessary. The planform shape of the new base propeller is designed based on the PP0000C0 propeller model, which is a base propeller for a podded propeller series [Liu 2002A]. With a consideration of the tunnel effect, that is similar to a propeller with a nozzle, a much wider blade tip was taken. The nominal pitch at 0.7R is 0.83 as shown in table 7 for the planform shape arrangement.
Table 6. PLANFORM GEOMETRY DETAILS OF THE PROPELLER.
Sectional Geometry Offsets for new ice class propeller based on PP0000C0 in the Radial
Direction r/R c/d p/d t/c f/c 0.3000 0.3712 0.8300 0.1553 0.0232 0.4000 0.4145 0.8300 0.1180 0.0230 0.5000 0.4498 0.8300 0.0916 0.0218 0.6000 0.4721 0.8300 0.0696 0.0207 0.7000 0.4733 0.8300 0.0542 0.0200 0.8000 0.4452 0.8300 0.0421 0.0197 0.9000 0.3700 0.8300 0.0332 0.0182 0.9500 0.2842 0.8300 0.0323 0.0163 1.0000 0.1638 0.8300 0.0316 0.0118
A rake of 12 degrees was chosen to improve the inflow of the propeller. The hub diameter ratio for this type of ice class propeller was taken as 0.26 with zero skew.
Optimization of the New Base Propeller
Propeller performance was estimated with the variation of pitch value and distributions. Figure 11 shows the various pitch values and distributions in the optimization.
Pitch Distribution for Optimization 0.5 0.7 0.9 1.1 1.3 1.5 1.7 0.24 0.44 0.64 0.84 r/R p/ D base propeller p/D multiplyer Mod P/D 1 Mod P/D 2 Mod P/D 3 Mod P/D 4 Mod P/D 5
Figure 11. VARIOUS PITCH DISTRIBUTIONS USED IN THE PROCESS OF OPTIMIZATION.
Use of Numerical Code for Optimization. A comprehensive software package, PROPELLA was extensively used for the optimization work [Liu 1997, Liu and Bose 1998, and Liu 2002B]. PROPELLA is a three-dimensional, unsteady panel method code for the evaluation of propeller thrust and torque (shaft and blade torque/bending moments) and for the design and optimization of a prototype propeller. This software package has the ability to model ducts and rudders and other arbitrary bodies in the vicinity of the propeller, with/without inflow wake. PROPELLA has been validated against published data for a range of propeller types, including B-series, a number of ice class propeller and Kaplan as well as highly skewed models. PROPELLA enables the user to visualize the pressure distribution over the propeller blade and hub, and to examine loads and sheet cavitation areas on a per-blade basis. This capability is useful in examining cyclic loading due to wake characteristics or flow blockages
There are 24 runs to complete the computation for the propeller with 1.60 m diameter. These runs include the five runs of different pitching values and distributions at the design advance coefficient, J=0.33. Four additional runs to study the effects of rake angle on propulsive performance at design J and optimized pitch distributions. Some additional runs were also performed to study the hull effect, cavitation effect and inflow wake effect for all the pitch distributions.
Summary of the Optimized Propeller. Propulsive performance of the 3 different pitch values (2 pitch values are not show) is shown in figure 12. In the figure, the straight lines are required minimum thrust coefficient, Kt for 7.6 knots, maximum allowable torque coefficient, Ka (limited power consumption), and minimum required efficiency, η.
For the three curves, Kt, Kq and η, to intersect at about the same nominal pitch value, it requires substantial more computational runs. A pitch value of 0.87 satisfies all three required minimum values.
Nominal Pitch vs. Performance at 7.6 knot 0.1 0.15 0.2 0.25 0.3 0.35 0.4 0.45 0.5 0.77 0.82 0.87 Nominal P/D at 0.7R Kt , 10 Kq , Et a Kt 10Kq Eta Reqd Kt Reqd 10Kq Reqd Eta
Figure 12. NOMINAL PITCH VALUES VERSUS PROPULSIVE PERFORMANCE FOR 1.6M DIAMETER
PROPELLER.
Pitch distribution 4 was selected primarily as it satisfies the required thrust and efficiency at J=0.33 (7.56 knots). Further simulations have been performed at higher advance coefficients (at higher propeller advance speed), which marginally satisfy required thrust and efficiency conditions. Finally at J=0.3546 (7.62 knots) was achieved. The finalized particulars of the optimized propeller are summered in tables 8, 9 and 10, for information on general parameters, planform profile and sectional offsets, respectively.
Table 7. OPTIMIZED PROPELLER GEOMETRY PARAMETERS.
Propeller Diameter, D 1.6 m Expand Area Ratio, EAR 0.7919
Number of Blades 4 Rotational Speed 449.5 rpm Pitch Distribution r/R=0.26 0.6442 D r/R=0.7 0.824 D r/R=1.0 0.5094 D
Hub Diameter Ratio 0.26 D Max. Thickness Ratios
r/R=0.0 0.1124 D
r/R=0.2 0.0870 D
r/R=0.9 0.0168 D
r/R=1.0 0.009 D
Equivalent flow conditions in classical propeller Design
Design Advance Speed (knots) 7.62 Wake Fraction, Ws 0.0843 Thrust Deduction, t 0.7037 Design Advance Coefficient J 0.3546
Table 8. PROPELLER PLANFORM PROFILE DETAILS.
r/R c/D p/D Skew Rake 0.30 0.3712 0.6667 0.0000 0.2125 0.40 0.4145 0.7341 0.0000 0.2125 0.50 0.4498 0.7865 0.0000 0.2125 0.60 0.4721 0.8240 0.0000 0.2125 0.70 0.4733 0.8240 0.0000 0.2125 0.80 0.4452 0.7720 0.0000 0.2125 0.90 0.3700 0.6517 0.0000 0.2125 0.95 0.3300 0.5843 0.0000 0.2125 1.00 0.2842 0.5094 0.0000 0.2125
Table 9. PROPELLER SECTIONAL OFFSET PROFILE DETAILS. r/R t/c f/c t (mm) f (mm) 0.30 0.2018 0.0232 119.8631 13.76707 0.40 0.1533 0.0230 101.6507 15.2735 0.50 0.1179 0.0218 84.82861 15.70342 0.60 0.0912 0.0207 68.85859 15.65106 0.70 0.0715 0.0200 54.13741 15.16832 0.80 0.0564 0.0197 40.17429 14.01133 0.90 0.0455 0.0182 26.95007 10.75664 0.95 0.0454 0.0163 23.98097 8.61168 1.00 0.0552 0.0118 25.11066 5.34296
As the propeller will be working under very heavy load condition, root and tip cavitation and could be problematic. We reduced the pitch values of blade root and tip to 78% (0.6442/0.8420) and 62%, respectively. Figure 13 shows the mesh view generated and panelized by PROPELLA for computation.
Figure 13. SURFACE VIEW OF THE OPTIMIZED PROPELLER.
During computations, the hull gap effect, i.e., nozzle effect was taken in to account by including the region of the hull around the propeller. Figures 14 and 15 are the rear and bottom view of the propeller-hull interaction mesh.
Figure 14. PROPELLER-HULL ARRANGEMENTS VIEWING FROM STERN TO BOW.
Figure 15. BOTTOM VIEW OF THE PORT PROPELLER IN THE SEMI-TUNNEL UNDER A REAR PART OF THE HALF
HULL.
Figure 16 is the rear view of the propeller inside the semi-tunnel.
Figure 16. REAR VIEW OF THE PORT PROPELLER IN THE SEMI-TUNNEL UNDER A REAR PART OF THE HALF HULL.
Hydrodynamic characteristics of the Optimized Propeller. Figure 17 shows Kt and Kq fluctuations over one revolution (zero degree of key blade is pointing north, going in clockwise direction), at an advance coefficient of J=0.3546 (Speed of propeller shaft Va = 7.62 knots).
Shaft Kt, Kq Fluctuations -0.265 -0.26 -0.255 -0.25 -0.245 -0.24 -0.235 -0.23 0 60 120 180 240 300 360 Blade Position in Degrees Sh af t Kt , Sh af t 10 Kq Shaft Kt Shaft 10Kq
Figure 17. SHAFT THRUST AND TORQUE COEFFICIENTS FLUCTUATIONS OVER ONE PROPELLER ROTATION.
It can be seen that at 90 degrees, when a blade is at horizontal position pointing at the centre line of the ship, i.e., aiming at the other propeller, the shaft torque and thrust reached maximum. However, compared with the torque and thrust at other positions, they do not have large enough fluctuation to create a vibration problem.
Figure 18 shows the pressure coefficient before and after cavitation correction for blade section at 0.72R at 0°, 90°, 180° and 270° of key blade location
Sectional pressure distributions with and without
cavitaiton corrections -0.4 -0.3 -0.2 -0.1 0 0.1 0.2 0.3 0.4 0.5 0 0.5 1 x/c Cp 90°IPK 90° Cav Sectional pressure distributions with and without
cavitaiton corrections -0.2 -0.15 -0.1 -0.05 0 0.05 0.1 0.15 0.2 0 0.5 1 x/c Cp 180°IPK 180° Cav Sectional pressure distributions with and without
cavitaiton corrections -0.16 -0.11 -0.06 -0.01 0.04 0.09 0.14 0.19 0 0.5 1 x/c Cp 270°IPK 270°IPK Sectional pressure distributions with and without
cavitaiton corrections -0.2 -0.15 -0.1 -0.05 0 0.05 0.1 0.15 0.2 0.25 0 0.2 0.4 0.6 0.8 1 x/c Cp 0°IPK 0° Cav
Figure 18. PRESSURE COEFFICIENTS BEFORE AND AFTER CAVITATION CORRECTION.
When the key blade is pointing at the mid-ship position, it has the maximum negative pressure with a little cavitation at the leading edge (top left plot).
Effect of Presence of Inflow Wake
.
Figure 19 shows the performance comparison of the optimized propeller working in the wake of tunnel hull and working in the open water for various pitch distributions at J=0.33 and n=7.5 rps.It can be seen that with inflow wake taken in to account the propeller gave a better propulsive performance in terms of efficiency, with both increased thrust and torque. At the propeller disk plan inside the semi tunnel top, inflow axial velocity is increased. The equivalent wake fraction calculated using the wake survey of the ship was negative (-0.0747 at 7.6 Kts), apposite to a positive value for traditional single propeller hull ships.
This increased efficiency, however, did not give good overall ship hull efficiency as the thrust deduction of the ship is very large (0.6982 at 7.6 Kts), due to a very complicated stern shape.
Effect of Wake Distribution on Performance 0.18 0.23 0.28 0.33 0.38 0.43 0.48 0.72 0.77 0.82 0.87 Nominal Pitch, P/D at 0.7R Kt , 10 Kq , Et a Kt_WO_Wake 10Kq_WO_Wake Eta_WO_Wake Kt_W_Wake 10Kq_W_Wake Eta_W_Wake
Figure 19. PERFORMANCE COMPARISON OF THE OPTIMIZED PROPELLER.
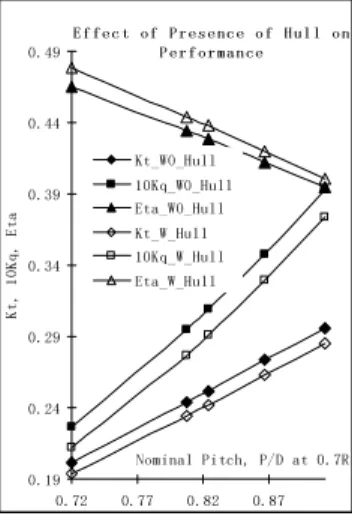
Effect of Presence of Tunnel Gap. Figure 20 shows the comparison of the propeller with and without tunnel gap effect, with a variation of pitch distributions at J=0.33 and n=7.5 rps.
Effect of Presence of Hull on Performance 0.19 0.24 0.29 0.34 0.39 0.44 0.49 0.72 0.77 0.82 0.87 Nominal Pitch, P/D at 0.7R Kt , 10 Kq , Et a Kt_WO_Hull 10Kq_WO_Hull Eta_WO_Hull Kt_W_Hull 10Kq_W_Hull Eta_W_Hull
Figure 20. COMPARISON OF THE PROPELLER WITH AND WITHOUT TUNNEL GAP EFFECT.
From the figure it noted that the tunnel gap has a decrease in thrust with a more drop in torque, giving a resultantly higher efficiency. This is similar to the nature of nozzle propellers.
CONCLUSION
A design and optimization procedure developed and used for a propeller installed on a twin-semi-tunnel-hull ship navigating in very shallow and icy water under heavy load conditions is presented. This novel and practical design and optimization procedure is a combination of the base propeller determination using classical design method and the detailed optimization using hydrodynamic code. The procedure described here is suitable for both special purpose propellers and conventional propellers design. A panel method code (PROPELLA) was used to vary the pitch values and distributions and take into account the inflow wake distribution, tunnel gap and cavitation effects. The methodology developed was then applied on a very shallow water semi-tunnel ship with two propellers navigating in an icy water environment. The optimized propeller was able to numerically achieve a ship speed 0.02 knots higher than the desired speed and 0.06 knots higher than the classical B-series propeller. Further optimization may also be performed by modifying the blade sectional profile and pressure distribution for cavitation, when special performance characteristics are need. For the ice class, shallow water propeller, the analysis of the effect of inflow wake and tunnel gap on propulsive performance was presented. The results showed that a slight peak torque and thrust increase is seen when a blade is horizontal pointing at the other propeller (centre-line plane), compared with other positions, which means the optimized propeller has a reasonably small shaft force fluctuation. The pressure coefficient at 0.7R was presented at 4 different circumferential positions over one revolution and showed that the highest negative pressure coincided with the position where the torques and thrusts were at maximum. At that position, a very small cavitation occurred at the leading edge. The inflow wake has a positive effect on the efficiency duo to the increase of the thrust more than the increase of the torque. This is mainly due to the hull wall effect in terms of the tunnel. The presence of the tunnel also showed a similar effect to nozzle on a propeller. With the presence of the hull, the propeller produced thrust dropped but with a larger decreased torque requirement. This in combination gave an increased efficiency.
ACKNOWLEDGEMENT
The authors thank to National Research Council and Oceanic Consulting Cooperation Ltd for their support.
REFERENCES
[1] Hess, J.L. and Valarezo, W.O., 1985. “Calculation of steady flow about propellers by means of surface panel method”. Proceedings, Research and Technology Douglas Aircraft Company, Long Beach, CA, 8p.
[2] J. E. Kerwin and C-S Lee, 1978. "Prediction of steady and Unsteady Marine propeller performance by Numerical Lifting Surface Theory". SNAME Transaction, Vol 86, 1978, pp. 218-253. [3] J. M. Hotaling, J. M. Meehan and G. Karafiath, 2001. "Fisheries research vessel hull and propeller design to maximize hydro acoustic survey efficiency". U.S. Papers for 24th UJNR/MFP, 18 p.
[4] G. Bertaglia, G. Lavini and S. Scarpa, 2004. "Hull design and optimization with pod propellers with 5 and 6 blades". Proceedings
of the 1st International Conference on Technological Advances in Podded Propulsion, University of Newcastle, Newcastle, UK, pp. 39-57.
[5] A. Baranowski, 2005. CCGS Eckaloo results of model tests in
shallow water hull model M634-A: resistance, self propulsion and wake 3D. Ship Design and Research Centre Technical Report, No. RH-2005/T-053E, Gdansk, Poland, 51 p.
[6] P. Liu, 2002A. Geometrical Design of a Podded Propeller Base
Mode. Design Notes, National Research Council Canada, Institute for Ocean Technology. 3p.
[7] P. Liu, 1996. Software Development on Propeller Geometry Input
Processing and Panel Method Predictions of Propulsive Performance of the R-Class Propeller. MMC Engineering & Research Report, NL Canada, 50 p.
[8] P. Liu and N. Bose, 1998. "An Unsteady Panel Method for Highly Skewed Propellers in Non-Uniform Inflow". 22nd ITTC Propulsion
Committee Propeller RANS/Panel Method Workshop, 5-6 April, Grenoble, France, pp.343-349.
[9] P. Liu, 2002B. “Design and implementation for 3-D unsteady data visualization using object-oriented MFC and OpenGL”, International
Journal of Computational Fluid Dynamics of Japan, Vol. 11, no. 3, pp. 335-345.