A
B
Standard
difference
in means
Standard
error
Variance
Lower
limit
Upper
limit
Z-Value
p-Value
Studies
Champion et al.
Hamza et al.
Hermann et al.
Klugsberger et al.
Manwaring et al.
Mouton et al.
Savel et al.
Yu et al.
Analysis
Champion et al.
Davis et al.
Hamza et al.
Hermann et al.
Klugsberger et al.
Manwaring et al.
Mouton et al.
Nguyen et al.
Sammour et al.
Savel et al.
Yeh et al.
Yu et al.
Analysis
Champion et al.
Davis et al.
Hamza et al.
Hermann et al.
Mouton et al.
Sammour et al.
Savel et al.
Yu et al.
Analysis
D
Benavides et al.
Champion et al.
Hermann et al.
Manwaring et al.
Ott et al.
Analysis
C
-0.089 0.283 0.080 -0.644 0.466 -0.314 0.753
-0.675 0.310 0.096 -1.283 -0.067 -2.175 0.030
-0.220 0.204 0.041 -0.620 0.179 -1.081 0.279
-0.311 0.166 0.028 -0.636 0.015 -1.870 0.061
-0.237 0.259 0.067 -0.745 0.271 -0.915 0.360
-0.843 0.330 0.109 -1.490 -0.197 -2.555 0.011
0.250 0.367 0.134 -0.469 0.968 0.681 0.496
0.034 0.145 0.021 -0.251 0.318 0.233 0.815
-0.229 0.104 0.011 -0.432 -0.025 -2.199 0.028
0.153 0.283 0.080 -0.402 0.709 0.542 0.588
-0.192 0.427 0.183 -1.029 0.646 -0.449 0.654
0.000 0.302 0.091 -0.592 0.592 0.000 1.000
0.058 0.203 0.041 -0.341 0.456 0.283 0.777
-0.061 0.165 0.027 -0.384 0.263 -0.367 0.714
0.000 0.258 0.067 -0.506 0.506 0.000 1.000
-1.035 0.337 0.113 -1.695 -0.375 -3.075 0.002
-0.395 0.452 0.204 -1.280 0.490 -0.874 0.382
0.793 0.242 0.058 0.319 1.267 3.280 0.001
-0.661 0.375 0.141 -1.396 0.074 -1.763 0.078
-0.115 0.145 0.021 -0.400 0.170 -0.792 0.428
-0.075 0.124 0.015 -0.318 0.169 -0.601 0.548
0.273 0.284 0.081 -0.284 0.830 0.960 0.337
-0.570 0.435 0.189 -1.423 0.282 -1.311 0.190
0.000 0.302 0.091 -0.592 0.592 0.000 1.000
0.000 0.203 0.041 -0.398 0.398 0.000 1.000
-1.167 0.342 0.117 -1.838 -0.497 -3.412 0.001
0.383 0.235 0.055 -0.077 0.844 1.632 0.103
0.291 0.367 0.135 -0.428 1.011 0.793 0.428
-0.076 0.145 0.021 -0.361 0.208 -0.524 0.600
-0.061 0.149 0.022 -0.354 0.231 -0.412 0.681
-1.274 0.257 0.066 -1.777 -0.770 -4.958 0.000
-0.106 0.283 0.080 -0.661 0.449 -0.375 0.708
-0.454 0.206 0.042 -0.857 -0.050 -2.205 0.027
0.327 0.260 0.068 -0.183 0.836 1.257 0.209
-0.654 0.263 0.069 -1.169 -0.139 -2.489 0.013
-0.435 0.260 0.067 -0.944 0.073 -1.677 0.093
-2.00
-1.00
0.00
1.00
2.00
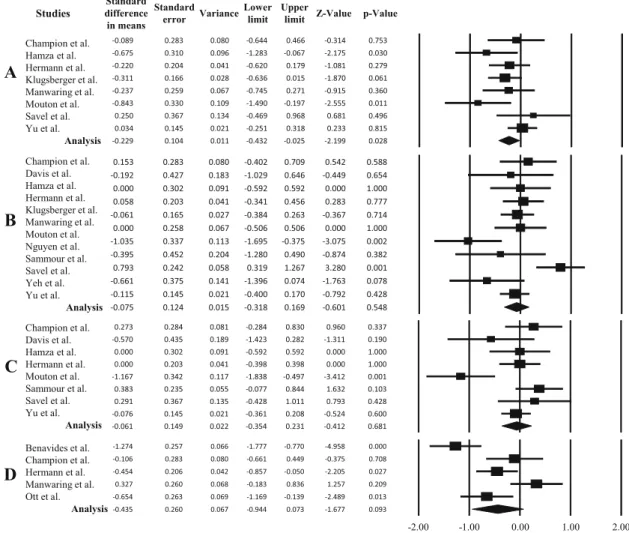
Fig. 2
Forest plot comparison for pain scores between standard
versus warmed and humidified gas for laparoscopy. a Immediate post
procedure, b post procedure day 1, c post procedure day 2 and
d
shoulder pain. The forest plot is made in favour of humidified and
heated CO
2
and presents the significance and the difference direction
of the analysed factor
14
Surg Endosc (2017) 31:13–16
B
Standard
difference
in means
Standard
error
Variance
Lower
limit
Upper
limit
Z-Value
p-Value
Studies
A
C
Benavides et al.
Champion et al.
Farley et al.
Hamza et al.
Hermann et al.
Manwaring et al.
Nguyen et al.
Sammour et al.
Savel et al.
Yu et al.
Analysis
Benavides et al.
Davis et al.
Hamza et al.
Hermann et al.
Sammour et al.
Savel et al.
Yu et al.
Analysis
Benavides et al.
Davis et al.
Hamza et al.
Hermann et al.
Sammour et al.
Savel et al.
Yu et al.
Analysis
-0.115 0.234 0.055 -0.574 0.345 -0.490 0.624
-0.460 0.287 0.082 -1.022 0.101 -1.606 0.108
0.036 0.246 0.061 -0.446 0.519 0.148 0.883
-1.110 0.324 0.105 -1.746 -0.475 -3.424 0.001
-0.140 0.203 0.041 -0.539 0.258 -0.690 0.490
-0.142 0.259 0.067 -0.648 0.365 -0.548 0.584
0.220 0.449 0.201 -0.660 1.099 0.490 0.624
0.087 0.233 0.054 -0.369 0.544 0.374 0.708
-0.392 0.369 0.136 -1.115 0.330 -1.064 0.287
0.107 0.145 0.021 -0.177 0.392 0.738 0.461
-0.150 0.105 0.011 -0.356 0.056 -1.431 0.152
-0.115 0.234 0.055 -0.575 0.344 -0.492 0.623
0.315 0.429 0.184 -0.526 1.156 0.735 0.462
-0.262 0.303 0.092 -0.856 0.332 -0.865 0.387
-0.079 0.203 0.041 -0.477 0.319 -0.388 0.698
-0.738 0.241 0.058 -1.210 -0.266 -3.067 0.002
-0.222 0.366 0.134 -0.939 0.496 -0.605 0.545
-0.047 0.145 0.021 -0.332 0.237 -0.327 0.743
-0.180 0.106 0.011 -0.387 0.028 -1.693 0.090
-0.152 0.235 0.055 -0.611 0.308 -0.646 0.518
0.399 0.431 0.185 -0.445 1.243 0.926 0.354
-0.396 0.305 0.093 -0.993 0.201 -1.299 0.194
0.000 0.203 0.041 -0.398 0.398 0.000 1.000
-0.259 0.234 0.055 -0.717 0.200 -1.107 0.268
-0.038 0.365 0.133 -0.754 0.677 -0.105 0.916
-0.080 0.145 0.021 -0.364 0.205 -0.550 0.582
-0.104 0.087 0.008 -0.274 0.067 -1.191 0.234
-2.00
-1.00
0.00
1.00
2.00
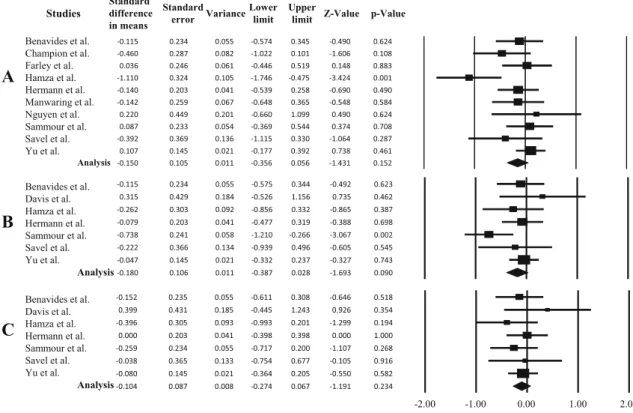
Fig. 3
Forest plot comparison for morphine equivalent daily dose
scores between standard versus warmed and humidified gas for
laparoscopy. a Immediate post procedure, b post procedure day 1 and
c
post procedure day 2. The forest plot is made in favour of
humidified and heated CO
2
and presents the significance and the
difference direction of the analysed factor
A
B
Standard
difference
in means
Standard
error
Variance
Lower
limit
Upper
limit
Z-Value
p-Value
Studies
0.000 0.246 0.061 -0.483 0.483 0.000 1.000
0.545 0.168 0.028 0.216 0.875 3.243 0.001
0.234 0.259 0.067 -0.274 0.742 0.903 0.366
0.333 0.233 0.054 -0.123 0.790 1.431 0.152
0.153 0.145 0.021 -0.131 0.438 1.056 0.291
0.272 0.095 0.009 0.086 0.458 2.864 0.004
Farley et al.
Klugsberger et al.
Manwaring et al.
Sammour et al.
Yu et al.
Analysis
-0.221 0.284 0.080 -0.777 0.335 -0.778 0.436
-0.167 0.247 0.061 -0.650 0.317 -0.676 0.499
4.745 0.589 0.347 3.590 5.899 8.056 0.000
-0.571 0.341 0.116 -1.239 0.096 -1.678 0.093
0.166 0.259 0.067 -0.340 0.673 0.644 0.520
-0.555 0.456 0.208 -1.448 0.339 -1.217 0.224
0.905 0.383 0.147 0.154 1.657 2.361 0.018
0.143 0.145 0.021 -0.142 0.428 0.983 0.325
0.440 0.335 0.112 -0.216 1.096 1.314 0.189
Champion et al.
Farley et al.
Hamza et al.
Kissler et al.
Manwaring et al.
Nguyen et al.
Savel et al.
Yu et al.
Analysis
-2.00
-1.00
0.00
1.00
2.00
Fig. 4
Forest plot comparison for body core temperature between
standard versus warmed and humidified gas for laparoscopy. a Per
procedure and b post procedure. The forest plot is made in favour of
humidified and heated CO
2
and presents the significance and the
difference direction of the analysed factor
Surg Endosc (2017) 31:13–16
15
A
B
Standard
difference
in means
Standard
error
Variance
Lower
limit
Upper
limit
Z-Value
p-Value
Studies
-0.286 0.235 0.055 -0.748 0.175 -1.215 0.224
0.205 0.284 0.080 -0.350 0.761 0.724 0.469
0.043 0.426 0.182 -0.793 0.879 0.101 0.919
-0.578 0.323 0.104 -1.211 0.054 -1.792 0.073
-0.276 0.247 0.061 -0.761 0.209 -1.115 0.265
-0.459 0.306 0.093 -1.058 0.141 -1.500 0.134
-0.032 0.258 0.067 -0.538 0.474 -0.124 0.902
-0.835 0.246 0.060 -1.316 -0.353 -3.396 0.001
0.170 0.145 0.021 -0.115 0.455 1.171 0.242
-0.216 0.129 0.017 -0.469 0.037 -1.676 0.094
Benavides et al.
Champion et al.
Davis et al.
Demco et al.
Farley et al.
Hamza et al.
Manwaring et al.
Ott et al.
Yu et al.
Analysis
Champion et al.
Davis et al.
Farley et al.
Hamza et al.
Mouton et al.
Nguyen et al.
Sammour et al.
Savel et al.
Yu et al.
Analysis
0.000 0.283 0.080 -0.554 0.554 0.000 1.000
0.000 0.426 0.182 -0.836 0.836 0.000 1.000
0.089 0.246 0.061 -0.394 0.572 0.362 0.717
0.000 0.302 0.091 -0.592 0.592 0.000 1.000
-0.109 0.316 0.100 -0.729 0.512 -0.343 0.731
0.329 0.450 0.203 -0.554 1.211 0.730 0.465
0.000 0.233 0.054 -0.456 0.456 0.000 1.000
-1.149 0.394 0.155 -1.921 -0.376 -2.915 0.004
0.000 0.145 0.021 -0.284 0.284 0.000 1.000
-0.047 0.096 0.009 -0.236 0.141 -0.493 0.622
-2.00
-1.00
0.00
1.00
2.00
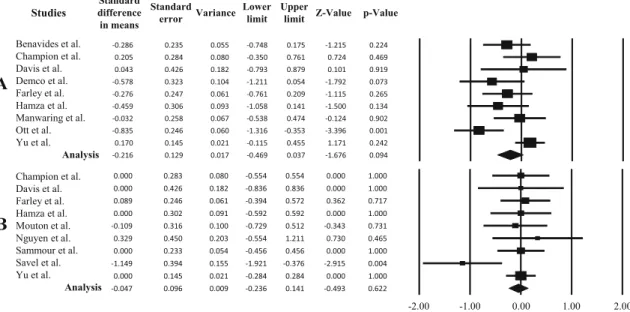
Fig. 5
Forest plot comparison for recovery room (a) and hospitalisation (b) duration between standard versus warmed and humidified gas for
laparoscopy. The forest plot is made in favour of humidified and heated CO
2
and presents the significance and the difference direction of the
analysed factor
A
B
Standard
difference
in means
Standard
error
Variance
Lower
limit
Upper
limit
Z-Value
p-Value
Studies
C
Benavides et al.
Champion et al.
Davis et al.
Demco et al.
Farley et al.
Hamza et al.
Kissler et al.
Klugsberger et al.
Manwaring et al.
Mouton et al.
Nguyen et al.
Ott et al.
Sammour et al.
Savel et al.
Yu et al.
Analysis
Champion et al.
Davis et al.
Farley et al.
Hamza et al.
Nguyen et al.
Sammour et al.
Savel et al.
Yu et al.
Analysis
0.008 0.234 0.055 -0.451 0.467 0.033 0.974
0.070 0.283 0.080 -0.485 0.624 0.247 0.805
0.144 0.427 0.182 -0.693 0.980 0.336 0.737
-0.043 0.246 0.061 -0.526 0.439 -0.176 0.860
-0.473 0.306 0.094 -1.073 0.127 -1.546 0.122
-0.130 0.334 0.112 -0.785 0.525 -0.388 0.698
0.109 0.316 0.100 -0.511 0.729 0.345 0.730
-0.563 0.456 0.208 -1.457 0.331 -1.234 0.217
-0.445 0.236 0.056 -0.907 0.017 -1.886 0.059
-0.158 0.145 0.021 -0.443 0.127 -1.087 0.277
-0.146 0.081 0.007 -0.305 0.013 -1.800 0.072
Benavides et al.
Champion et al.
Davis et al.
Farley et al.
Hamza et al.
Kissler et al.
Mouton et al.
Nguyen et al.
Sammour et al.
Yu et al.
Analysis
-0.176 0.235 0.055 -0.637 0.284 -0.752 0.452
0.000 0.283 0.080 -0.554 0.554 0.000 1.000
-0.008 0.426 0.182 -0.843 0.828 -0.018 0.986
1.448 0.355 0.126 0.752 2.144 4.076 0.000
0.000 0.246 0.061 -0.483 0.483 0.000 1.000
-0.321 0.304 0.092 -0.916 0.275 -1.056 0.291
0.649 0.343 0.117 -0.022 1.320 1.895 0.058
0.354 0.166 0.028 0.028 0.680 2.126 0.034
0.159 0.259 0.067 -0.347 0.666 0.617 0.537
0.156 0.317 0.100 -0.465 0.776 0.491 0.623
-0.040 0.447 0.200 -0.917 0.836 -0.090 0.928
-0.750 0.244 0.059 -1.228 -0.272 -3.076 0.002
-0.157 0.233 0.054 -0.614 0.300 -0.672 0.501
-0.941 0.385 0.148 -1.695 -0.187 -2.445 0.014
-0.059 0.145 0.021 -0.344 0.225 -0.410 0.682
0.013 0.121 0.015 -0.225 0.250 0.105 0.917
1.465 0.319 0.101 0.841 2.090 4.600 0.000
0.147 0.427 0.182 -0.690 0.983 0.343 0.731
-0.182 0.247 0.061 -0.666 0.301 -0.739 0.460
0.000 0.302 0.091 -0.592 0.592 0.000 1.000
0.000 0.447 0.200 -0.877 0.877 0.000 1.000
0.492 0.236 0.056 0.028 0.955 2.080 0.038
0.092 0.365 0.133 -0.624 0.808 0.252 0.801
0.170 0.145 0.021 -0.115 0.455 1.171 0.242
0.276 0.170 0.029 -0.058 0.610 1.621 0.105
-2.00
-1.00
0.00
1.00
2.00
Fig. 6
Forest plot comparison for procedure duration (a), lens fogging (b) and gas volume (c) duration between standard versus warmed and
humidified gas for laparoscopy. The forest plot is made in favour of humidified and heated CO
2
and presents the significance and the difference
direction of the analysed factor
16
Surg Endosc (2017) 31:13–16