Publisher’s version / Version de l'éditeur:
L'industria Italiana del Cemento, 76, 823, pp. 772-779, 2006-09-01
READ THESE TERMS AND CONDITIONS CAREFULLY BEFORE USING THIS WEBSITE. https://nrc-publications.canada.ca/eng/copyright
Vous avez des questions? Nous pouvons vous aider. Pour communiquer directement avec un auteur, consultez la première page de la revue dans laquelle son article a été publié afin de trouver ses coordonnées. Si vous n’arrivez pas à les repérer, communiquez avec nous à PublicationsArchive-ArchivesPublications@nrc-cnrc.gc.ca.
Questions? Contact the NRC Publications Archive team at
PublicationsArchive-ArchivesPublications@nrc-cnrc.gc.ca. If you wish to email the authors directly, please see the first page of the publication for their contact information.
NRC Publications Archive
Archives des publications du CNRC
This publication could be one of several versions: author’s original, accepted manuscript or the publisher’s version. / La version de cette publication peut être l’une des suivantes : la version prépublication de l’auteur, la version acceptée du manuscrit ou la version de l’éditeur.
Access and use of this website and the material on it are subject to the Terms and Conditions set forth at Investigation of endothermal doublets occurring in the thermal decomposition of Ca(OH)2
Ramachandran, V. S.; Sato, T.; Beaudoin, J. J.; Tumidajski, P. J.; Mitchell, L. D.
https://publications-cnrc.canada.ca/fra/droits
L’accès à ce site Web et l’utilisation de son contenu sont assujettis aux conditions présentées dans le site LISEZ CES CONDITIONS ATTENTIVEMENT AVANT D’UTILISER CE SITE WEB.
NRC Publications Record / Notice d'Archives des publications de CNRC:
https://nrc-publications.canada.ca/eng/view/object/?id=95870aee-213d-4567-af10-d1db958e68e9 https://publications-cnrc.canada.ca/fra/voir/objet/?id=95870aee-213d-4567-af10-d1db958e68e9
http://irc.nrc-cnrc.gc.ca
I nve st igat ion of e ndot he r m a l double t s
oc c ur ring in t he t he r m a l de c om posit ion
of Ca (OH )2
R a m a c h a n d r a n , V . S . ; S a t o , T . ; B e a u d o i n , J . J . ;
T u m i d a j s k i , P . J . ; M i t c h e l l , L . D .
N R C C - 4 9 2 1 3
A version of this document is published in / Une version de ce
document se trouve dans: L’industria Italiana del Cemento, No
823, Anno LXXVI, Sept. 2006, pp. 772-779
Investigation of Endothermal Doublets Occurring in the Thermal Decomposition of Ca(OH)2
V. S. Ramachandran*, T. Sato*, J. J. Beaudoin*, P. J. Tumidaski** and L. D. Mitchell*
* Institute for Research in Construction, National Research Council, Ottawa Canada, K1A 0R6
** Centre for Advanced Building Technologies, The City College, George Brown Toronto, Canada, M5T 2T9
ABSTRACT
The presence of at least two different forms of Ca(OH)2 is confirmed by the results of a
thermoanalytical study on the decomposition and re-hydration characteristics of Ca(OH)2.
The study comprised a series of differential scanning calorimetry (DSC) experiments (at temperatures up to 700°C) performed in an atmosphere of a continuous flow of nitrogen pre-conditioned to various relative humidities ranging from 12 to 100%. The emergence of two separate and distinct decomposition endotherms occurred. The endothermic peak temperatures were dependent on the relative humidity and temperature history of the Ca(OH)2 samples. Exposure of CaO to higher temperatures and different humidities
would appear to promote the formation of both crystalline and microcrystalline products. Under these conditions, higher temperatures give rise to formation of very crystalline products and after some time, vapor phase exposure promotes the formation of microcrystalline products. Factors affecting the formation of the different forms of Ca(OH)2 are described.
Introduction
The emergence of nanoscience applications in cement chemistry is likely to have a significant impact on the understanding of classical reactions that occur in the cement-water system [1]. Ca(OH)2, (cement chemistry notation, CH) is not only a reaction
product, but it is also an important reactant that can participate in many reactions relevant to the durability of cement-based products [2]. Development work involving the use of nano-particulate CH has the potential to tailor the formation of engineered C-S-H microstructures favorable to high performance.
Thermoanalytical methods for determining the extent of cement hydration have been utilized for decades [3]. The decomposition of CH has been the focus of many studies [4]. Generally a single endotherm (in the temperature range, 450-550°C) is detected by thermogravimetry (TG), differential thermal analysis (DTA), and differential scanning calorimetry (DSC) methods. Two thermal events associated with the decomposition of CH have, however, previously been observed. Greene observed these phenomena in studies of the hydration of Portland cement [5]. The low temperature peak was attributed to chemisorbed water on the surface of free lime particles. The typical 2nd peak was due to the decomposition of a more coarsely crystalline CH. Herrick et al. also observed two endothermal peaks in their DTA curves for hydrating expansive clinker pastes [6]. A metastable CH with cubic morphology was said to decompose at the lower temperature. The higher temperature peak was attributed to decomposition of hexagonal CH.
The authors have demonstrated that different forms of CH with varying degrees of crystallinity can be produced through vapor and liquid phase hydration of CaO [7]. The vapor phase hydrated CH generally showed a lower thermal decomposition temperature and lower degree of crystallinity than the liquid hydrated CH.
It is apparent that the application of analytical techniques to characterize the nature of reactions in systems containing cement-based nanomaterials may yield new spectral information and data interpretation. This paper focuses on the factors affecting the thermal decomposition of CH of nanoparticle range. Specifically the influence of the dehydration and re-hydration environment on the nature of the CH formed and the decomposition peak temperatures are investigated. Results of experiments on the decomposition of CH in pre-conditioned humidity environments (12-100% RH) are reported.
Thermal Decomposition and Crystallinity of CH
Previous work by the authors has demonstrated that the degree of crystallinity of CH is related to its decomposition temperature [7]. TG was conducted on CH formed by heating CaCO3 for 1 hour at 1050°C followed by hydration in liquid water for 7 days (referred to
as CH-6) or heating reagent grade CH for 1 hour at 600°C followed by vapor phase hydration at 11% RH (referred to as CH-1). Separate decomposition endotherms were observed in a derivative form of TG (DTG) for each sample with the vapor phase hydration product having the lowest endothermic peak temperature. Mixtures of the two samples exhibited doublets in the DTG spectra. The CH that gave the low temperature
endotherm had a significantly lower degree of crystallinity as determined by XRD analysis. Typical DTG curves for the CH mixtures are illustrated in Figure 1.
Experimental
The materials used in the work reported here are as follows: Materials
CH: The CH was produced by calcining reagent grade CaCO3 at 1050°C for 3 hours
followed by hydration in de-aerated liquid water for 24 hours. This material was used for all the experiments reported in this paper.
CaCO3: The reagent grade CaCO3 was supplied by Fisher Scientific. The BET surface
area was 2.6 m2/g.
Apparatus
DSC: A Dupont 1090 Thermal Analyzer was used in conjunction with a DSC cell. In each experiment 4 mg of sample was placed in a gold pan (sample holder).
A heating rate of 10°C/min with a nitrogen flow of 100 ml/min was used. The nitrogen was preconditioned at different values of RH (12-100%). The apparatus used to condition the nitrogen gas for delivery to the DSC cell is shown in Figure 2. The nitrogen is passed over a salt solution or water at a predetermined RH. This is followed by flow into a vessel equipped with an RH sensor to verify the RH of the carrier gas and through a flow meter into the DSC cell. In this work the RH value refers to room temperature equilibrium conditions. As the temperature in the DSC cell increases, the saturation vapor pressure increases as well. The effective RH would therefore be less.
Test Procedures
Series I: CH samples were heated in the DSC cell from room temperature to 600°C at 10°C/min with a nitrogen flow of 100 ml/min preconditioned at different values of RH (12, 38, 60, 80 and 100%). Five continuous heating and cooling (to 100°C) cycles were performed.
Series II: CH samples were subjected to heating/cooling cycles as for Series I with the exception that the samples were held isothermally for different times (1 min to 22 h) at 600°C before cooling. All experiments were performed with the preconditioned
environment at 100% RH.
Series III: CH samples were subjected to heating/cooling cycles as for Series II except that the isothermal temperature was 700°C. Isothermal time ranged from 1 to 60 min. All experiments were performed at 100% RH.
Results and Discussion
The results of the DSC experiments generally confirm the presence of two decomposition endotherms for the CH used in this study. The characteristics of the DSC curves are described for the various test conditions as follows:
Series I:
The effect of various RH environments on the decomposition of CH is represented by a single endotherm on the 1st heating as shown in Figure 3. As the RH increases, the CH decomposes at higher temperatures. It is apparent that the CH can decompose more readily in the lower RH environments as the onset of endotherm and peak temperatures are reduced..
The liquid hydrated CH decomposes to CaO, when the temperature increases from room temperature to 600°C. The CaO re-hydrates to form CH, when the temperature decreases from 600°C to 100°C on cooling. The DSC curves for the 4th heating (after 3 cycles of heating and cooling) in various RH environments are typical and are illustrated in Figure 4. The shift of the curves with the RH observed in Figure 3 is also seen in Figure 4. More energy is required to decompose the CH in the higher RH environments. More well-defined doublets also appear in these higher RH environments. This can be explained by examining the 3rd cooling and 4th heating curves for various RH environments shown in Figure 5. The DSC curves for the 38% RH and 100% RH environments are shown. The peaks on cooling and heating indicate the re-hydration and decomposition of the CH, respectively. The CaO starts re-hydrating at 285°C in the 100% RH environments whereas it only starts re-hydrating at 235°C in the 38% RH environment. As mentioned earlier, the RH values in this work refer to room temperature equilibrium conditions. The effective RH in the DSC cell constantly changes while the temperature decreases on cooling, that is, the CaO re-hydrates while the effective RH changes. The range of the effective RH variation with temperature in the 100% RH cell is much wider than the one in the 38% RH cell. The CaO therefore re-hydrates in the wider range of effective RH in the 100% RH cell than the 38% RH cell. This might be the reason for the more distinctive doublets in the 100% RH environment during decomposition in the 4th heating as
opposed to those produced in the 38% RH environment. Hydration of a sample produced in different RH environments would result in a difference in degree of crystallinity and therefore difference in a decomposition temperature. It has been shown by the authors that the surface area of CH has no significant influence on the decomposition
temperature[7].In this work it was demonstrated that ∆G, the change in Gibbs Free Energy, for the formation of CH by hydrating CaO is more negative as relative humidity increases (i.e. the thermodynamic driving force for the reaction increases).This is
consistent with the variation in decomposition temperature of CH observed in the DTG analysis. Further X-ray evidence (in the form of Williamson-Hall plots) also indicated
that the CH formed by hydration of CaO at low relative humidities was less ordered. It is also possible (in practice) that some cements which show dual peaks may have been
Series II:
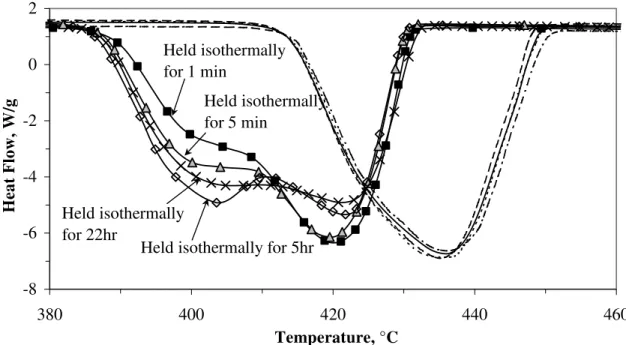
The effect of an isothermal hold after heating to 600°C followed by cooling to 100°C and reheating to 600°C in a 100% RH environment was investigated. The DSC results are plotted in Figure 6. The DSC curves for the 1st heating are shown to the right of the figure and illustrated by a single endotherm with a peak temperature occurring at about 435°C. To the left of the figure, the DSC curves for the 2nd heating are shown with much lower peak temperatures occurring than the 1st heating. The CH that decomposed on the 1st heating was initially hydrated in the liquid phase whereas the CH that decomposed on the 2nd heating was hydrated in the DSC cell on cooling, that is, the vapor phase. The
resulting difference in the decomposition temperature between the CH hydrated in the liquid and vapor phase was observed in the previous work by the authors [7]. The DSC curves for the 2nd heating also indicate the well-defined doublets appearing for the longer isothermal hold. All display two endothermic peaks- low temperature peaks at about 402°C and high temperature peaks at 420°C. The low temperature peaks increase in magnitude with a hold time up to about 5 hours with a slight decrease occurring at 22 hours. The CaO is calcined while holding isothermally at 600°C. Depending on the isothermal holding time, the nature of the CaO as well as the characteristics of the CH on re-hydration and subsequent decomposition are changed.
Series III:
The effect of a higher isothermal temperature (700°C) for a heating-cooling-reheating cycle on the thermal decomposition of CH was determined. The DSC curves for samples subjected to an isothermal hold (after initially heating CH to 700°C) followed by cooling to 100°C and reheating to 700°C in a 100% RH environment are presented in Figure 7. The DSC curves all exhibit two separate endotherms with peak temperatures at 402°C and 420°C. The magnitude of the smaller peak at 402°C decreased as the isothermal hold time at 700°C increased and nearly disappeared at a hold time of 60 min. The magnitude of the larger peak at 420°C decreased only slightly with hold time. It appears that the increased hold time at 700°C favors the formation of a more crystalline form of CH that decomposes at a higher temperature. The microcrystalline form of CH is inhibited from forming possibly due to the decreased reactivity of the CaO at the longer hold times. In this work, the term “microcrystalline” is used to denote the less ordered arrangement of atoms in the crystal structure. This effect is much more pronounced than that observed for Series II specimens where the CaO promoting formation of microcrystalline CH remained reactive for up to 24 hours.
Conclusions
1. Thermograms for the decomposition of CH indicate the presence of two distinct forms (reflected by two endotherms) when the decomposition and re-hydration process occurs in a controlled humidity and CO2 free environment.
2. The magnitude of both the low and high temperature endothermic peak heights is dependent on the relative humidity and temperature in the DSC test environment. 3. High humidity (in a DSC cell) promotes the hydration and decomposition of
4. Higher temperature is conducive to formation of a more crystalline CH product, while at the same time, vapor phase hydration promotes formation of a
microcrystalline product.
5. The relative magnitude of the low temperature endotherm (reflecting formation of microcrystalline CH) is sensitive to heating temperatures in excess of 600°C. 6. Previously observed doublets (in the temperature range generally associated with
the decomposition of CH) for DTA traces of hydrating cement systems can be explained in terms of the degree of crystallinity of the CH present (rather than the particle size or surface area effects).
7. When a cement or C3S exhibits dual peaks it is possible the exposure conditions
especially humidity cycles will determine the development of dual CH peaks.
Acknowledgment
The authors gratefully acknowledge the invaluable assistance of Mr. G. M. Polomark who conducted many of the experiments.
References
1. A. G. Kalinichev and R. J. Kirkpatrick, “Molecular dynamics modeling of chloride binding to the surfaces of hydroxide, hydrated aluminate and Ca-silicate phases,” Chem. of Materials, 14, 3539-3549 (2002).
2. F. P. Glasser, “ The role of Ca(OH)2 in Portland cement concretes,” Materials
Science of Concrete, Special Volume: Calcium Hydroxide in Concrete, Edited by J. Skalny, J. Gebauer, J. Odler, Amer. Ceram. Soc., Vol. 6, 37-58 (2001).
3. V. S. Ramachandran, “Applications of Differential Thermal Analysis in Cement Chemistry,” Chem. Pub. Co., N.Y. pp 308 (1969).
4. V.S. Ramachandran, R. M. Paroli, J. J. Beaudoin, and A. Delgado, “Handbook of Thermal Analysis of Construction Materials,“ William Andrew Pub. Norwich, N.Y., USA, pp680 (2003).
5. K. T. Greene, “Early hydration reactions of Portland cement,” Proc. Fourth Int. Symp. Chem. Cem., Vol. 1, Session IV, Paper IV-1, 359-374, Washington DC (1960); pub. As Nat. Bur. Stds. Monograph 43, Vol. I (1962).
6. J. Herrick, K. Scrivener, and P. Pratt, “The development of microstructure in calcium sulphoaluminate expansive cement,” Proc. Matls. Res. Soc. Vol. 245, 277-282 (1992).
7. T. Sato, J. J. Beaudoin, V.S. Ramachandran, L. Mitchell and P.J. Tumidajski, “Thermal decomposition of nanoparticulate Ca(OH)2 – Anomalous effects,”
igure 1 DTG curves for samples CH-1 and CH-6 and their mixtures with 0 0.5 1 1.5 2 2.5 3 3.5 4 4.5 5 250 300 350 400 450 500 Temperature, °C DTG, %/min Mixture: 0% of CH-1 and 100% of CH-6 Mixture: 20% of CH-1 and 80% of CH-6 Mixture: 50% of CH-1 and 50% of CH-6 Mixture: 80% of CH-1 and 20% of CH-6 Mixture: 100% of CH-1 and 0% of CH-6 CH-1: Formed by Hydration in Vapor Phase CH-6: Formed by Hydration in Liquid Phase
F
Nitrogen Gas Salt Water Solution with Magnetic Stirrer Measuring Vessel with RH Sensor Flow Meter DSC
Figure 2 The apparatus to condition the nitrogen gas for delivery to the DSC cell
-10 -8 -6 -4 -2 0 360 380 400 420 440 460 Temperature, °C Heat Flow, W/g 12% RH 38% RH 60% RH 80% RH 100% RH
-8 -6 -4 -2 0 320 340 360 380 400 420 440 Temperature, °C Heat Flow, W/g 12% RH 38% RH 60% RH 80% RH 100% RH
-8 -6 -4 -2 0 2 4 100 150 200 250 300 350 400 450 500 Temperature, °C Heat Flow, W/g 3rd Cooling 4th Heating 38% RH 100% RH
Figure 5 DSC curves for the 3rd cooling of CaO and 4th heating of CH in a 38% and 100% RH environment
-8 -6 -4 -2 0 2 380 400 420 440 460 Temperature, °C Heat Flow, W/g Held isothermally for 1 min
Held isothermally for 5hr Held isothermally
for 22hr
Held isothermally for 5 min
Figure 6 DSC curves for the 1st and 2nd heating of CH in 100% RH held isothermally at 600°C for various times
Figure 7 DSC curves for the 2nd heating of CH in 100% RH after holding isothermally at 700°C for various times
-8 -6 -4 -2 360 380 400 420 440 460 Temperature, °C Heat Flow, W/g 0 2 1 min 5 min 10 min 20 min 60 min