Assessment of the factors influencing PN emission in
a DISI engine under cold-start condition
by
Changhoon Oh
B.Sc., Korea Advanced Institute of Science and Technology (2008)
M.Sc., Korea Advanced Institute of Science and Technology (2010)
Submitted to the Department of Mechanical Engineering
in partial fulfillment of the requirements for the degree of
Doctor of Philosophy in Mechanical Engineering
MASS F4CHOLOGSIat the
SEP 13 2015
MASSACHUSETTS INSTITUTE OF TECHNOLOGY
LIBRARIES
September 2016
ARChIVES
Massachusetts Institute of Technology 2016. All rights reserved.
Author ....
Signature redacted
Department ot Mechanical Engineering
Aug 19, 2016
Certified by..
Signature redacted
/
Wai K. Cheng
e--
A
S i
Professor of Mechanical Engineering
ThesitSupervisor
inature redacted
A ccepted by ...
Rohan Abeyaratne
Professor of Mechanical Engineering Chairman, Department Committee
on Graduate Theses
Assessment of the factors influencing PN emission in a DISI
engine under cold-start condition
by
Changhoon Oh
Submitted to the Department of Mechanical Engineering on Aug 19, 2016, in partial fulfillment of the
requirements for the degree of
Doctor of Philosophy in Mechanical Engineering
Abstract
Due to their advantages in higher fuel efficiency and torque compared to conven-tional port fuel injection (PFI) engines, direct injection spark ignition (DISI) engines have become dominant in gasoline-fueled engines. However, DISI engines have a sig-nificant drawback in particulate matter (PM) emission: the PM emission of DISI engines is at least an order of magnitude higher than that of PFI engines. The ob-jective of this study is to investigate PM emission in DISI engines, mainly focusing on particulate number (PN) emission. The study aims to assess, respectively, the plausible PM formation mechanisms: non-fuel originated sources (e.g., lubricant), flame propagation in rich mixture and the pyrolysis of the vapor from liquid fuel film. Through a series of experiments, it has been found that non-fuel contribution is less important than the other two mechanisms. For all operating conditions, the absolute amount of the non-fuel contribution is much smaller than the total emission. In case of PM generated by flame propagation in rich mixture, there is a threshold air-fuel equivalence ratio below which PM starts to form rapidly. The threshold is influenced by the combustion temperature. PM starts to form at lower equivalence ratio when the combustion temperature was lower. Contrary to the PM generated from flame propagation in fuel-rich mixture case, that from the liquid fuel film is sup-pressed by lowering the combustion temperature. Transmission electron microscopy (TEM) imaging shows that the sizes of primary particles and agglomerated particles become larger as engine load increases, but particulates from different mechanisms have different morphology.
Thesis Supervisor: Wai K. Cheng
Acknowledgments
The work in this thesis would have not been possible without the support of a number of people.
First of all, I would like to thank my advisor, Professor Wai Cheng for all his guidance and patience for giving me the opportunity and freedom to carry out my own ideas in this research. I am also sincerely grateful to my doctoral committee, Professors John Heywood and William Green for their invaluable feedback and advice.
This research was supported by an industry Consortium on Engine and Fuels Re-search. I would like to extend my thanks to the members of the consortium for their critical advice and affection on my research. A special thanks to Richard Davis and Justin Ketterer from General Motors, Thomas Leone from Ford, David Roth from BorgWarner, In addition, I thank Samsung Foundation of Culture for their support over my research.
I would also like to thank the members of the Sloan Automotive Laboratory for their collaboration. I would like to especially express my gratitude to the lab-staffs, Thane DeWitt, Raymond Phan and Janet Maslow. Thank you also to my friends in Cam-bridge and Korea. Without my friends who were always with me whenever I was facing hardship, I would not be where I am today. I cannot express how grateful I am to them for everything they have done for me.
Finally, I have been incredibly fortunate to count with the unconditional support of my family. I cannot imagine that I could have initiated this adventure to a foreign country without their endless support.
Contents
1 Introduction 1.1 Background . . . . 1.2 Literature Review . . . . 1.2.1 PM emission legislation . . . . 1.2.2 PM measurement . . . .1.2.3 Characteristics of automotive PM emissions
1.2.4 PM emissions in DISI engines . . . .
1.2.5 Mitigation Strategy . . . .
1.3 Research objectives and approach . . . .
2 Experimental setup and methodology
2.1 Experimental setup . . . .
2.1.1 Base engine . . . .
2.1.2 Test fuel . . . .
2.1.3 Particulate measurement system . . . .
2.1.4 Transmission electron microscope (TEM) . .
2.2 Methodology . . . .
2.2.1 Selecting experimental conditions . . . .
2.2.2 Hardware modification . . . .
2.2.3 Sensors and auxiliary instruments . . . .
2.2.4 Experimental Procedures . . . .
3 Direct injection experiments
19 . . . 19 . . . 20 . . . 20 . . . 23 . . . 26 . . . 31 . . . 34 . . . 37 41 . . . . 41 . . . . 41 . . . . 43 . . . . 45 . . . . 48 . . . . 49 . . . . 49 . . . . 52 . . . . 54 . . . . 56 59
3.1 Experiments description . . . . 59
3.2 Experimental result . . . . 60
3.2.1 Influence of RPM, NIMEP on PN emission . . . . 60
3.2.2 Optimization of injection timing . . . . 66
3.2.3 Influence of the nitrogen dilution on PN emission . . . . 70
3.3 Findings . . . . 79
4 Premixed charge experiments 81 4.1 Experiments description . . . . 82
4.2 Experimental result . . . . 83
4.2.1 Background PN emission . . . . 83
4.2.2 Influence of RPM and NIMEP on PN emission from premixed m ixture . . . . 89
4.2.3 The accumulation mode PN emission from premixed, but fuel-rich charge experiments . . . . 94
4.3 Findings . . . . 101
5 Dual fuel experiments 103 5.1 Experiments description . . . . 104
5.2 Experimental result . . . . 105
5.2.1 Dual fuel combustion experiments . . . . 105
5.2.2 Late gasoline injection experiment . . . . 111
5.3 Findings . . . . 118
6 TEM imaging analysis 121 6.1 Experiments description . . . . 122 6.1.1 Sampling methods . . . . 122 6.1.2 Experimental apparatus . . . . 123 6.1.3 Sampling condition . . . . 124 6.2 Experimental result . . . . 126 6.2.1 Filter sampling . . . . 126
6.2.2 Direct sampling . . . . 128
6.3 Findings . . . . 136
7 Conclusion 139 7.1 Research overview. . . . . 139
7.2 Contribution on the PN emission reduction . . . . 142
7.3 Outlook . . . . 144
7.4 Closing remarks . . . . 145
8 Suggestions and preliminary works for future study 147 8.1 Experiment description . . . . 147
8.2 R esults . . . . 150
8.2.1 Steady state PN emission MAP . . . . 150
8.2.2 PN emission under transient operation . . . . 151
8.2.3 Conclusion . . . . 152
List of Figures
1-1. Mass and number weighted distributions of particulates in engine exhaust 27
1-2 Particulate formation mechanism . . . .
1-3 Conceptual diagram of the soot formation mechanisms . . . .
2-1 Schematic diagram of the test system (before modification) . . . . .
2-2 Schematic diagram of the DMS 500's dilution system [1] . . . .
2-3 Particle detection mechanism of DMS 500 [11 . . . .
2-4 User interface of the DMS 500 . . . .
2-5 User interface of the DMS 500 . . . .
2-6 Time-based PN emission pattern in FTP-75 cycle [2 . . . .
2-7 FTP-75 data from the vehicle (Ford Taurus) test . . . .
2-8 Experimental matrix . . . .
2-9 Schematic diagram of the intake and exhaust system. The original
setup (left) and modified setup (right) . . . .
2-10 Premixing chamber (before installation) . . . .
2-11 Schematic diagram of the fuel delivery system. The original setup (left) and modified setup (right) . . . . 2-12 Schematic diagram of the experimental setup and the sensor locations
2-13 Change in the accumulation mode PN emission during the cold idle
operation . . . .
2-14 Experimental procedure . . . .
3-1 3-2
Schematic diagram of the experimental apparatus . . . . fuel injection condition, cam timings and motoring pressure . . . .
28 39 43 45 46 46 48 50 50 51 52 53 53 56 57 58 60 61
3-3 Experimental conditions for the injection sweep experiment . . . . 62
3-4 PN emission as a function of SOI . . . . 62
3-5 Classification of fuel injection timing . . . . 63
3-6 PN spectrum for different SOI timings . . . . 64
3-7 Changes in PN emission as a function of SOI . . . . 65
3-8 Changes in particle mean diameter as a function of SOI . . . . 65
3-9 PN emission change as a function of SOI . . . . 67
3-10 Experimental conditions for finding the SOI optimization . . . . 67
3-11 Experimental conditions for finding the SOI optimization . . . . 68
3-12 Schematic diagram of fuel spray-piston interaction in low load operation 69 3-13 Schematic diagram of fuel spray-piston interaction in high load operation 70 3-14 Accumulation mode PN concentration for diluted mixture; at air to oxygen dilution ratio of 4:1 (16.7 % 02) . . . . . .. . . . . .. .. . 71
3-15 Normalized accumulation mode PN concentrations . . . . 71
3-16 Accumulation mode PN concentration for 1200 RPM) . . . . 72
3-17 Normalized accumulation mode PN concentrations . . . . 73
3-18 Effects of nitrogen dilution on soot formation . . . . 73
3-19 Accumulation mode PN concentration as a function of the oxygen mole fraction . . . . 74
3-20 PN spectrum as a function of the oxygen mole fraction at SOI = 60 CAD ATDC . . . . 75
3-21 Accumulation mode PN concentration as a function of the oxygen mole fraction . . . . 76
3-22 Accumulation mode PN concentration as a function of the oxygen mole fraction at RPM = 1200 . . . . 77
3-23 Accumulation mode PN concentration as a function of the oxygen mole fraction at RPM = 1800 . . . . 77
3-24 Accumulation mode PN concentration as a function of the oxygen mole fraction with various SOI timings at fast idle condition; 1200 RPM and 2 bar NIM EP . . . . 78
4-1 Schematic diagram of the experimental apparatus . . . . 82
4-2 Pressure traces for methane and hydrogen combustion . . . . 83
4-3 PN emission from hydrogen combustion . . . . 85
4-4 Dynamic detection range of DMS 500 . . . . 85
4-5 PN emission from ambient air and methane combustion . . . . 86
4-6 The accumulation mode from methane combustion (closed symbols) and motoring (filled symbols) . . . . 87
4-7 The accumulation PN concentration after shutting off . . . . 88
4-8 Experimental condition for premixed methane combustion . . . . 89
4-9 Accumulation mode PN emission from methane combustion . . . . . 89
4-10 Accumulation mode PN emission from methane combustion, divided by the engine load . . . . 90
4-11 PN spectrum for selected operating conditions . . . . 90
4-12 Experimental condition for premixed gasoline experiments . . . . 91
4-13 Accumulation mode PN emission from premixed gasoline combustion(symbols) and premixed methane(lines) . . . . 92
4-14 PN spectrum of premixed gasoline(closed symbols) and methane (open symbols) combustion for selected operating conditions . . . . 92
4-15 Comparison of accumulation mode PN emission depending on RPM, NIMEP and fuel delivery methods; methane(closed symbols), premixed gasoline(hollow symbols) and direct injection gasoline(half closed sym-bols) . . . . 93
4-16 PN emission as a function of lambda at 1200 RPM . . . . 95
4-17 Selected PN spectra at 1200 RPM . . . . 95
4-18 Soot Yield vs. Equivalence Ratio, [31 . . . . 96
4-19 Normalized accumulation mode PN concentrations . . . . 98
4-20 Normalized accumulation mode PN emission from methane combustion 99 4-21 Threshold lambda for different RPM and NIMEP . . . . 99
4-23 Threshold lambda for different dilution ratio at 1200 RPM . . . . 99
5-1 Schematic diagram of the experimental apparatus . . . . 104
5-2 Schematic diagram of the experimental apparatus . . . . 105
5-3 Experimental conditions for dual injection experiments . . . . 106
5-4 Accumulation mode PN concentration as a function of a liquid fuel
fraction;the disconnected symbols at liquid fuel fraction = 0 are data
from the pure methane experiments. . . . . 106
5-5 Accumulation mode PN concentration as a function of a liquid fuel
fraction(linear y scale) . . . . 107
5-6 PN spectrum as a function of the liquid fuel fraction . . . . 108 5-7 Accumulation mode PN concentration at 1200 RPM 8 bar with various
SOI tim ings . . . . 109 5-9 PN spectrum as a function of the liquid fuel fraction at different SOI
tim ing . . . . 109
5-8 Normalized accumulation mode PN concentration with various SOI
timings; 1200 RPM and 8 bar NIMEP . . . . 110 5-10 Accumulation mode PN at 1800 RPM 8 bar with various SOI timings 110 5-11 Schematic diagram for late gasoline injection experiment . . . . 111 5-12 The accumulation mode PN concentration with late fuel injection at 8
bar NIM EP . . . 113
5-13 PN spectrum with the liquid fuel fraction = 0.13 . . . . 114 5-14 A conceptual model of the soot formation process from liquid fuel film
on the piston top [41 . . . . 114
5-15 Accumulation mode PN emission as a function of methane lambda. . 115 5-16 Accumulation mode PN emission as a function of methane lambda. . 116
5-17 Accumulation mode PN emission as a function of methane lambda. . 117
6-1 Parameters used for characterizing particles [5] . . . . 122
6-2 Particle sampling devices . . . . 123
6-4 TEM images of filter sampled soot particles with 100k magnification
rate .. .... ... ... ... .. . . ... .126
6-5 TEM images of filter sampled soot particles with 300k magnification rate . . . . 127
6-6 HRTEM images of diesel particles and carbon black [6] . . . . 128
6-7 TEM grids for direct sampling . . . . 128
6-8 Particles from premixed methane and gasoline (2 bar NIMEP) with 25k magnification rate . . . . 129
6-9 Particles from hydrogen combustion (1200 RPM, 2 bar NIMEP, A = 2.5) with 25k magnification rate . . . . 130
6-10 Particles from premixed methane and gasoline (8 bar NIMEP) with 25k magnification rate . . . . 130
6-11 Particles from fuel-rich premixed gasoline combustion with 25k mag-nification rate . . . . 131
6-12 Particles from gasoline direct injection combustion (2 bar NIMEP) with 25k magnification rate . . . . 132
6-13 Particles from direct injection(8 bar NIMEP) with 25k magnification rate . . . . 133
6-14 TEM images of sampled soot particles at different injection timings,[5] 134 6-15 Particles from dual-fuel combustion at 1800 RPM and 8 bar NIMEP with 25k magnification rate . . . . 135
8-1 Schematic diagram of the experimental setup . . . . 148
8-2 Experimental condition . . . . 149
8-3 Transient operating condition . . . . 149
8-4 PN concentrations for steady state measurements; spark timing and SOI with stocked ECU calibration. . . . . 151
8-5 Mean diameter for steady state measurements . . . . 151
8-6 PN concentrations for transient operation . . . . 152
List of Tables
2.1 Test Engine Mechanical Specifications . . . . 42
2.2 Parked valve timing . . . . 42
2.3 Technical specification for the test fuel . . . . 44
2.4 Differences between sampling methods . . . . 49
2.5 Experimental conditions . . . . 51
3.1 Engine operating parameter . . . . 60
3.2 Optimum SOI timings (CAD ATDC intake) . . . . 68
3.3 Dilution ratios and corresponding oxygen mole fractions . . . . 74
4.1 Comparison between methane and hydrogen combustion . . . . 84
4.2 Peak pressure from methane combustion and motoring pressure . . . 87
4.3 Normalized accumulation mode PN emission of gasoline direct injection 94 5.1 Dilution ratios and required MAP for 8 bar NIMEP . . . . 112
5.2 Fuel injection parameters . . . . 113
5.3 Experimental conditions for lambda sweep experiments . . . . 115
Chapter 1
Introduction
1.1
Background
Internal combustion engines are widely used in transportation and power generation sectors due to their advantages in reliability and cost competitiveness. However, using internal combustion engines generates air pollution problems. Although there have been continuous improvements in emission abatement technology, emission from internal combustion engine powered vehicles, such as unburned hydrocarbons (HC), carbon dioxide (CO), nitrogen oxides (NOx) and particulate matter (PM), are still significant contributors of air pollution.
Compared to these pollutants, carbon dioxides (CO2) received less attention
un-til the late 20th century because they are not as hazardous as other pollutants to
humans. However, CO2 became one of the most important topics in transportation
sector after its impact on global warming was revealed. Reducing carbon dioxide emission requires an approach different from methods that treat other pollutants be-cause carbon dioxide is a product of complete combustion, while other pollutants are byproducts of combustion. Because of this difference, the solutions used for treat-ing other pollutants, such as chemical conversion and physical capturtreat-ing, cannot be
applied to the CO2 emission problem. It is hard to treat CO2 by using chemical
reactions because CO2 itself is a very stable product. Physical capture of CO2 is
than the other pollutants. A typical light duty vehicle generates approximately 150
- 300 grams of CO2 per km (distance traveled), while generating other pollutants in the order of few milligrams per km. Consequently, the only reasonable solution is to improve fuel efficiency, burning less fuel per distance traveled.
Continuous efforts to reduce CO2 emission from light-duty vehicles led to the
introduction of direct injection spark ignition (DISI) engine technology in the late 1990s. Unlike conventional port fuel injection (PFI) engines which mix fuel and air at the intake manifolds, fuel is directly injected into the cylinders in DISI engines. This difference provides DISI engines with better fuel economy and torque characteristics; injected fuel lowers the temperature of the mixture in the cylinder when it evaporates, leading a higher volumetric efficiency and better resistance to knock. Because of these advantages, DISI engines have been quickly replacing PFI engines over the past 20 years [7], especially for boosted engines. However, DISI engines have their drawback in PM emission. PM emission from DISI engine is substantially higher than that of PFI engines, especially when the engine is not fully warmed up [8, 91. Because both the fuel economy and emission regulations are strengthened each year, reducing the PM emission of DISI engines is necessary for automobile manufacturers. Although numerous studies have been conducted to reduce PM emission in DISI engines, many fundamental questions about the PM formation mechanism still remain unanswered due to the lack of understanding of PM formation processes.
1.2
Literature Review
The PM emission problem of DISI engines has been recognized and studied from the early stages of development. This chapter briefly summarizes previous work relevant to PM emission in DISI engines to situate the contribution of this thesis.
1.2.1
PM emission legislation
Since the harmful effects of soot (Carbonaceous PM) have been known to people for a long time, the history of PM regulations is longer than most people think. There was
a legislative record forbidding coal-burning in London written in the 13th century [10]. With respect to PM emission from internal combustion engines, emissions legislations began to appear in the 1960s [11].
In the amendments of Clean Air Act in 1970, the United States government
au-thorized the development of regulations to limit emissions from stationary (factories and power plants) and mobile(automobiles) sources. National Ambient Air Quality Standards (NAAQS) were established as a result. PM was selected as one of six
crite-ria pollutants monitored and controlled by NAAQS with CO, NO 2, sulfur dioxide(SO
2), HC and photochemical oxidants '. In the case of automotive PM emissions, the first regulation in 1970 was based on opacity, and concerned only heavy duty diesels [121. A more complicated diesel PM emission standard was established in 1980. This new regulation was firstly applied to passenger cars and light-duty trucks, and then expanded to heavy-duty engines and trucks in 1985 [10].
In Europe, the first PM regulation was legislated in 1989. This regulation controls the mass of diesel particulates that are collected during the test cycles (EC Directives
88/436/EEC, 91/441/EEC and 91/542/EEC) [13]. The PM emission level allowed by these regulations has become stricter due to elevated concerns about health and
environmental issues. Current regulations require much lower level of PM emission compared to those early regulations. For example, in European standards, the PM emission limit of light-duty diesel vehicles was 0. 14g/km for Euro 1 (legislated in 1992), but the current Euro 6 (legislated in 2014) requires PM emission of less than 0.005 g/km for the same category vehicles.
As the details of PM's harmful impact are uncovered, the interest has moved to smaller particulates. Clean Act Air 1970 regulates total particulate emission, in-cluding coarse particles. However, in 1987, Environmental Protection Agency (EPA) switched from regulating total particles to particulates that have a diameter of 10 pum
or smaller (PM10). Furthermore, epidemiological studies in the 1990s suggested that
regulations based on PM10 criterion are not effective enough since they cannot catch
'Chemical species produced by reactions between NOx and volatile organic compounds(VOCs). Ozone (03) is considered to be the most important
fine particles which can penetrate deep into human respiratory system.
In response to these findings, the EPA proposed the PM2.5 (particulates equal to
or less than 2.5 pm of diameter) standards in 1996. At first, several industrial groups and researchers claimed that there was no direct evidence that such fine particles
are adverse to human health, but various studies have shown that PM 2.5 and public
health are clearly related [14, 15]. In addition, several studies in the late 1990s
suggested that the response to particles from nontoxic materials correlates better with the particle surface area rather than its mass, suggesting that ultrafine particles
(diameters less than 0.1 pm) and nano particles (diameters less than 0.05 pm)2 are
more important to health effects[16, 17]. However, the extensive reviews done by
EPA in 2009 claimed that the PM2.5 definition still showed the best correlation with
to adverse health effects and PM exposure for both short-term and long-term cases
[18].
In the automotive industry, increased attention to ultrafine particles has brought another form of regulation-particulate numbers. Previous PM regulations were mostly mass-based regulations. (g/km for light-duty vehicles and g/kWh for heavy duty trucks). However, mass based regulations cannot catch ultrafine particle emissions since the mass contribution of particulates is relatively smaller than that of bigger par-ticles [19]. In order to solve this discrepancy, the Particulate Measurement Protocol (PMP), a research initiative supported by the United Nation's Economic
Commis-sion for Europe - Group of Experts on Pollution and Energy (UNECE-GRPE), was
launched in the 2000s [18]. With the effort of working groups on PMP, particulate number (PN) in the range of 23 to 2500 nm has been suggested as a complementary measurement method.
As a result, a PN regulation has been included with a conventional mass based PM regulation from the Euro 5b standard, which was legislated in 2011 and only regulated the PN emission from light duty diesel vehicles. However, Euro 6, the most recent regulation, endorsed a PN regulation that also limits PN for passenger cars equipped with DISI engines. The regulation limits the number of particulates per
2
km travelled 6x10"1 particles/km), and this limit is the same for both DISI engines and light duty diesel engines. For DISI engines, PN regulation is considered to be more challenging than mass based regulations. In fact, various studies have reported that many DISI engines emit more PNs than modern diesel engines equipped with particulate filters [9, 20, 21].
The United States has neither a PM regulation for SI engines, nor a plan to adopt
PN regulations yet. However, EPA tier III regulation requires a stricter mass limit
than European standards. In terms of state regulation, California is considering the introduction of a PN regulation with the PN limit based upon the assumption that
1 mg of PM emission per mile is equivalent to 101 (nonvolatile) particles/mile [18].
1.2.2
PM measurement
Dissimilar to other exhaust emissions, PM is neither physically nor chemically homo-geneous. Therefore, PM measuring methods have to be different from other pollutants measuring methods. When PM regulations were based on the mass of particulate with relatively loose limits, "measuring PM" itself was not a difficult task. First, PM from motor vehicle exhaust (light duty vehicles) or engine exhaust (heavy-duty diesels) was collected onto filters through a constant volume sampling (CVS) system. Then, the weight was measured after post-processing [22]. However, as regulations became stricter, and the focus moved to small-size particles, the development of reliable PM measuring technology has become an important issue. In 2007, EPA revealed that the PM measurement process may show different results depending on experimental conditions, such as dilution ratio at the tunnel, residence time and filter face velocity,
because these factors can generate differences in gas -particle partitioning during the
sampling process[23].
Counting particulates is even more difficult because particulates can be composed of different sets of chemical elements ranging in size from a few nanometers to a few micrometers. The official PMP protocol measures the number of solid (non-volatile)
particulates within the range of 23 nm - 2.5pm) by using an optics based method
num-ber of solid particulates only with a particles/km based limit. In this protocol, volatile fractions are removed by preheating samples to 300*C[201, and size distributions are not considered. Volatile fractions are omitted due to the repeatability issue; count-ing volatile particles is more challengcount-ing compared to countcount-ing solid particles since the measurement process is strongly depending on experimental conditions, such as dilution ratio or sampling positions. Therefore, further study is needed to legislate volatile particles [181.
Because the European standard is currently the only standard that has a PN limit, the CPC is the only device that has a legal standing. However, PN measurement
devices that have a wider range of detection - in terms of size limit, availability of
measuring volatile particles and time resolution - have been developed for research
purposes. Since the behavior of particles is mostly characterized by size rather than chemical compositions, most particle detection devices sort out particles depending on the their aerodynamic diameter. Various particle detection devices with different sampling systems and measuring principles are available, and each device has its own pros and cons. Generally speaking, in situ measurements are considered to be better than ex situ measurements, especially in transient conditions, but the former are less developed [10]. Sometimes more than two devices are simultaneously used to obtain more detailed results.
PN measuring devices can be categorized into a few groups depending on their
operating principles. Impactors, the most primitive type, use the inertial mobility of particles. Traditional impactors were able to offer only mass-based information, but electrical low-pressure impactors (ELPI) can offer the number distribution by measuring the electrical current caused by impacts. These impactor-type devices have an advantage in measuring time, but have a problem in detection ranges. Since they rely on inertial forces generated by particles, it is hard to detect very small particles. Originally, the lower limit was about 400 nm, far larger than particulates from modern engines. Although this was lowered to around 30 nm in modern ELPIs by lowering operating pressure, 30 nm limit is still not low enough to cover all particulates from automobile emissions. In addition, lowering operating pressure may cause problems
in measuring volatile particles due to evaporation [241.
Another type of detector uses electrical mobility of particles. Devices like the electrical aerosol analyzer (EAA), scanning mobility particle sizer (SMPS), differen-tial mobility particle sizer (DMPS) and differendifferen-tial mobility analyzer (DMA) belong to this category. These devices first electrically charge the particulates, and then sort out particles according to their electrical motilities by using electro-static forces. Compared to impactors, they can detect much smaller particles (up to 5nm) but may have some inaccuracy due to non-uniform charging of particles [24, 10]. SMPSs had been widely used in the automobile industry, but they are less frequently used now due to the fact that they can be used for steady-state experiments only. As tran-sient PN emission became more important, PN measurement devices that can offer real-time results are more commonly used today. The device that used in this thesis, Cambustion DMS 500 Mk II, also belongs to this type. Details of above are provided in Chapter 2.
Less commonly used than the methods mentioned, laser induced incandescence (LII) can be used for particle measurements. LII can offer high temporal resolutions and does not require a dilution system. However, this method heats up samples before measurement, and therefore may cause the evaporation of organic fractions or morphological changes of solid particles [25].
Since different instruments measure different properties of particulates, there are always discrepancies among the results. In addition, results from the same device with the same experimental conditions can be different depending on environmental conditions, such as humidity and the ambient temperature. In order to compensate for these inaccuracies, results from different type of devices can be used complementarily, but this requires careful attention when interpreting the data. Generally speaking, the official PMP protocol is considered to have the best reproducibility and repeatability,
sometimes even better than the conventional mass based method [26]. However,
the PMP protocol gives the least information: it gives only the number of particles collected over a size range during the entire test, and offers no information on size-spectra or changes in PN emission as a function of time.
1.2.3
Characteristics of automotive PM emissions
Classification of particulates
Due to the severe heterogeneity of PM, it is impossible to perfectly classify each particulate. Therefore, PMs are categorized into several groups depending on their sizes and chemical composition. Even this classification is often not clear, but gives some insights into the PM formation process occurring inside the cylinders.
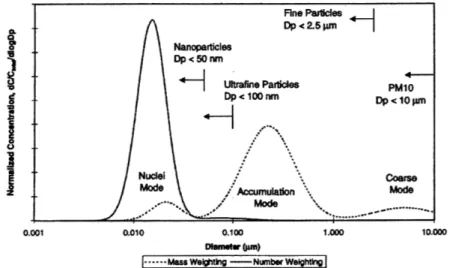
In terms of size, the PM from internal combustion engines can be categorized
into three groups: nucleation mode, accumulation mode and coarse mode [19]. These
modes encompass particles ranging from a few nanometers to several micrometers in diameter. It is reported that all three modes have log-normal distribution, but the peak and the shape of the each mode change significantly with operating conditions. Nucleation mode particles are formed from nucleated volatile fractions, and have the smallest sizes.Little things was known about nucleation mode particles until the late 1990s because it was hard to detect them. They are formed as the combustion process produced primary particles, which are solids at the exhaust condition, or as the nucleated particles from volatile hydrocarbon species as the charge cools down in the expansion and exhaust process. The latter particles are considered to be volatile. Accumulation mode particles are made of carbonaceous cores called spherules. Spherules have similar sizes regardless of operating conditions, ranging from 20 to 50 nm. However, the size of agglomerates, chunks of spherules, shows a wider deviation because the number of spherules contained in particles can vary from tens to thou-sands. Since this agglomerate absorbs liquid or semi-liquid material well due to its porous structure, the surface of an accumulation mode particle is usually coated with volatile or semi-volatile layers, while its back-bone is mainly carbonaceous.
Unlike nucleation mode or accumulation mode particles, coarse mode particles are not directly generated through the in-cylinder combustion process. Coarse mode particles are made of other particles through a process of storage and release in the downstream exhaust system, or through material disintegration. Therefore, coarse mode particles were not considered in this study, which focused on in-cylinder process
combustion.
Figures 1-1 shows a typical mass and number weighted distribution of each mode in
engine exhaust [191. As can be seen, nucleation mode particles are dominant in terms
of number, and accumulation mode particles are dominant in terms of mass, while coarse mode particles are insignificant in both cases. The distribution of nucleation mode particles is strongly affected by how the exhaust gas is treated due to the volatility of particles. Compared to nucleation mode particles, accumulation mode particulates are less likely to be affected by sampling conditions, and are therefore better for characterizing PM emissions from engines [10].
Fine Particles Dp<2.5prn Nanoparticles Dp <50 nm Ultrafine Particles PM10 Dp < 100 nrn Dp<10pm Nucli Coarse
Mode Accumulation Mode
/ Mode \
0.001 0.010 0,100 1,000 10.000
ameter (PM)
I- --- Mas Wetgthg - Number Weighting
Figure 1-1: Mass and number weighted distributions of particulates in engine exhaust
In terms of composition-wise classification, there are five categorizes: carbona-ceous (soot), ash, organic, sulphate and nitrate particulates. Carbonacarbona-ceous particu-lates and ash are insoluble, while the others are soluble to water. Ash is inorganic incombustible compounds. Most of these are metals (Fe, Cr, Cu, Zn, Ca) but a few of them contain non-metal elements (Si, P, S, Cl). The majority of sulphate and nitrate are sulphuric acid nitric acid dissolved into water vapor, but a small portion exists as metal-sulphates or metal-nitrates. Organic fraction encompasses major chemical families such as esters, aromatics and alcohols. Soot is mostly composed of carbon atoms with small amount of hydrogens.
Soot formation mechanism
Since a large portion of the PM from DISI engine is soot, this study mainly focused on soot emissions, rather than the other four groups of particulates. This section explains the fundamentals of the soot formation process inside of the cylinders. Simply speaking, soot is formed in flames through pyrolysis (thermolysis of organic compounds, such as fuel molecules, at high temperature and the absence of oxygen
atoms) [27]. Simplified diagram for the soot formation process is shown in Figures 1-2.
However, the details are much more complicated. Many questions remain unanswered. Therefore, researchers have used empirical relations expressed by global variables such as the mass fraction of fuel burned, combustion temperature, and values obtained from the heat release rate. Semi-empirical relations based on Arrhenius relationships are widely used as well [28].
Chemical process Physical process
Fuel molecules Precursors Nuclei Spherules Agglomerates Young par ticulates Mature par ticulates
Figure 1-2: Particulate formation mechanism
The difficulty in understanding the soot formation process comes from its com-plexity. Fuel molecules, with less than 30 carbon atoms with a hydrogen/carbon ratio around 2, are converted to spherules that contain more than thousands of
car-bon atoms with a negligible portion of hydrogen atoms within a few milliseconds of reaction time. More than hundreds of chemical relations are involved during the process. However, researchers have found that the soot formation process can be
divided into four stages: (1) inception, (2) surface growth, (3) agglomeration and (4) oxidation [29].
In the inception stage, fuel molecules are broken up by pyrolytic reactions. The broken molecules are then rearranged into precursor molecules, such as polycyclic
simple aromatic molecules like benzene through cyclisation reactions, and then con-tinue to grow using acetylenes as feedstock. Since carbons are added and hydrogens are removed during the reactions, this process is called the hydrogen abstraction and carbon addition (HACA) process, and the formed particles are called nuclei. The relative concentration of aromatic molecules and acetylene molecules determines the reaction pathway in the HACA process. If the concentration of acetylene is much higher than that of aromatics, PAH grows by the addition of acetylene molecules. Conversely, PAH is more likely to grow by the condensation of existing aromatic molecules if aromatics are abundant [301. Nuclei have a mean diameter of one or two nanometers, composed of approximately fifty carbon atoms. The number of nuclei generated in this stage determines the initial number of soot particles.
Once enough nuclei are formed, additional particles start to attached nuclei, mov-ing to the surface growth stage. It is hard to determine the exact transition from the inception stage to the surface growth stage. Detecting transition even depends on the measurement methods used to detect the formation of nuclei. However, it is known that the zones where inception and surface growth occur are different in the flame [31]. Through the surface growth stage, the mass of soot is greatly increased, while the total number of soot particles remains almost constant. Particles generated
in this process are called spherules. Spherules grow up to a mean diameter of 20
-50 nm. Outer layer of spherules, formed during the surface growth stage, has layered
micro-structures. In contrast, cores formed during the inception stage have amor-phous shape. It is not known whether the inception stage or the surface growth stage that determines the final amounts (number of particles) of soot. However, in terms of mass, it is generally accepted the most of soot is generated during the surface growth stage[29].
The maximum size of spherules has been observed to a few tens of nanometers, regardless of conditions. Beyond this limit, spherules start to grow by adhering to each other. This growth process is called agglomeration. Unlike the previous two stages, which are chemical processes, the agglomeration process is a physical process. In the agglomeration stage, the number of particles decreases while the entire mass
is conserved. The underlying physics of agglomeration is relatively well known and extensively modeled, compared to other stages. Revised Smoluchowski equations are generally used to explain the number decreases in agglomeration stages. The age of the spherules is an important factor in the agglomeration stage. Solidified (mature) spherules exhibit point contacts, while viscid (young) spherules are more likely to be fused together. The final morphology of particulates is determined during the agglomeration stage. A point contact between particles generates a chain-like structure, while fusing forms a clustered particle [32].
Although all of these three stages are chained events, they are not completely separated in time. At some points, the inception process competes with the surface growth process for soot precursors, and the agglomeration process sometimes occurs between very young spherules that are still possible by the surface growth.
The oxidation stage, on the other hand, is a soot removing process. Like the previ-ous three stages of soot production, the oxidation process can happen simultaneprevi-ously with other processes in the flame. This nature generates difficulties in experimentally separating soot formation and soot oxidation because the chain of soot production events can be terminated at any stage. In general, more than 90 % of soot formed through combustion is oxidized by the combustion process. There are several species
involved in this process such as 02, 0, OH, H, CO2 and H20 [331. In the case of
engine combustion, the peak concentration of OH radical correlates well to the onset of soot depletion [34]. However, the dominant oxidants can be different depending on spatial and temporal aspects of abundance. In terms of time, soot particles are
initially attacked by OH radicals. H20 and CO2 start to play a role after OH radicals
have been consumed, while the later part of the oxidation process is governed by 02
molecules. Spatially, exposure of soot particles to OH is limited to the narrow region of the flame. Outside of the flame, 02 is more important due to its abundance [33]. Similar to the soot production process, semi-empirical equations based on Arrhenius form are widely used to model soot oxidation, such as Nagle and Strickland-Constable model [351. In general, the oxidation of spherules is considered to be kinetically con-trolled [361, but physical aspects, such as mixing of air and soot or movement of the
soot cloud, can be important depending on operating conditions [371. This means that the oxidation process can be either kinetically controlled or mixing-controlled, limiting the regimes where each model can apply.
1.2.4
PM emissions in DISI engines
As discussed in Section 1.2.1, gasoline engines had been exempted from PM regula-tions. In terms of mass, PM emission from conventional PFI engines is approximately
1% of that from diesel engines. However, the situation changed after gasoline engines
adopted a direct injection technology. Several studies have shown that the amount of PM generated from early DISI engines is closer to that from diesel engines, rather than that from PFI engines.
The main difference between DISI engines and PFI engines with respect to soot formation comes from the air-fuel mixture preparation process. By directly injecting fuel into the combustion chamber, DISI engines can enjoy the "charge cooling effect", resulting in improved fuel economy and torque compared to PFI engines. However, this diesel-like mixture preparation process generates more favoring conditions for
soot generation. Since DISI engines have a significantly reduced time for air-fuel
mixing, they are more likely to have locally rich region where soot is generated [381. PM formation is greatly affected by engine operating parameters. An overall air/fuel ratio may have an impact on PM emission since incomplete fuel conversion in fuel-rich conditions may cause severe soot formation. However, many studies have shown that soot formation is more closely related to the injection timing rather than the overall air/fuel ratio since the injection timing directly affects the mixing process of the fuel and air. In [39, 401, PM emission greatly varied as injection timing changes, while there were much smaller deviations as a function of overall air/fuel ratio around the stoichiometric condition. Generally, retarding the injection timing increases PM emission because reduced mixing time results in less homogeneous charge at the mo-ment of ignition. On the other hand, if the fuel injection timing is too early, PM emission increases as well due to the piston or valve wetting. Since a very small deviation in injection timing can cause wall impingement or inhomogeneous mixture
preparation, the optimization of injection timing is essential for PM reduction. In terms of mixture formation methods, a spray guided method has less PM emission, especially in terms of number, than a wall guided method because it has less chance of wall or valve impingement. A study done by Price et al.[41] showed that the spray guided system has much smaller peaks in accumulation mode PN emissions, but has slightly higher nucleation mode PN emission compared to the wall guided system. This opposite trend in accumulation mode and nucleation mode PN emissions can be observed in the same hardware. The work of Pei et al.[421 found that advancing the fuel injection timing reduces the total PN emission. The nucleation mode particles were slightly increased by advancing the fuel injection timing, but the increase was compensated for significantly reduced accumulation mode particles.
Combustion phasing is another factor that determines the soot formation. If all other conditions are the same, retarding the ignition timing tends to decrease PM emissions. This trend applies for both homogeneous and stratified charge operation. Both the number and mean diameter of particles simultaneously decrease as the spark timing retards [41, 421. The underlying mechanism is not clear, but one possible explanation is that the higher exhaust temperature can promote the oxidation of particulates. However, retarding combustion phasing deteriorates fuel efficiency when the 50% of mass fraction burned is prolonged more than than 6-7 CAD from MBT
timing [391.
This thesis specifically focuses on PM emission under cold-start condition where PM emission is the highest. Similar to other gaseous emissions such as HC and CO, the majority of the tailpipe PM emission comes under cold-start condition. A vehicle test with a new European drive cycle (NEDC) showed that the highest PN emission occurs within the first 100 seconds of the test [8J.
Under cold-start condition, an in-cylinder environment offers an unfavorable con-dition for fuel vaporization, causing significant variations in the flame growth and fuel spray structures[43]. Through the optical engine and single cylinder engine test, Xu et al.[44] found that the formation of a robust rich fuel-air mixture around the spark plug is the key for lower cyclic variation and more stable combustion, while
vaporization of fuel could be improved by injection optimization.
The fact that fuel is directly injected into the cylinder makes another PM
forma-tion mechanism in DISI engines - liquid fuel film. For PFI engines, the formation
in-cyliner liquid fuel film is minimized with the aid of backflow. Backflow facilitates the evaporation of liquid fuel film by distributing the fuel film in the intake port and valve region to a large surface area in the intake manifold. However, in DISI engines, in-cyliner liquid fuel film is more likely to form since liquid fuel spray is directly injected into the combustion chamber [45]. This problem becomes worse un-der cold-start condition because fuel is less likely to evaporate. Stevens and Steeper investigated the role of liquid fuel film on soot formation [46]. They characterized the combustion of liquid fuel film at the piston top, referred to pool-fire via direct imaging. If fuel film exists on the piston-top during the combustion of the premixed charge, it ignites to create piston-top pool-fire. With a laser scattering experiment, it was found that soot is produced by the pool fire, and this soot can survive and throughout the exhaust stroke. This means that pool fire is a potential source of PM emission in DISI engines. A further study performed by a research group at Karlsruhe Institute of Technology [47] reconfirmed that the pool fire is the main cause of soot formation in the homogeneous charge operation, while soot is both formed in local rich mixture regions of combustion chamber and on the piston due to pool fire.
Ketterer and Cheng [4] suggested a more detailed explanation for this pool-fire. They argued that the heat conduction from the burned gases and heat release from reactions occurred at the rich-mixture region, located above the liquid film on the piston, sustain soot formation in this region during expansion stroke Radiation from the particles in this region appears as the pool-fire although there is no traditional "fire" since there is not sufficient oxygen available. Mainly focused on hydrocarbon emission, but Contanzo and Heywood [48] offer insight into the nature of fuel film as well. When the other conditions are the same, hydrocarbon emission always increased if liquid fuel films exist in the combustion chamber. Furthermore, it was also found that the wall temperature is a governing factor when differences in the amount of liquid fuel actually on the combustion chamber surfaces are accounted for, implying
that the contribution of liquid fuel film could be more significant under cold-start condition.
It is not considered as significantly as other mechanisms, but coking of fuel can be another reason for PM emission in DISI engines. Carbon deposits can form at the tip of the injectors in DISI engines because the tip of the fuel injector is always exposed to flame. During the fuel injection process, fuel vapor is stored at this porous deposit. Then, stored fuel vapor is subsequently released and combusted in the injector diffusion flame, becoming soot [491.
Although PFI engines are exempted from PM regulations due to their low emis-sion level, this does not mean that PFI engines are completely free from PM emisemis-sion issues. Several studies indicated that PFI engines showed much smaller PN during steady-state operation compared to diesels engines, but can emit an increased fraction of nano particles depending on operation conditions. A stable baseline PN
concen-tration is an order of 105 particles/cc for PFI engines, however, spikes in PN are
frequently observed during engine operations. These spikes can have more than 100 times higher PN concentration compared to the baseline. This is mainly due to the increased fraction of volatile particles less than 30 nm of mean diameter. In addition, it is also observed that PN concentration significantly increased when engines were
operated under high-load, transient or cold-start condition [7]. The Euro 6 regulation
requires a limit of 6 x 10¹¹ particles/km as determined by PMP.
1.2.5
Mitigation Strategy
Efforts to reduce PM emission in DISI engines have been directed at soot fractions. Roughly speaking, the mitigation strategies can be divided by two categories. The first one aims to minimize soot formation inside of the combustion chamber, and the second one focuses on oxidizing soot in the exhaust system. Particle filtration systems as exhaust gas treatment are also being developed.
As discussed above 1.2.4, the fuel injection process strongly influences the mixture formation, determining the homogeneity of the mixture and the presence of liquid fuel droplets and films. Various advanced injection methods such as post injection
or multi-pulse injection have been suggested to reduce soot formation. Under cold-start condition, an injection strategy which improves the combustion stability can effectively reduce soot formation as well [9]. Optimizing fuel pressure is especially important at low coolant temperature. Excessively low injection pressure results in the poor atomization of fuel, and excessively high pressure causes increased wall or piston impingement. Additional improvement can be achieved by changing the injector geometry, such as varying the spray angle or the number of holes.
In addition to the fuel injection process, the optimization of the air intake process can improve air-fuel mixing and flame front propagation as well. Many studies proved that optimizing valve overlap combined with exhaust gas recirculation (EGR) can reduce PM emission [39, 50]. Hedge et al.[51] showed that high EGR levels with the 1.6L DISI engine reduced both PM mass and number in a variety of operating conditions; brake specific soot mass was reduced by at least 60% for all cases, and
PN was reduced by 40% or more in most operating conditions. Both the external
and internal EGR method have been tested, and it was found that internal EGR was more effective for PM reduction compared to external EGR in light load, low speed conditions. However, external EGR can be to used to reduce PM emissions when the engine is operated with non-optimal operating conditions, such as fuel-rich condition under the transient operation[51J.
Because PM emission is much higher under cold-start condition than warmed up phases, any methods that accelerate the warming up process of engines or reduce the light-off time of the three-way catalyst system can contribute to reduction of PM emission. Retarding spark timing is one simple way to quickly warm up the engine, but it can only be used for cold-idle condition because retarding the spark timing deteriorates fuel economy of vehicles. In addition, as much of the enthalpy is dissipated into the exhaust, it takes longer time to heat up the combustion chamber. Since fuel droplets contact with the cold combustion chamber walls cannot evaporate sell, and fuel vapor can condense back into liquid, retarding spark timing may lead a high PM emission during cold-start condition [8]. Instead, heating up fuel or intake air can be used as alternative methods to warm up the engine, but the additional
energy required for heating up the engine should be accounted for a fair comparison. Like other emissions, aftertreatment systems can be used to reduce PM emissions. Secondary air injection (SAI) is a method that provides additional air to the exhaust stream under fuel-rich operating condition, enabling post oxidation of the exhaust gas prior to the catalyst. Lee and Heywood [52] found that SAI can reduce significant amounts of PM and the light-off time of the catalyst. The feed gas of secondary oxidation is CO and HC, but the oxidation of feed gases offers radicals that can oxidize PM in the exhaust stream. The amount of PM reduced (in terms of volume) was proportional to the amount of heat release in the secondary oxidation [53].
Like diesel engine particulate filters(DPF), gasoline particulate filters (GPF) are being researched as well. In principle, modern DPF can be used for gasoline engines as well. However, due to smaller particles from DISI engines compared to those from Diesel engines, GPF requires a finer filter characteristics in terms of cell density and mean pore sizes, leading to a higher back pressure that may cause a stronger negative impact on vehicle performance and fuel consumption [9]. Several GPFs have been developed and demonstrated their performance [54]. Compared to a conventional
DPF, a GPF has difficulty in achieving a stable regeneration in the filter because
of the difference between operational conditions of gasoline and diesel engines. The temperature of exhaust gas is too low to burn up stacked particles in low load and lean operation, while there is insufficient amount of oxygen in exhaust gas in high load and stoichiometric conditions. In order to solve this problem, the development
of catalysts that can exploit H20 and CO2 as oxidants is being researched [55]. In any
case, adding an aftertreatment system is a less favorable option for automotive makers because it inevitably increases the manufacturing cost of the power-train system.
Outside of the hardware perspective, PM reduction via changing fuel formulation is being researched as well. Similar to diesel combustion, several studies have reported that gasoline with oxygenate compounds, such as alcohol or ether, generates less PM [54, 2]. Another benefit that can be obtained from oxygenate blending is better knock resistance, which enables a higher compression ratio because most oxygenate compounds, such as methanol or ethanol, have higher research octane number (RON)
values compared to regular gasolines. Therefore, blending oxygenates boosts the fuel's octane rating, offering a better knock margin for engine operations. However, the fuel economy might be deteriorated due to the lower heating value (LHV) of oxygenates. For example, ethanol, the most commonly used oxygenate compound in US, has a much higher RON value than gasoline (107 vs 92-98), but its LHV is only 61% of
that of gasoline (26.9 MJ/kg vs 44.0 MJ/kg) [36].
Because it is known that the physical and chemical properties of gasoline have an impact on PM emissions, various models have been developed to correlate PM emission and fuel properties or compositions. Honda's PM index model[56] is based on a weight fraction, vapor pressure, and a double bond equivalent (DBE) value of each component in the fuels. This model showed that low vapor pressure species are related to PM emissions, due to their combustion behavior. In terms of component, aromatic compounds with a high boiling point and a high DBE value have stronger impacts on PM emission than low DBE components such as paraffins. With a single-cylinder optical spray guided DISI engine experiment, Leach et al.[57 modified this PM index, making the PN index. PN index encompasses the change of DBE and vapor pressure of fuel mix by using Raoult's law and the universal functional activity coefficient (UNIFAC) method.
1.3
Research objectives and approach
This study is a part of the bigger project which has been performed at the Sloan Automotive Laboratory at the Massachusetts Institute of Technology to understand and reduce the emission problems in DISI engines, especially under the cold-start condition.
This thesis is intended to investigate the in-cylinder soot formation process in DISI engines under the cold-start condition. Here, 'cold-start condition' refers the engine operating conditions where coolant temperature is low (around 25 'C), while other engine components are under thermal equilibrium, and maintaining steady state temperature during the experiments. Therefore, the term 'cold-start condition' in
this thesis is different from 'cranking-start condition' which means all the engine components are as cold as ambient temperature before the start of operation, and then warms up as firing proceeds.
The main difficulty of understanding soot formation comes from the nature of combustion. Several factors simultaneously contribute to soot formation, but it is very hard to control each factor independently because most of them are coupled. Therefore, most of previous studies were qualitative, leaving various contributing factors coupled. However, this study aims to analyze various possible soot formation mechanisms independently by performing a series of experiments that are designed to decouple various factors.
Decoupling all the physical and chemical factors will really require various opti-cal diagnostics and simulations, which needs significant amount of capital and time. Instead, the study tries to focus on the fundamentals and include features such as the capability to run with pre-vaporized and fully homogeneous to help decouple the fundamental effects like sensitivity to gas phase enrichment, combustion or flame temperature, influence or oil, a role of liquid fuel films on soot formation.
Three primary mechanisms chosen for this study are (1) soot generated from non-fuel sources (e.g. lubricants), (2) flame propagation in locally rich mixture, and (3) the pyrolysis of fuel-rich vapor liquid fuel film on the piston top. These mechanisms are selected from the basic principle that "soot is formed via pyrolysis", which means that soot is generated under the absence of oxygen with elevated temperature. Figure
1-3 shows the conceptual diagram of three mechanisms.
Before investigating each mechanism individually, the general trend of PN emis-sion was investigated with various operating parameters with a conventional direct injection system in Chapter 3.
The first and second mechanisms was studied in Chapter 4. Since both mech-anisms assume soot formation under the absence of liquid fuel film, fully premixed charge experiments were performed. Low C/H ratio premixed gaseous fuel was used to investigate the first mechanism, while premixed fuel-rich gasoline was used for the second. In Chapter 5, the role of liquid fuel film on soot formation was addressed with