Publisher’s version / Version de l'éditeur:
Journal of Chromatography B, 879, 1, pp. 61-68, 2011-01-01
READ THESE TERMS AND CONDITIONS CAREFULLY BEFORE USING THIS WEBSITE. https://nrc-publications.canada.ca/eng/copyright
Vous avez des questions? Nous pouvons vous aider. Pour communiquer directement avec un auteur, consultez la
première page de la revue dans laquelle son article a été publié afin de trouver ses coordonnées. Si vous n’arrivez pas à les repérer, communiquez avec nous à PublicationsArchive-ArchivesPublications@nrc-cnrc.gc.ca.
Questions? Contact the NRC Publications Archive team at
PublicationsArchive-ArchivesPublications@nrc-cnrc.gc.ca. If you wish to email the authors directly, please see the first page of the publication for their contact information.
NRC Publications Archive
Archives des publications du CNRC
This publication could be one of several versions: author’s original, accepted manuscript or the publisher’s version. / La version de cette publication peut être l’une des suivantes : la version prépublication de l’auteur, la version acceptée du manuscrit ou la version de l’éditeur.
For the publisher’s version, please access the DOI link below./ Pour consulter la version de l’éditeur, utilisez le lien DOI ci-dessous.
https://doi.org/10.1016/j.jchromb.2010.11.011
Access and use of this website and the material on it are subject to the Terms and Conditions set forth at
Development and validation of a HPLC method for the quantification of
baculovirus particles
Transfiguracion, Julia; Mena, Jimmy A.; Aucoin, Marc G.; Kamen, Amine A.
https://publications-cnrc.canada.ca/fra/droits
L’accès à ce site Web et l’utilisation de son contenu sont assujettis aux conditions présentées dans le site LISEZ CES CONDITIONS ATTENTIVEMENT AVANT D’UTILISER CE SITE WEB.
NRC Publications Record / Notice d'Archives des publications de CNRC:
https://nrc-publications.canada.ca/eng/view/object/?id=b0bd7562-494c-4518-bcd4-ef48f0593528
https://publications-cnrc.canada.ca/fra/voir/objet/?id=b0bd7562-494c-4518-bcd4-ef48f0593528
Contents lists available atScienceDirect
Journal of Chromatography B
j o u r n a l h o m e p a g e :w w w . e l s e v i e r . c o m / l o c a t e / c h r o m b
Development and validation of a HPLC method for the quantification of
baculovirus particles
Julia Transfiguracion
a, Jimmy A. Mena
a, Marc G. Aucoin
b, Amine A. Kamen
a,∗aAnimal Cell Technology Group, Bioprocess Center, Biotechnology Research Institute, National Research Council Canada, 6100 Royalmount Avenue, Montreal,
Quebec, Canada H4P 2R2
bDepartment of Chemical Engineering, University of Waterloo, Waterloo, Ontario, Canada
a r t i c l e
i n f o
Article history:
Received 18 August 2010 Accepted 8 November 2010 Available online 13 November 2010 Keywords:
Baculovirus HPLC Quantification Total virus particle Viral genome labeling
a b s t r a c t
A HPLC method using an anion exchange column was developed for the quantification of baculovirus particles. To properly detect the virus eluting from the column, a nucleic acid dye was used to amplify the signal projected by the virus. The viral genome was labeled by incubating the virus with SYBR Green I at 37◦C for a minimum of 1 h. The virus was specifically eluted from the contaminants in 8.9 min at a NaCl
concentration of 480 mM NaCl (in 20 mM Tris–HCl, pH 7.5). The total run time of the method was 25 min. The method resulted in a linear response from 1 × 10⁸to 5.0 × 10¹⁰viral particles (VP/ml). The detection
limit was 3.0 × 10⁷and the quantification limit was 1 × 10⁸VP/ml. The intra-assay precision was <10%
for both purified and crude virus preparations whereas the inter-assay precisions were <5% and <10% for purified and crude virus preparations, respectively. The recovery/accuracy of the method ranged from 78 to 101%. This method is a robust monitoring tool to facilitate research activities with baculovirus vector and accelerate development of baculovirus-based processes for manufacturing of biologics.
Crown Copyright © 2010 Published by Elsevier B.V. All rights reserved.
1. Introduction
The commercial use of the baculovirus (BV) expression vec-tor system in the manufacture of human vaccines[1,2]and the exploitation of BV as benign non-replicative vectors for gene expression in mammalian cells[3–5] has generated a renewed interest in the technology. This technology is not without its chal-lenges. For example, the amount of BV added to the process can drastically affect the production capacity of the system as well as the overall complexity of the process. For this reason, a great deal of effort has been put into investigating the effect of the multiplic-ity of infection on the production[6–10]as well as into methods to purify[11–13]concentrate[14,15]and quantify[16]these viral vectors.
There is no shortage of methods to quantify BV, each of which has its own merits and drawbacks. Many techniques, though tried and true, involve lengthy procedures and are hampered by opera-tor subjectivity, such as for infectivity and plaque assays. Recently, a critical evaluation of the errors associated with the quantification of BV maintains that the current state of the art in quantification protocols is one that contains methods that can reduce time and effort, or increase accuracy and dependency, but lacks an overar-ching method that is optimal in all aspects[16].
∗ Corresponding author. Tel.: +1 514 496 2264; fax: +1 514 496 6785. E-mail address:amine.kamen@cnrc-nrc.gc.ca(A.A. Kamen).
Real-time quantitative PCR has been pushed to the forefront as a method for quantification because of how rapidly results can be generated compared to most other methods, not to mention the ability to detect minute quantities of nucleic acid. The need to choose primer sequences, probes, master mixes and reaction condi-tions creates a wide design space, which is not easily optimized for the inexperienced. Furthermore, methods used to isolate BV DNA prior to quantification can influence the reported titers. Most real-time PCR protocols rely on the use of standard material, for which none is commercially available or at a reasonable cost; therefore, the titers are subject to the errors associated with the methods of isolation and purification of the standard material.
For close to a decade now, we have been using a labeling tech-nique that allows the quantification of BV using a flow cytometer. This method has been shown to be a rapid and robust method for not only quantifying the virus[17]but also for a qualitative assess-ment of the viral stock[18]. Similar to many real-time PCR methods, the protocol reported by Shen et al.[17]uses the SYBR Green dye to label the viral DNA; however, unlike other methods, the virus/viral genome is not extracted from the sample to do the analysis. It is believed that this allows less loss due to any processing steps. Unfortunately, the accessibility to a high resolution flow cytometer able to detect virus particles is not necessarily commonly available, a reason we believe this method has not been more widely adopted. Although standardization is often warranted in the quantifica-tion of particles, especially for lab to lab comparisons, it is more often crucial to have a reliable method that allows quick and
repro-1570-0232/$ – see front matter. Crown Copyright © 2010 Published by Elsevier B.V. All rights reserved. doi:10.1016/j.jchromb.2010.11.011
62 J. Transfiguracion et al. / J. Chromatogr. B 879 (2011) 61–68
ducible results for everyday testing. Given the increased interest in baculoviruses[19]as well as our experience in purifying[12,20,21]
and quantifying viruses[22–25]using chromatography, we have investigated the quantification of BV using high performance liquid chromatography (HPLC). BV has already been shown to be cap-tured from solution using both anion and cation exchange materials
[11,13,26], however, the use of HPLC for the quantification of BV has not been explored. This may be due to the low absorbance sig-nals associated with baculovirus when monitoring the eluent at 260 and 280 nm. SYBR Green dye is commonly used for PCR and gel electrophoresis to detect low levels of nucleic acids in bio-logical samples, and has been used for the detection of BV using flow cytometry[17]. We therefore investigated the possibility of combining the labeling power of this dye with the separation capa-bilities of ion exchange chromatography.
Herewith we describe a method that rivals RT-PCR and DNA-labeling/flow cytometry protocols in terms of response time, and rivals RT-PCR in ease of establishing conditions for the quantifi-cation of the particles. Furthermore, reagents used in the HPLC method are less expensive than the reagents used in RT-PCR, and other than the addition of a labeling dye there is little preparation of the samples needed.
2. Materials and methods
2.1. Cells, medium and virus production
Spodoptera frugiperda (Sf9) cells and Sf900II culture medium (Invitrogen, Burlington, ON, Canada) were used for the produc-tion of virus using a 3L Chemap CF-3000 bioreactor (Mannedorf, Switzerland) as previously described [12]. Briefly, exponentially growing Sf9 cells were seeded into the bioreactor at 0.5 × 10⁶per ml
and grown to a density of about 1 × 10⁶cells per ml prior to
infec-tion with a BV stock at an MOI of 0.1 pfu/cell. The virus supernatant was recovered at 72 h post-infection (hpi) by centrifuging the cul-ture broth for 15 min at 2600 × g and decanting the supernatant from the pelleted material.
A BV harboring a gene for GFP under the control of both a CMV and p10 promoter, first described in the production of adeno-associated viral vectors in insect cells[27]was the primary BV used in this work.
2.2. Preparation of a standard
A 100× BV standard was prepared in house by ultracen-trifugation using a 25% sucrose cushion according to a method previously described for the purification of vesicular stomatitis virus G glycoprotein-pseudotyped retrovectors[20]. Briefly, culture supernatant containing budded BV, clarified using a 0.8/0.45 m double membrane filter (Supor®, Pall Life Sciences, Ann Arbor, MI,
USA), was placed above a 25% sucrose cushion and ultracentrifuged at 37,000 × g for 3 h at 4◦C (A621 Sorvall rotor, Thermo Scientific,
Waltham, MA, USA). The recovered virus pellet was suspended in 20 mM Tris–HCl, pH 7.5 + 5% sucrose and kept at 4◦C overnight.
The virus suspension was then filtered through a 0.45 m Supor®
membrane (Pall Life Sciences, Ann Arbor, MI, USA), aliquoted in 300 l volume and stored at −80◦C. The BV used as the standard
was selected because of its ability to transduce both insect and mammalian cells.
2.3. Characterization of the standard
2.3.1. Total viral particle quantification
The total viral particle concentration (VP/ml) was obtained using a flow cytometer (FCM) as previously described[17]. Flow-SetTM Fluorospheres (Beckman Coulter Inc., Fullerton, CA, USA)
with a mean diameter of 3.6 m, and having emission wavelengths between 525 and 700 nm when excited at a wavelength of 488 nm, were used as an external standard to calibrate the quantification.
2.3.2. Infectious particle quantification
The plaque-forming unit concentration (pfu/ml) was deter-mined using an end point dilution assay as previously described
[28]. Briefly, Sf9 cells were seeded at 0.1 × 10⁶cells per ml in wells
of a 96 well plate and infected with serially diluted stocks of BV. The plates were incubated for 6 days at 27◦C. The MTT assay was used
to determine BV infectivity. Magenta formazan salt (MTT degrada-tion by product) was solubilized by DMSO (Sigma–Aldrich, Oakville, ON, Canada) and its absorbance was detected using a Spectra 340 PC spectrophotometer equipped with Softmax Pro 4.8 (Molecular Devices, Sunnyvale, CA, USA). Uninfected cells were used as control.
2.3.3. Viral genome quantification
The viral genome concentration (VG/ml) was determined by real-time PCR using previously described primers based on a sequence within the GP64 gene[29]and commercially available DNA extraction kits (High Pure Viral Nucleic Acid Kit, Roche, Missis-sauga, ON, Canada). The plasmid DNA which served as the standard was prepared by inserting the baculovirus PCR amplified sequence in pAcSG2 (BD Pharmingen, San Diego, CA, USA), which was prop-agated in DH5␣, purified using the GeneJETTM Plasmid Miniprep
Kit (Fermentas Life Sciences, Burlington, ON, Canada) and quan-tified using a Nanodrop measure. The standard had a measure of 114.6 ng/l DNA.
2.3.4. Light scattering characterization
Multiple angle dynamic and static light scattering (DLS and SLS) experiments on the BV standard were conducted using a BI-200 SM Goniometer (Brookhaven Instruments Corporation, NY, USA). Necessary sample dilutions were done with sterile PBS.
2.3.5. SDS-PAGE and western blot analysis
Samples were analyzed by SDS-PAGE (NuPAGE, BT 4-12% gels, Invitrogen, Burlington, ON, Canada) and silver staining (SilverXpress® Kit, Invitrogen, Burlington, ON, Canada) was
per-formed on the protein bands. Western blotting was perper-formed using a monoclonal antibody against the gp64 envelope protein (eBiosciences, San Diego, CA, USA). Bands were detected using the Amersham ECL PlusTMwestern blotting detection system (GE
Healthcare, Baie D’Urfe, QC, Canada).
2.4. Quantification using HPLC
2.4.1. Sample preparation—nucleic acid labeling with SYBR®
Green I
A 200× working solution (WS) of SYBR® Green I nucleic acid
gel stain (Invitrogen, Burlington, ON, Canada), herein referred to as SGI, was prepared by diluting the stock (10,000×) in 10 mM Tris–HCl, 1 mM EDTA, pH 7.5. To label the DNA in the samples, SGI WS was added to the samples to get a final concentration of 2×, and incubated at 37◦C in the dark. Prior to labeling, all samples were
fil-tered through a 0.45 m membrane (Supor®, Pall Life Sciences, Ann
Arbor, MI, USA). For all experiments performed during the method development, the standard was always diluted to 1 × 10¹⁰VP/ml in
20 mM Tris–HCl, pH 7.5 and all preliminary works were performed using SGI at a concentration of 1× unless otherwise specified.
Temperature effect. The temperatures investigated were 4◦C,
25◦C (room temperature), and 37◦C. The two samples investigated
were the standard and a cell culture supernatant containing BV. Both types of samples were labeled with 1× SGI for 1 h at one of the three temperatures investigated before being injected to the column.
Effect of SYBR Green I concentration on labeling. To determine if the SGI concentration had an effect on labeling, the standard was incubated with SGI at concentrations between 1× and 5× SGI (all for the same period of 1 h). As a control, a sample having the same concentration of BV was incubated without SGI.
Effect of Triton X-100 membrane permeabilization. Three concen-trations of Triton X-100 were investigated: 0.001%, 0.005% and 0.01%. A supernatant without Triton X-100 but labeled with SGI was also analyzed as a control. To label the BV, the Triton X-100 was added to the supernatant samples followed by SGI (2×). The samples were then incubated for 1 h at either 4◦C, 25◦C or 37◦C.
2.4.2. HPLC system
An Alliance HPLC system (Waters, Ltd., Milford, MA, USA) equipped with a 2695 separations unit, a 996 photodiode array (PDA) detector, a 2475 fluorescence detector, and the EmpowerTM2
chromatography software for data acquisition and peak integra-tion, was used in this work. The column used to isolate the BV was a 0.16 ml UNOQTManion exchange polishing column (Biorad,
Her-cules, CA, USA). The mobile phase stock solutions consisted of: (A) 0.1 M Tris–HCl, pH 7.5; (B) 2 M NaCl in Milli Q® purified water;
(C) Milli Q® purified water. All solutions were filtered through a
0.45 m HA membrane (Millipore, Billerica, MA, USA) and degassed for 10 min prior to use.
2.4.3. HPLC analysis
The flow rate was kept at 1 ml/min for all analysis and all gra-dients were formed in 20% A. All samples were filtered through a 0.45 m membrane (Supor®, Pall Life Sciences, Ann Arbor, MI, USA)
prior to injection. The column was equilibrated with 20% A, 16.5% B and 63.5% C for 10 min before a 50 l sample was injected. Three (3) buffer blanks (20 mM Tris–HCl, pH 7.5) were injected prior to the first sample injection of the day to ensure a flat baseline and elimi-nate any carryover from previous runs. After the sample injection, the column was washed with 16.5% B for 6 min followed by a linear gradient from 16.5% to 24% B at a rate of 75 mM NaCl/ml. B was kept at 24% for 4 min for the complete elution of the virus. This was followed by another linear gradient increasing B from 24% to 50% at a rate of 173 mM NaCl/ml. B was kept at 50% for 3 min before being reduced to 16.5% in 3 min. For each subsequent run the column was equilibrated for only 4 min prior to the sample injection.
2.4.4. Eluent monitoring
The fluorescence intensity of the output stream from the column was monitored at the excitation and emission wavelengths of 479 and 520 nm, respectively. The excitation and emission wavelength pair was chosen because it yields the highest signal when SGI is used to label nucleic acids. The output stream was also monitored for absorbance at 260 and 280 nm, allowing the additional detection of proteins and DNA.
2.5. Method validation
2.5.1. Specificity
The specificity of the method was determined by spiking known concentrations of BV into Tris buffer blanks or non-infected Sf9 cell culture supernatant and examining the chromatograms for potential overlapping peaks. As controls, a buffer blank and a non-infected Sf9 cell culture supernatant, without any addition of BV, were also analyzed. To confirm the identity of the baculovirus peak, 100× labeled BV was injected 5 consecutive times at a volume of 150 l into the HPLC under the conditions described above. The BV peak was collected, concentrated by a Savant SpeedVac (Thermo Scientific, Two Rivers, WI, USA) and analyzed by SDS-PAGE and western blot as described above.
2.5.2. Linearity, limit of detection and limit of quantification Linearity of the assay was determined by multiple injections (between 2 and 6) of seven BV concentrations (1 × 10⁷, 5 × 10⁷,
1 × 10⁸, 5 × 10⁸, 1 × 10⁹, 5 × 10⁹, 1 × 10¹⁰ and 5 × 10¹⁰VP/ml).
Briefly, the BV standard was labeled with 2× SGI for 2 h and then diluted in Tris–HCl buffer to obtain the aforementioned concen-trations. Two (2) buffer blanks were injected between the 5 × 10⁸,
1 × 10⁹, 5 × 10⁹, 1 × 10¹⁰and 5 × 10¹⁰VP/ml samples to avoid any
potential BV carryover. Two (2) additional single injections hav-ing concentrations of 7 × 10⁷and 3 × 10⁸VP/ml supplemented the
above data points. The limit of detection was visually determined while the quantification limit was deemed to be the lower limit of linearity.
2.5.3. Precision
The precision of the method was determined by analyzing five (5) repeat injections of BV supernatant and the standard (diluted 1/5 in Tris–HCl buffer) over 5 days. Samples were incubated with 2× SGI for 2 h at 37◦C prior to the analysis. The relative standard
deviation (RSD) for the 5 repeat injections and the RSD of the mean values over the 5 days were the basis of the intra- and inter-assay precision.
2.5.4. Accuracy
The accuracy of the method was determined by spiking an infected cell culture supernatant containing BV with known con-centrations of BV and comparing the increase in peak area with the expected increase calculated from the linear working range of the calibration curve.
3. Results and discussion
3.1. Standard characterization
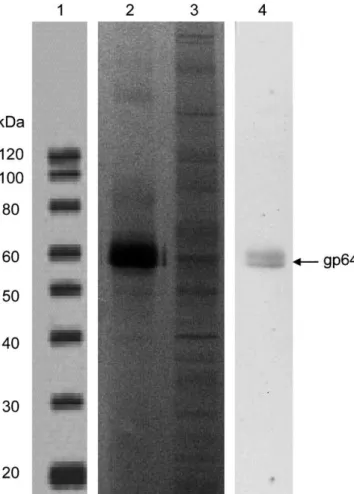
The standard was characterized upon concentration and purifi-cation. The relative purity of the standard compared to the starting material (cell culture supernatant) is shown by SDS-PAGE (Fig. 1). The standard material was shown to be of high purity with the gp64 envelope protein (identified based on the apparent MW) com-prising >90% of the total detected proteins. The majority of protein contaminants were removed in this preparation compared to the supernatant. To confirm the identity of BV, western blot against gp64 was performed. The gp64 band was clearly detected in the standard (Fig. 1, lane 4).
End-point dilution of the standard gave a titer of 1.17 × 10¹⁰±4.28 × 10⁹PFU/ml. Flow cytometry gave a titer
of 7 × 10¹⁰±5.076 × 10⁹VP/ml. Real-time PCR gave a titer of
4.05 × 10¹¹±2.11 × 10¹¹VG/ml. Standard deviations were
cal-culated from the average of multiple sets of triplicates done on different days.
The standard had a hydrodynamic radius (Rh) of ca. 82 nm, and
a radius of gyration (Rg) of 194.6 ± 10.1 nm. DLS/SLS measurements
yielded a Rg/Rhvalue around 2.4, which confirms the presence of
rod-shaped particles.
3.2. Detection and identification of BV using HPLC
To elute the SGI-labeled BV standard, a linear gradient from 0 to 1 M NaCl in 20 mM Tris–HCl (pH 7.5) at a rate of 50 mM/ml was used. This elution profile gave three (3) distinct peaks (Fig. 2A). The first peak (indicated as 1) eluted at ∼163 mM NaCl, the sec-ond peak (indicated as 2) eluted at ∼480 mM NaCl while the third peak (indicated as 3) eluted at ∼700 mM NaCl. The 260/280 nm absorbance ratios of these peaks were 2.2, 1.2 and 2.1 respectively. The absorbance ratios of peak 1 and 3 are indicative of a significant amount of nucleic acids. Peak 2 however, is close to an absorbance
64 J. Transfiguracion et al. / J. Chromatogr. B 879 (2011) 61–68
Fig. 1. SDS-PAGE and western blot analyses of BV standard purified by ultracen-trifugation in 25% sucrose cushion and culture supernatant containing BV. Lanes 1, 2 and 3 are the SDS-PAGE profiles of the protein molecular weight (MW) marker, BV standard and supernatant, respectively. Lane 4 is the gp64 western blot of the standard. SDS-PAGE was performed using NuPAGE, BT 4–12% gels and silver stain-ing. Both samples were loaded at the same protein concentration of 1 g/well. The dilution of gp64 Ab for the western blot was 1/500 followed by overnight incubation whereas for the HRP Ab was 1/2000 followed by 1 h incubation.
ratio reported for virus. For example, purified adenovirus vectors have a 260/280 absorbance ratio between 1.29 and 1.35[30]. Con-sequently, peak 2 was identified as BV.
3.3. Protocol development and optimization
3.3.1. BV peak separation
The same linear method was used to analyze a culture super-natant containing BV. However, resolution was very poor causing adjacent peaks to overlap with the BV peak (data not shown). The method was therefore modified to resolve the BV peak in culture supernatant samples. This was accomplished by using a combina-tion of step and linear gradients. By using an initial step gradient of 16.5% B, the contaminants that were overlapping the BV peak were completely eluted from the column before the start of a lin-ear gradient prior to the elution of the BV from the column. The linear gradient consisted of increasing the % B from 16.5 to 24 at a rate of 75 mM NaCl/min. The labeled standard was fractionated using the modified elution profile that resulted in three (3) well resolved peaks (Fig. 2B, solid line). The BV peak eluted in ∼8.9 min at a salt concentration of ∼480 mM (NaCl). The identity of the BV peak was confirmed by gp64 western blot (Fig. 2D). The third peak, which was later identified to be residual DNA based on the anal-ysis of a lambda double stranded (ds) DNA (Fig. 1B, dotted lines), eluted in ∼14.1 min. BV supernatant labeled under the same
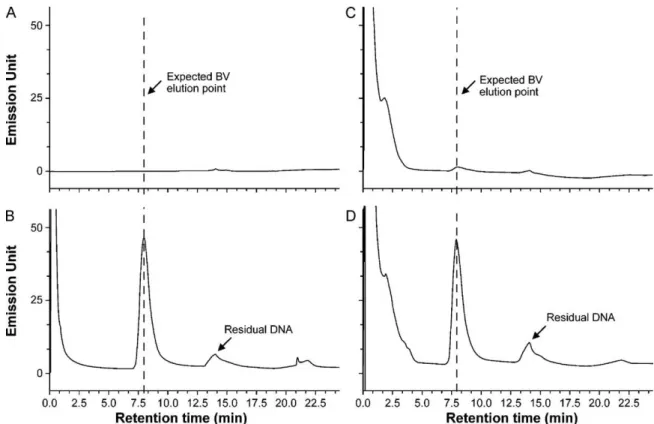
con-Fig. 2. Fluorescence monitoring of eluent from an anion exchange column and iden-tification of BV. DNA viral genome labeling was performed with 1× SYBR Green I for 5 min at room temperature in the dark while separation was performed on a UNOQ polishing column (0.16 ml). The wavelengths used were 479 and 520 nm for the excitation and emission, respectively. The BV peak was indicated by an arrow. (A) Linear gradient at 50 mM/ml NaCl in 20 mM Tris–HCl, pH 7.5 at a flow rate of 1 ml/min. (B) Optimized separation of BV peak (solid line) from the contaminants. Broken lines show the profile of a lambda double stranded DNA std. BV eluted in 8.9 min at 480 mM NaCl, while residual DNA elutes at ∼15 min at ∼700 mM NaCl. (C) Separation of BV in the cell culture supernatant under optimized conditions of separation. (D) gp64 western blot analyses of BV peak. Lane 1: BV standard. Lane 2: BV peak.
ditions as the standard, and analyzed using the modified method, also showed three (3) well resolved peaks (Fig. 2C).
3.3.2. Labeling efficiency and evaluation of critical operating parameters
In preliminary experiments, labeling kinetics and stability of dye-genome complex were assessed for both the standard and a cell culture supernatant containing BV. Both the standard and supernatant achieved greater than 90% of their maximum peak area within 2 h. The maximum peak area for both the standard and supernatant was reached by 3 h. The peak area for the standard was stable for 7 h with a maximum relative standard deviation of 9%, compared to the average peak area for that same time. All peak areas observed from the analysis of the infected culture supernatant were within 8% of the average over a10 h incubation period.
To further improve the labeling conditions and establish the limits of operation the effect of incubation temperature, SGI con-centration and Triton X-100 membrane permeabilization were evaluated.
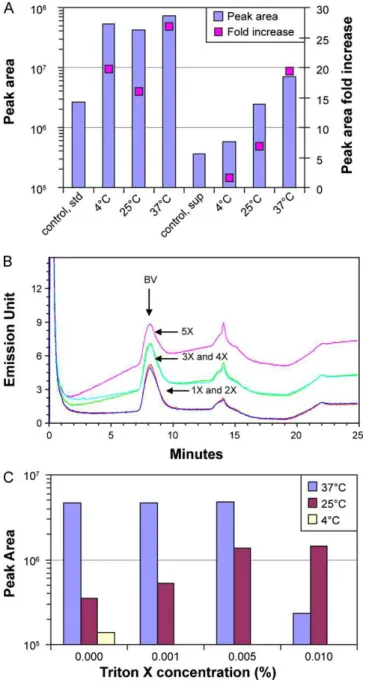
Fig. 3. (A) Effect of different incubation temperatures on labeling. BV standard and supernatant were incubated with 1× SYBR Green I for 1 h at 4◦C, 25◦C and 37◦C.
Con-trol is the same sample as those described but without incubation with SYBR Green I. All three temperatures were suitable for labeling the standard with no difference in the peak area obtained while 37◦C was the most efficient labeling temperature for
the crude BV. (B) Effect of SYBR Green I concentration on BV detection. The standard was labeled with 1×–5× SYBR Green I for 1 h in the dark at 37◦
C. No difference in the peak area was observed. The main difference was the shift in baseline as the SYBR Green I concentration was increased. (C) Effect of membrane permeabilization with Triton X-100. BV supernatant was permeabilized with 0.001%, 0.005% and 0.01% of Triton X-100 for 1 h at 37◦C, 25◦C and 4◦C and labeled with 1× SYBR Green I for
1 h. Control sample (0.00%) was the same supernatant but with no Triton X-100. Permeabilization with 0.001% and 0.005% at 37◦
C showed the same BV peak area as the control, while 0.01% resulted in a significant decrease in the BV peak area. Permeabilization at 25◦C and 4◦C with all three concentrations of Triton X-100 did
not improve the BV detection compared to 37◦C incubation.
3.3.3. Incubation temperature
The benefit of SGI labeling at different temperatures was eval-uated as the fold increase in the BV peak area after the addition of SGI. The fold increases from labeling the standard were 20, 16 and 27 for the 4◦C, 25◦C and 37◦C incubation temperatures,
respec-tively (Fig. 3A, left panel). The fold increases obtained from adding SGI to the supernatant containing BV were 2, 17 and 19 for the
4◦C, 25◦C and 37◦C incubation temperatures, respectively (Fig. 3A,
right panel). The results showed that for the crude BV preparation, 37◦C was the most suitable incubation temperature. This
incuba-tion temperature resulted in the greatest peak area increase—an increase that was similar to what was achieved for the standard. The lower efficiencies obtained when incubation was carried out at 4◦C and 25◦C is assumed to be due to composition of the
super-natant. Unlike the standard, which was prepared in a Tris–HCl buffer (favorable for labeling), the supernatant was spent culture medium, which may contain various types of contaminants. Fur-thermore, it has been suggested that the entry of the dye to an encapsidated genome is by diffusion[31]; therefore, although the mechanisms governing this diffusion were not elucidated in this study, we assumed that the supernatants could be considered more viscous because of the presence of cellular DNA fragments, which could delay the contact of the dye to the virus particle. This is in part supported by the large “first” peak detected by fluorescence from the chromatogram of supernatant containing BV (Fig. 2C).
3.3.4. Effect of SYBR Green I concentration on labeling
To determine whether the SGI concentration had an effect on labeling, the standard was incubated with SGI at concentrations between 1× and 5× SGI. The results showed negligible difference in the overall increase in peak area for the different concentrations tested (data not shown). The main difference observed was with the HPLC profiles when the SGI concentration was increased (Fig. 3B). As can be seen, when using SGI at 1× and 2×, the baseline is rela-tively flat with the virus peak easily extracted; however, when the SGI concentration was increased to 3× and 4×, a significant shift in the baseline was observed. This shift was even more pronounced at 5× SGI. Because there was no difference in profile between the uses of SGI at 1× or 2×, all subsequent analyses were done using SGI at 2× concentration. 2× was chosen to minimize the possibility that the dye was a limiting factor in the staining of the BV genomes.
3.3.5. Effect of Triton X-100 membrane permeabilization
Triton X-100, a non-ionic surfactant, has been shown to enhance the labeling of virus particles for detection by flow cytometry (Shen et al.,[17]). Since labeling of virus in the supernatant was not as efficient at lower temperatures, the effect of adding different con-centrations of Triton X-100 to the detection of BV in cell culture supernatants was investigated.
When incubating samples at 37◦C, the addition of Triton X-100
at 0.001% and 0.005% resulted in only ∼4% increase in the BV peak area compared to the control (Fig. 3C). At a concentration of 0.01%, a marked decrease (∼95%) in the BV peak area was observed (Fig. 3C). These results suggested that after 1 h of incubation at this tempera-ture, without permeabilization, the dye–genome complex reached saturation. These results also suggest that increasing Triton X-100 beyond 0.005% causes the BV particle to degrade.
Unlike at 37◦C, there was an increase in the observed peak area
for increasing Triton X-100 concentrations when the sample was incubated at 25◦C (Fig. 3C). Incubating the sample with 0.001%
Tri-ton X-100 increased the peak area by a factor of 1.5. Increasing the concentration of Triton X-100 to 0.005 and 0.01% resulted in a ∼4-fold increase in peak area.
Although BV was detected when the labeling process was conducted at 4◦C, it was the worst temperature of the three
tem-peratures examined (Fig. 3C). The addition of Triton X-100 did not improve this result. In all samples treated with Triton X-100 at 4◦C,
no virus peak was discerned from the chromatograms.
These results showed that labeling the virus at 37◦C allowed the
largest BV peak to be observed and that the addition of Triton X-100 did not better these results. The use of Triton X-100 was therefore deemed unnecessary in this protocol.
66 J. Transfiguracion et al. / J. Chromatogr. B 879 (2011) 61–68
Fig. 4. The method specificity was demonstrated by comparing the chromatograms obtained from buffer (20 mM Tris–HCl, pH 7.5) and an Sf9 cell culture supernatant to those obtained when these samples were spiked with a known quantity of BV (3 × 10⁸BV/ml). (A) Buffer; (B) buffer spiked with BV (3 × 10⁸BV/ml); (C) Sf9 cell culture
supernatant; (D) Sf9 cell culture supernatant spiked with BV (3 × 10⁸BV/ml). 3.4. Method validation
3.4.1. Specificity
To look at the specificity of the method, the standard was spiked into a Tris buffer or a non-infected cell culture supernatant. Alone, no peaks were detected for the Tris buffer blank (Fig. 4A); therefore, the buffer did not interfere with the interpretation of the chro-matogram. When the buffer was spiked with the concentrated BV, the virus peak was clearly detected and highly resolved (Fig. 4B). The cell culture supernatant showed a significant amount of small nucleic acids that elute before the expected elution point of bac-ulovirus (Fig. 4C) and are probably the same contaminants that are seen in the concentrated standard (Fig. 4B). The Sf9 cell cul-ture supernatant did show a small but detectable peak (Fig. 4C) where we expected to see BV. The size of this peak would rep-resent ∼5 × 10⁷VP/ml if not accounted for in the conversion of
peak area to BV particle count. The area of the peak after spiking the supernatant (3 × 10⁸VP/ml) increased ∼4-fold, and was well
resolved from any other peaks that were present in the cell culture supernatant (Fig. 4D).
3.4.2. Linearity, limit of detection and limit of quantification The method was linear over 3 orders of magnitude with a corre-lation coefficient (R2) of 0.9743 (Fig. 5) based on serial dilutions
of the standard. Injections of the standard having 1 × 10⁷VP/ml
were not detectable. The limit of peak detection corresponded to a sample having a concentration of 5 × 10⁷VP/ml. The lower limit of
linearity (and lower limit of quantification) was 1 × 10⁸VP/ml.
3.4.3. Precision
The intra-assay precision obtained for the standard as mea-sured by the % relative standard deviation (%RSD) was less than 10% (Table 1(A)) whereas for the inter-assay precision, the %RSD was less than 5% (Table 1(B)). For a cell culture supernatant
con-taining BV, the %RSD for the intra-assay precision was less than 10% (Table 2(A)) whereas for the inter-assay precision the %RSD was less than 10% (Table 2(B)). The %RSD for the retention time was less than 1% for both samples (data not shown).
3.4.4. Accuracy/recovery
To determine whether the supernatant interfered with the quantification, a cell culture supernatant containing BV was ana-lyzed following being spiked with different concentrations of BV (5 × 10⁷, 1 × 10⁸and 1 × 10⁹VP/ml). The theoretical concentrations
were the same as those spiked concentrations except that they were prepared in the Tris–HCl buffer blank. The recoveries/accuracies obtained for the spiked 5 × 10⁷, 1 × 10⁸ and 1 × 10⁹VP/ml were
77%, 81% and 101%, respectively.
Fig. 5. Linearity of HPLC assay. Black squares are data included in the linear range of the calibration curve. Open circles are below the linear range of the assay and below the limit of quantification. Error bars represent the standard deviation from replicate measurements (n ≥ 2).
Table 1
Assay precision of the baculovirus quantification in the standard based on HPLC measured peak areas.
(A) Intra-variation
Injection # Day 1 Day 2 Day 3 Day 4 Day 5
1 8.0 × 10⁷ 8.1 × 10⁷ 8.5 × 10⁷ 8.3 × 10⁷ 8.3 × 10⁷ 2 8.9 × 10⁷ 8.8 × 10⁷ 8.5 × 10⁷ 8.9 × 10⁷ 7.9 × 10⁷ 3 9.2 × 10⁷ 8.7 × 10⁷ 8.2 × 10⁷ 8.2 × 10⁷ 8.9 × 10⁷ 4 9.9 × 10⁷ 8.8 × 10⁷ 8.3 × 10⁷ 8.8 × 10⁷ 9.1 × 10⁷ 5 9.3 × 10⁷ 8.2 × 10⁷ 8.2 × 10⁷ 7.5 × 10⁷ 7.9 × 10⁷ Mean 9.0 × 10⁷ 8.5 × 10⁷ 8.3 × 10⁷ 8.3 × 10⁷ 8.4 × 10⁷ SD 7.0 × 10⁶ 3.6 × 10⁶ 1.5 × 10⁶ 5.7 × 10⁶ 5.5 × 10⁶ RSD 8% 4% 2% 7% 7% (B) Inter-variation
Day 1 Day 2 Day 3 Day 4 Day 5 Mean SD RSD
9.0 × 10⁷ 8.5 × 10⁷ 8.3 × 10⁷ 8.3 × 10⁷ 8.4 × 10⁷ 8.5 × 1073.0 × 106 4%
Table 2
Assay precision of baculovirus quantification in cell culture supernatants based on HPLC measured peak areas.
(A) Intra-variation
Injection # Day 1 Day 2 Day 3 Day 4 Day 5
1 8.8 × 10⁶ 8.6 × 10⁶ 6.7 × 10⁶ 7.4 × 10⁷ 6.6 × 10⁷ 2 8.1 × 10⁶ 8.7 × 10⁶ 7.4 × 10⁶ 8.5 × 10⁶ 7.2 × 10⁶ 3 7.9 × 10⁶ 9.0 × 10⁶ 7.3 × 10⁶ 7.3 × 10⁶ 7.6 × 10⁷ 4 7.6 × 10⁶ 8.2 × 10⁶ 6.4 × 10⁶ 6.8 × 10⁶ 7.3 × 10⁶ 5 7.3 × 10⁶ 7.3 × 10⁶ 7.9 × 10⁶ 6.9 × 10⁶ 7.3 × 10⁶ Mean 8.0 × 10⁶ 8.4 × 10⁶ 7.1 × 10⁶ 7.4 × 10⁶ 7.2 × 10⁶ SD 5.7 × 10⁵ 6.8 × 10⁵ 5.8 × 10⁵ 6.7 × 10⁵ 3.5 × 10⁵ RSD 7% 8% 8% 9% 5% (B) Inter-variation
Day 1 Day 2 Day 3 Day 4 Day 5 Mean SD RSD
8.0 × 10⁶ 8.4 × 10⁶ 7.1 × 10⁶ 7.4 × 10⁶ 7.2 × 10⁶ 7.2 × 1065.7 × 105 8%
3.5. Quantification of different BV stocks
The applicability of the developed method was demonstrated by the analysis of different BVs in culture supernatants and comparing
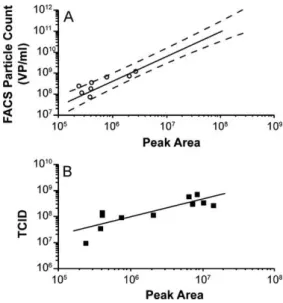
Fig. 6. (A) Comparison of HPLC peak areas vs. particle count from flow cytometric method (FACS). Solid line is the calibration curve established from semi-purified BV. Dashed curves are the 95% confidence interval of the calibration curve. Open circles are cell culture supernatants quantified by flow cytometry (FACS) and HPLC (peak area). (B) Cell culture supernatants quantified by both EPDA (TCID50) and HPLC (peak area).
the peak areas obtained with two other independent assays (end-point dilution and flow cytometry) for each sample (Fig. 6). Both independent methods show strongly correlated results to this HPLC method. All stocks quantified by both flow cytometry (FACS) and HPLC resulted in data that lied within the 95% confidence interval of the previously established calibration curve (Fig. 6A). It should be noted that baculovirus supernatants with high concentrations of baculovirus tended to give larger peak areas compared to their flow cytometric measures. As a result, for virus in culture supernatants, a working range between 1 × 10⁸ and 1 × 10⁹VP/ml
correspond-ing to a peak area between 2 × 10⁵ and 2 × 10⁶is recommended.
The correlation coefficient, R2, against the end-point dilution titers
was 0.88 (Fig. 6B), further supporting the usefulness of this HPLC method in establishing infection conditions.
4. Concluding remarks
This study increases the toolset available for those who want to foray into the use of BV technology. This HPLC method is able to isolate the BV in a single well defined peak after labeling with SYBR Green I fluorescent dye. The strength of this rapid in process method lies in its capacity to cover multiple orders of magnitude and the lit-tle preparation needed to detect the virus. Lastly, there is a potential to automate the method and improve its robustness by stream-lining the viral genome labeling step and the sample preparation sequences. Work is in progress to achieve this goal.
Acknowledgements
The authors gratefully acknowledge Johnny Montes and Iness Ben Kraiem who helped in generating the material used in this study and execution of FACS and end point dilutions assays and Andre Migneault for artwork. The authors would also like to thank Steve George and Yeong Ho Suh for their contributions in the char-acterization of the standard.
References
[1] J. Meghrous, W. Mahmoud, D. Jacob, R. Chubet, M. Cox, A.A. Kamen, Vaccine 28 (2009) 309.
[2] T. Senger, L. Schadlich, L. Gissmann, M. Muller, Virology 388 (2009) 344. [3] E.A. Davenport, P. Nuthulaganti, R.S. Ames, Methods Mol. Biol. 552 (2009) 199. [4] T.A. Kost, J.P. Condreay, R.S. Ames, S. Rees, M.A. Romanos, Drug Discov. Today
12 (2007) 396.
[5] J.A. Fornwald, Q. Lu, D. Wang, R.S. Ames, Methods Mol. Biol. 388 (2007) 95. [6] M.G. Aucoin, M. Perrier, A.A. Kamen, Biotechnol. Bioeng. 95 (2006) 1081. [7] L.A. Palomares, S. Lopez, O.T. Ramirez, in: A. Bernard (Ed.), Animal Cell
Technol-ogy: Products from Cells, Cells as Products, Kluwer Academic Publishers, 1999, p. 347.
[8] K.M. Radford, C. Cavegn, M. Bertrand, A.R. Bernard, S. Reid, P.F. Greenfield, Cytotechnology 24 (1997) 73.
[9] K.T. Wong, C.H. Peter, P.F. Greenfield, S. Reid, L.K. Nielsen, Biotechnol. Bioeng. 49 (1996) 659.
[10] P. Licari, J.E. Bailey, Biotechnol. Bioeng. 37 (1991) 238.
[11] T. Vicente, C. Peixoto, M.J. Carrondo, P.M. Alves, Gene Ther. 16 (2009) 766. [12] J. Transfiguracion, H. Jorio, J. Meghrous, D. Jacob, A. Kamen, J. Virol. Methods
142 (2007) 21.
[13] C. Wu, K.Y. Soh, S. Wang, Hum. Gene Ther. 18 (2007) 665.
[14] R. Michalsky, A.L. Passarelli, P.H. Pfromm, P. Czermak, Desalination 250 (2010) 1125.
[15] H. Jorio, R. Tran, J. Meghrous, L. Bourget, A. Kamen, J. Virol. Methods 134 (2006) 8.
[16] A. Roldao, R. Oliveira, M.J. Carrondo, P.M. Alves, J. Virol. Methods 159 (2009) 69. [17] C.F. Shen, J. Meghrous, A. Kamen, J. Virol. Methods 105 (2002) 321.
[18] H. Jorio, R. Tran, A. Kamen, Biotechnol. Prog. 22 (2006) 319. [19] M.G. Aucoin, J.A. Mena, A.A. Kamen, Curr. Gene Ther. 10 (2010) 174. [20] J. Transfiguracion, D.E. Jaalouk, K. Ghani, J. Galipeau, A. Kamen, Hum. Gene Ther.
14 (2003) 1139.
[21] P.S. Chahal, M.G. Aucoin, A. Kamen, J. Virol. Methods 139 (2007) 61. [22] J. Transfiguracion, A. Bernier, R. Voyer, H. Coelho, M. Coffey, A. Kamen, J. Pharm.
68 J. Transfiguracion et al. / J. Chromatogr. B 879 (2011) 61–68 [23] P.S. Chahal, J. Transfiguracion, A. Bernier, R. Voyer, M. Coffey, A. Kamen, J. Pharm.
Biomed. Anal. 5 (2007) 417.
[24] J. Transfiguracion, H. Coelho, A. Kamen, J.B. Chrom, Anal. Technol. Biomed. Life Sci. 813 (2004) 167.
[25] J. Transfiguracion, A. Bernier, N. Arcand, P. Chahal, A. Kamen, J. Chromatogr. B: Biomed. Sci. Appl. 761 (2001) 187.
[26] J. Barsoum, BioTechniques 26 (1999) 834.
[27] M. Urabe, C. Ding, R.M. Kotin, Hum. Gene Ther. 13 (2002) 1935.
[28] J.A. Mena, O.T. Ramirez, L.A. Palomares, Biotechniques 34 (2003) 260.
[29] R.B. Hitchman, E.A. Siaterli, C.P. Nixon, L.A. King, Biotechnol. Bioeng. 96 (2007) 810.
[30] I. Tancevski, A. Wehinger, J.R. Patsch, A. Ritsch, Int. J. Biol. Macromol. 39 (2006) 77.
[31] L. Kremser, V.M. Okun, A. Nicodemou, D. Blaas, E. Kenndler, Anal. Chem. 76 (2004) 882.