ORIGINAL ARTICLE
Insulin-based strategies to prevent hypoglycaemia during
and after exercise in adult patients with type 1 diabetes on pump
therapy: the DIABRASPORT randomized study
S. Franc
1,2, A. Daoudi
1, A. Pochat
1, M.-H. Petit
1, C. Randazzo
1, C. Petit
1, M. Duclos
3, A. Penfornis
2, E. Pussard
4,
D. Not
5, E. Heyman
6, F. Koukoui
7, C. Simon
8& G. Charpentier
1,2 1Centre for Study and Research for Improvement of the Treatment of Diabetes (CERITD), Evry, France 2Department of Diabetes, Sud-Francilien Hospital, Corbeil-Essonnes, France3Department of Sport Medicine and Functional Exploration, Clermont-Ferrand University Hospital, UMR1019 CRNH, Clermont-Ferrand, France 4Molecular Genetics, Pharmacogenetics and Hormonology Laboratory, Bicêtre University Hospital, Kremlin-Bicêtre, France
5RCTs, Lyon, France
6‘Physical Activity, Muscle, Health’ Research Team, URePSSS, University of Lille, Lille, France 7Department of Cardiology, Sud-Francilien Hospital, Corbeil-Essonnes, France
8Department of Endocrinology, Diabetes and Metabolic Diseases, Lyon Sud University Hospital, Pierre-Bénite, France
Aims:To validate strategies to prevent exercise-induced hypoglycaemia via insulin-dose adjustment in adult patients with type 1 diabetes (T1D) on pump therapy.
Methods:A total of 20 patients randomly performed four 30-min late post-lunch (3 h after lunch) exercise sessions and a rest session: two moderate sessions [50% maximum oxygen consumption (VO2max)] with 50 or 80% basal rate (BR) reduction during exercise + 2 h and two intense sessions (75% VO2max) with 80% BR reduction or with their pump stopped. Two additional early post-lunch sessions (90 min after lunch) were analysed to compare hypoglycaemia incidence for BR reduction versus bolus reduction.
Results:In all, 100 late post-lunch sessions were analysed. Regardless of exercise type and BR reduction, no more hypoglycaemic events occurred in the period until the next morning than occurred after the rest sessions. In the afternoon, no more hypoglycaemic events occurred with 80% BR reduction/moderate exercise or with pump discontinuation/intense exercise than for the rest session, whereas more hypoglycaemic events occurred with 50% BR reduction/moderate exercise and 80% BR reduction/intense exercise. After early post-lunch exercise (n = 37), a trend towards fewer hypoglycaemic episodes was observed with bolus reduction versus BR reduction (p = 0.07). Mean blood glucose fell by ∼3.3 mmol/l after 30 min of exercise, irrespective of dose reduction, remaining stable until the next morning with no rebound hyperglycaemia.
Conclusion:In adults with T1D, to limit the hypoglycaemic risk associated with 30 min of exercise 3 h after lunch, without carbohydrate supplements, the best options seem to be to reduce BR by 80% or to stop the pump for moderate or intense exercise, or for moderate exercise 90 min after lunch, to reduce the prandial bolus rather than the BR.
Keywords: continuous subcutaneous insulin infusion, exercise, glycaemic control, insulin pump therapy, type 1 diabetes
Date submitted 2 April 2015; date of first decision 3 May 2015; date of final acceptance 6 August 2015
Introduction
Despite growing evidence about the health benefits of regular exercise for patients with type 1 diabetes (T1D), exercise-associated glycaemic imbalance remains a challenge in this population. Guidelines for minimizing hypoglycaemic risk exist but remain general [1]. In practice, two types of adjust-ment may be considered [2,3]: (i) carbohydrate suppleadjust-ments [4,5], particularly for unanticipated exercise and where insulin dose reduction is impossible, and (ii) premeal insulin-dose
Correspondence to : Dr Sylvia Franc, Department of Diabetes, Sud-Francilien Hospital, 116 Bd
Jean Jaurès, 91100 Corbeil-Essonnes, France. E-mail: sylvia.franc@free.fr
This is an open access article under the terms of the Creative Commons Attribution-NonCommercial-NoDerivs License, which permits use and distribution in any medium, provided the original work is properly cited, the use is non-commercial and no modifications or adaptations are made.
reduction [6,7] for multiple daily injections (MDI), provided exercise can be anticipated. Conversely, pump therapy allows immediate insulin-dose reduction through temporary basal rate (BR) reduction. While insulin pump guidelines essen-tially concern patients on intensive exercise programmes [8–10], no precise recommendations exist on averting hypo-glycaemia resulting from short periods of moderate or intense exercise, for recreation or work, in ‘non-athletic’ patients. We aim to provide such patients with specific adjustment rules favouring insulin reduction over carbohydrate intake to pre-vent exercise-related hypoglycaemic risk. We opted for short sessions (30 min) of moderate or intense aerobic exercise to reflect the most common forms of activity encountered in everyday leisure pursuits, domestic chores and work tasks by the majority of our non-athletic patients. In our two-part randomized study, patients with T1D on pump therapy wore a continuous glucose-monitoring (CGM) device and on each test
Figure 1. General study design. VO2max, maximum oxygen consumption.
day performed 30 min of exercise at two intensity levels, either 3 h (part 1) or 90 min (part 2) after lunch. In part 1, we sought to define the optimum BR adjustments for each intensity level to ensure that no more hypoglycaemic events occurred than after the rest session and that there was no secondary hypergly-caemia. In part 2, we aimed to identify the best option between BR and bolus reduction for limiting hypoglycaemic events.
Participants and Methods
Study Design and ParticipantsThis randomized, single-blind, single-centre, crossover study (Figure 1) included patients with T1D aged ≥18 years, who had been on pump therapy for≥3 months, were using carbo-hydrate counting, were without hypoglycaemia unawareness or severe diabetic complications, and had glycated haemoglobin (HbA1c) concentration <9.0% (75 mmol/mol). The partici-pants regularly performed exercise for work, domestic activ-ity or leisure, and had stable basal insulin infusion rates for ≥1 week.
The trial was registered with ClinicalTrials.gov under the identification number: NCT01277965.
Procedures
After entering the study, the participants underwent VO2max determination. They then performed several standardized exercise sessions, each involving 30 min of cycling on a constant-power cycle ergometer (Tm-Cardio4000), bracketed by 5 min of exercise increase and recovery.
The first part comprised five late (3 h) post-lunch sessions at least 48 h apart, in randomized order: one rest session; two moderate exercise sessions at 50% VO2max, with either 50 or 80% BR reduction; and two intense exercise sessions at 75% VO2max, with either 80% BR reduction or stopping of
the pump. For each test, BR was reduced during exercise and over the ensuing 2 h (exercise + 2 h) except when the pump
was stopped (with reactivation immediately after the session). Participants were unaware of their pump mode.
The second part comprised two additional early post-lunch sessions 90 min after the beginning of lunch at 50% VO2max;
one with bolus reduction (−30 or −50%) at lunchtime, the other with BR reduction (−50 or −80%), based on the results of the late post-lunch exercise session at 50% VO2max: where 80%
BR reduction had produced the fewest hypoglycaemic events, 80% BR reduction was compared with 50% bolus reduction, otherwise 50% BR reduction was compared with 30% bolus reduction (Figure 1).
Study Conduct
On test days, patients had breakfast at home at 07:00 hours, arrived at the centre at 10:00 hours and had lunch at 11:30 hours. At each meal, they used their own carbohy-drate : insulin ratio and insulin sensitivity values to calculate prandial insulin doses. They exercised either at 14:30 hours (late post-lunch session) or 13:00 hours (early post-lunch session). They left the centre at 17:00 hours, had dinner at 20:00 hours and went to bed by 23:00 hours.
Randomization
The test sequence alone was randomized electronically using dynamic assignment sequences generated by electronic Case Report Form (ClinInfo, Lyon, France), with pairing of the following respective sessions: 1–2 late post-lunch moderate exercise, 3–4, late post-lunch intense exercise and 6–7, early post-lunch moderate\break exercise.
Measurements
Continuous Glucose Monitoring Records.A CGMS iPro2 (Medtronic, Northridge, CA, USA) measured glucose changes from 10:30 hours on the test day until the next morning (blinded system). Patients removed their sensors next day at breakfast and returned them to the centre.
Blood Glucose and Insulin Values.Blood was drawn via indwelling catheter pretesting, during exercise/resting sessions (+15/+30 min) and recovery (+60/+90/+120/+150 min). Blood glucose (BG) was determined by multiparametric anal-yser (Roche/Hitachi cobas c 701, Roche Diagnostics GmbH, Mannheim, Germany) and plasma insulin was measured by immunoradiometric assay (Bi-insulin IRMA; Cisbio Bioassays, Codolet, France).
Patient Evaluation of Exercise.On completing sessions, patients defined exercise intensity as ‘moderate’ or ‘intense’ and indicated their perceived exertion level on a Borg 6–20 scale [11].
Outcomes
The primary endpoint was the number of hypoglycaemic events (glucose <3.3 mmol/l) detected by CGM throughout the entire period, i.e. from start of exercise to 07:00 hours the next day. The main secondary efficacy endpoints were: (i) the number and quantity of extra carbohydrates administered in the following situations: capillary glucose at routine moni-toring<3.9 mmol/l; hypoglycaemic symptoms with capillary glucose<3.9 mmol/l; and capillary glucose at start of exercise
<5.5 mmol/l. Glucose was provided via orange juice; and (ii)
the number of hypoglycaemic events during the afternoon (from start of exercise to 20:00 hours) and at night (from 20:00 to 07:00 hours next day); and (iii) changes in BG, CGM and insulin values, patient perception of exercise intensity (intense or moderate) and score on the Borg 6–20 scale.
Statistical Methods
A sample population of 20 patients was planned to enable detec-tion of a mean intrapatient difference of 0.21 hypoglycaemic episodes per week (i.e. 0.03 hypoglycaemic episodes/day) with statistical power of 80%, assuming a standard deviation (s.d.) of 0.14 and a two-sided type I error of 0.05.
Statistical analyses were performed using sas 9.2 (SAS Institute Inc., Cary, NC, USA). Type I error was taken as 0.05. Continuous variables were compared using analysis of variance for crossover design. For non-normal distribution, models were either computed on ranks or outcomes were log-transformed. Baseline glucose value was used as a covariate where appropriate.
The numbers of hypo-/hyperglycaemic events and extra car-bohydrate events were compared using an ordinal model for crossover design, and binary outcomes were compared using a conditional logistic regression model for crossover design. Pairwise comparisons were performed for: (i) each of the four late post-lunch exercise sessions and the rest session; (ii) groups having the same activity sessions (50% VO2max with 50 or 80% BR reduction; 75% VO2max with 80% BR reduction or pump stopped), and (iii) early post-lunch sessions with bolus or BR reduction. Additional pairwise comparisons were performed for the number of hypoglycaemic events and extra-carbohydrate administrations between all exercise ses-sions and the rest session. Wilcoxon signed-rank tests were per-formed for post-exercise glycaemic change measured by CGM or BG level.
Results
Study PopulationA total of 20 adult patients with T1D (11 male) were included in the study, which was conducted between March 2010 and November 2012 (Figure S1). The participant profiles were: age 45 ± 11.9 years; diabetes duration 18 ± 10 years; HbA1c 7.9 ± 0.9% (63 mmol/mol); total daily insulin dose: 49 ± 19 IU; body mass index 24.5 ± 2.8 kg/m2; VO
2max:
33 ± 10 ml/kg/min; continuous subcutaneous insulin infusion treatment duration: 5 ± 3.8 years. The participants performed 4.3 ± 2.9 h/week of recreational or work exercise.
Late Post-Lunch Exercise
We collected data for 100 sessions in 20 patients, each perform-ing one rest session, two sessions at 50% VO2max with 50 or 80% BR reduction during exercise + 2 h and two sessions at 75% VO2max with 80% BR reduction during exercise + 2 h or with pump stopped during exercise (Figure S1).
Entire Period.During the entire period, no hypoglycaemic events were noted (i.e. interstitial glucose<3.3 mmol/l detected by CGM), during either exercise or rest sessions (p = 0.56; main endpoint). No differences were noted for extra-carbohydrate use (Table 1) for exercise versus rest, regarding either frequency (p = 0.40) or quantity (p = 0.68).
Afternoon Period.During the afternoon with moderate exercise (50% VO2max), no more hypoglycaemic events occurred with
80% BR reduction compared with rest (p = 0.58), whereas more hypoglycaemic events occurred with 50% BR reduction com-pared with rest (p = 0.03). Similarly, with intense exercise (75% VO2max), no more hypoglycaemic events occurred when the pump stopped compared with rest (p = 0.14), whereas sig-nificantly more hypoglycaemic events occurred with 80% BR reduction compared with rest (p = 0.028; Table S1).
After 30 min of exercise, mean BG fell by 3.5–3.9 mmol/l (Table S2), irrespective of exercise session (Figure 2A, C). After exercise, mean BG remained stable or tended to rise.
As expected, the decrease in CGM compared with BG values was delayed, with a fall of −2.6 to −1.8 mmol/l between the start and end of exercise, but remained fairly stable during rest sessions (Table S1).
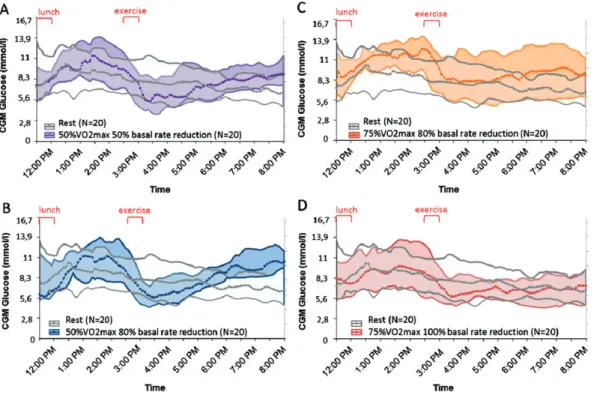
Compared with baseline, the decrease in glucose determined by CGM during exercise was lower than that determined by BG measurement [difference of (median (IQR Q1–Q3)): 0.3 (−0.4;+1.9) to 0.8 (0.1;1.1) mmol/l at T + 15 min and of 0.7 (0.5;2.6) to 1.3 (0.5;1.9) mmol/l at T + 30 min], depending on tests, with the difference being significant for most sessions (Figure 3). Unlike BG, CGM values continued to fall after exercise (from −1.8 to −2.7 mmol/l), irrespective of BR reduc-tion (Figure 4A–D). Mean pre-dinner CGM values tended to be higher after moderate exercise for both 50 and 80% BR reduc-tion compared with rest, without reaching the hyperglycaemic threshold (10 mmol/l). With intense exercise, mean pre-dinner CGM values tended to be higher for 80% BR reduction com-pared with rest, but did not differ from mean resting values when the pump was stopped (Table S1).
Table 1.Hypoglycaemic events (defined as CGM< 3.3 mmol) and extra-carbohydrate events during the entire period for late post-lunch sessions: number (%) of patients with 0–4 events.
50% VO2max 75% VO2max Afternoon + night-time period Rest sessions N = 20 Exercise sessions N = 80 50% BR reduction N = 20 80% BR reduction N = 20 80% BR reduction N = 20 Pump stop N = 20 Hypoglycaemic events, n (%) 0 12 (60.0) 44 (55.0) 11 (55.0) 11 (55.0) 11 (55.0) 11 (55.0) 1 5 (25.0) 22 (27.5) 4 (20.0) 7 (35.0) 5 (25.0) 6 (30.0) 2 3 (15.0) 11 (13.8) 4 (20.0) 1 (5.0) 4 (20.0) 2 (10.0) 3 0 (0.0) 2 (2.5) 0 (0.0) 1 (5.0) 0 (0.0) 1 (5.0) 4 0 (0.0) 1 (1.3) 1 (5.0) 0 (0.0) 0 (0.0) 0 (0.0) p value vs rest 0.56 0.57 0.82 0.67 0.73 Extra-carbohydrate events, n (%) 0 12 (60.0) 45 (56.3) 11 (55.0) 12 (60.0) 12 (60.0) 10 (50.0) 1 7 (35.0) 23 (28.8) 7 (35.0) 5 (25.0) 7 (35.0) 4 (20.0) 2 1 (5.0) 9 (11.3) 1 (5.0) 3 (15.0) 1 (5.0) 4 (20.0) 3 0 (0.0) 2 (2.5) 1 (5.0) 0 (0.0) 0 (0.0) 1 (5.0) 4 0 (0.0) 1 (1.3) 0 (0.0) 0 (0.0) 0 (0.0) 1 (5.0) p value vs rest 0.40 0.51 0.77 1.00 0.16
Extra carbohydrate quantity, g
N 8 35 9 8 8 10
Median 30.0 30.0 30.0 30.0 20.0 45.0
[Quartile 1;Quartile 3] [20.0;40.0] [20.0;40.0] [20.0;40.0] [20.0;40.0] [20.0;25.0] [20.0;60.0]
p value vs rest 0.68 0.81 0.82 0.44 0.11
BR, basal rate; VO2max, maximum oxygen consumption.
Percentage time with BG values within the range 3.9–10 mmol/l did not differ between moderate exercise and rest, nor did time below or above that range. With intense exercise, time inside the range was significantly less for 80% BR reduction than for rest (48 ± 33% vs 72 ± 24%; p = 0.037), but did not differ from rest when the pump was stopped.
While BG values gradually decreased during exercise, insulin levels rose slightly (Figure 2B, D), even with the pump stopped. The increase in blood insulin was significant for exercise compared with rest (p = 0.004) with a mean difference of 7.8 ± 2.6 μU/ml between 0 and 30 min vs rest. A secondary drop was subsequently seen.
Night-Time Period. The numbers of night-time hypoglycaemic events did not differ significantly for any exercise session com-pared with rest, nor did extra-carbohydrate use (p = 0.99).
Bedtime CGM values did not differ significantly for any exercise session compared with the rest session, nor did CGM values next morning (Table S3). Median CGM curves for exercise sessions remained flat during the night and similar to rest curves (Figure S2). Percentage time inside/outside the range. Percentage time spent within the range 3.9–10 mmol/l did not differ significantly for any types of exercise compared with rest.
Early Post-Lunch Exercise
We collected data for 37 early post-lunch exercise sessions involving either bolus reduction (n = 19) or BR reduction (n = 18; Figure S1).
Entire Period.During the entire period, no differences in hypo-glycaemic events were noted for exercise at 50% VO2 max, with bolus or BR reduction (p = 0.22).
Afternoon Period. During the afternoon, there was a trend towards fewer hypoglycaemic events for bolus compared with BR reduction (p = 0.07) and higher extra-carbohydrate intake (p = 0.02; Table S4).
During exercise, BG reductions were similar in both cases (bolus reduction: −3.9 ± 1.8 mmol/l; BR reduction: −4.3 ± 2.2 mmol/l; p = 0.19). After exercise, mean BG remained stable or tended to rise (Figure 2E).
At lunchtime (90 min pre-exercise), mean CGM values did not differ significantly between bolus and BR reduction ses-sions, but with bolus reduction, glucose levels were higher at T0 immediately pre-exercise (12.3 ± 3.4 vs 9.5 ± 3.3 mmol/l; p = 0.03). During exercise, the drops in CGM were only −2.3 and −1.9 mmol/l, respectively, and both values continued to decline thereafter. There was a trend towards higher mean CGM values with bolus reduction compared with BR reduction dur-ing the afternoon (9.3 ± 2.6 vs 7.2 ± 2.4 mmol/l, p = 0.054) and higher CGM values on the median curves (Figure S3A); how-ever, at dinner, we observed no significant difference in CGM levels for bolus compared with BR reduction (Table S4).
The percentage time inside the range 3.9–10 mmol/l did not differ significantly between bolus and BR reduction, nor did that at<3.9 mmol/l. There was a trend towards more time at
>10 mmol/l for bolus compared with BR reduction (42 ± 33%
vs 16 ± 28%; p = 0.057).
As expected, insulin levels were lower for bolus compared with BR reduction at the start (31 ± 22 vs 42 ± 33 μIU/ml;
Figure 2. Changes in BG and Blood Insulin during and 2 hours after exercise: late post lunch (3h) sessions at 50%VO2max: A (BG) and B (blood insulin)
with 50% (purple) or 80% (blue) BR reduction and rest (dotted line). Late post-lunch (3h) exercise at 75%VO2max: C (BG) and D (blood insulin) with
80% BR reduction (yellow) or pump stop (red) and rest (dotted line). Early post-lunch (90 mn): E (BG) and (F) (blood insulin) with BR reduction (grey) or bolus reduction (green). Values are mean ± standard error of the mean.
Figure 3. Late post-lunch exercise sessions. Median [+ interquartile range (IQR)Q1–Q3] continous glucose monitoring glucose (grey curves) and median
(+ IQRQ1–Q3) blood glucose (red curves). (A) 50% maximum oxygen consumption (VO2max) exercise with 50% basal rate (BR) reduction. (B) 50% VO2max
exercise with 80% BR reduction. (C) 75% VO2max exercise with 80% BR reduction. (D) 75% VO2max exercise with stopping of pump. (E) Rest. CGM, continous glucose monitoring.
p = 0.002), again with a slight increase in blood insulin, becoming significant at T + 30 min vs T0 (p = 0.001), fol-lowed by a secondary gradual decrease in blood insulin (Figure 2F).
Night-Time Period.The incidence of night-time hypoglycaemic events did not differ significantly after bolus compared with after BR reduction, nor did extra-carbohydrate use.
Bedtime CGM readings did not differ for bolus com-pared with BR reduction. Median CGM curves remained flat during the night (Figure S3B). The mean night-time CGM values did not differ between the two sessions (8.7 ± 27 vs 8.6 ± 2.4 mmol/l; p = 0.76), nor did fasting CGM values next morning or time spent with BG values inside or outside the range 3.9–10 mmol/l.
Patient Evaluation of Exercise
Ninety percent of the 50% VO2max exercise sessions were considered by patients as moderate, while 60% of the 75% VO2max sessions were considered by patients as intense. The
mean rate of perceived exertion indicated on the Borg 6–20 scale was 12.6 ± 2.1 for 50% VO2max versus 15.6 ± 2.1 for 75% VO2max (p< 0.001).
Discussion
While strategies have been proposed to help patients maintain near-physiological BG levels during exercise [1,6–8,10,12,13], the resulting recommendations are usually fairly general. The aim of the study was to validate hypoglycaemia prevention
Figure 4. Late (3 h) post-lunch sessions. Median (+ interquartile rangeQ1–Q3) continous glucose monitoring values during the afternoon. Light grey: rest
session. 50% maximum oxygen consumption (VO2max) exercise with (A) BR reduction of 50% (purple) or (B) BR reduction of 80% (blue). 75% VO2max
exercise with (C) 80% BR reduction (orange) or (D) pump stop (red). CGM, continous glucose monitoring.
strategies based on insulin dose-reduction algorithms suitable for most of our patients with T1D on pump therapy. Unlike many studies in this field [8–10,14], our subjects performed occasional exercise for leisure or work but were not trained athletes. They were asked to perform short exercise sessions representative of their normal everyday activities.
We thus showed that aerobic exercise (bicycle) for 30 min 3 h after lunch by not especially fit patients with T1D induced no more hypoglycaemic episodes or extra-carbohydrate use over the interim until the following morning than did a rest ses-sion, provided the BR of their insulin pump was reduced by 50 or 80% during exercise and over the next 2 h for exercise at 50% VO2max, and by 80% during exercise + 2 h or by
stop-ping the pump during exercise at 75% VO2max. No rebound hyperglycaemia was observed before dinner and no difference was noted during the night after the exercise session compared with the rest session. It is thus possible to reduce hypoglycaemic risk effectively to the levels recorded at rest simply by reducing the pump BR, without ensuing major hyperglycaemia. Further-more, there appears to be no need in this case for corrective measures over the night-time following exercise, and in par-ticular, no need for reduction of night-time BR or for a snack on retiring to bed, as has been proposed [15,16]. The present study assessed only short-term activity, however, and mainte-nance of nocturnal glucose levels must be examined for exercise of longer duration.
A more detailed analysis of the afternoon post-exercise shows that the best option for exercise at 50% VO2max 3 h after
lunch is 80% BR reduction throughout exercise and the ensuing 2 h. This approach offers an intermediate solution between
reducing BR by 50% before exercise, as recommended by some authors [4,10,17–20] and stopping the pump, which has also been proposed [21,22]. For exercise at 75% VO2max, the best
option is to stop the pump temporarily during exercise, which reflects fairly well the wish of certain patients to remove their pump. For early exercise of moderate intensity in relation to lunch (90 min), the best solution appears to be a 30–50% reduc-tion in prandial bolus rather than a reducreduc-tion in BR; however, this safety option was accompanied on occasion in the present study by higher post-lunch BG levels and a trend towards higher mean CGM values in the afternoon. At present, sev-eral authors consider that reducing the premeal bolus dose, in most instances by 50%, might be more effective [17,19,22] than reducing BR in preventing hypoglycaemic events for exercises soon after a meal. We previously showed that reducing prandial insulin for the meal closest to exercise by 30 or 50% according to exercise intensity [moderate or intense], lowered hypogly-caemic risk to the same level as at rest in patients under contin-uous subcutaneous insulin infusion or MDI [23]. In a random-ized prospective study in patients on MDI, Rabasa-Lhoret et al. [7] also showed that, for short-lasting postprandial activities of moderate intensity, 50% prandial insulin reduction brought BG back to its starting level, thereby considerably reducing hypo-glycaemic risk. However, the present study is to our knowledge the only one to date to provide a direct comparison between bolus and BR reduction.
In any event, our reduction algorithms could not prevent a mean 3.6 mmol/l linear decrease in BG values during the 0.5 h of exercise, regardless of time from meals, intensity of exercise, insulin-treatment adjustment or extent of reduction. A similar
fall in BG (−3.9 mmol/l) was recently reported [24] in adult patients with T1D on MDI during a 1-h walk over undulat-ing terrain, with or without preventive snacks. Another study [25] also reported a mean BG drop of 3.8 mmol/l in patients on continuous subcutaneous insulin infusion performing mod-erate exercise for 45 min. Finally, similar decreases have been reported in children and adolescents performing moderate exercise, with pump BR both activated (−3.5 to −4.11 mmol/l) and deactivated (−2.4 to −3.3 mmol/l) at the start of exercise [22,26].
This decrease in BG level was accompanied by a significant increase in blood insulin level, including when the pump was stopped, with peak values occurring 30 min after BR reduc-tion or after stopping the pump. This phenomenon is prob-ably attributable to mobilization during exercise of on-board insulin already infused. An increase in blood insulin despite unchanged BR has recently been reported [27] with exercise in patients on pump therapy. The action of on-board insulin, which blocks hepatic glucose production, combined with the marked exercise-induced rise in muscle glucose uptake, con-tributes to the fall in BG observed with exercise.
As expected, the fall in CGM values is delayed in rela-tion to the fall in BG values, with a difference after 30 min of 0.7–1.3 mmol/l depending on exercise type, and with wide dis-persal of values (up to 1.9 mmol/l), although at rest, CGM and BG values were similar. Patients must be clearly informed of this under-evaluation in the event of a rapid fall in BG values during exercise.
To prevent BG level reductions during exercise, the BR reduction of the pump must be anticipated, but the key ques-tion is how long in advance of exercise. It has been shown that reducing BR 30 min before the start of exercise limits the BG reduction to ∼1 mmol/l [28]. Other authors have suggested that BR reduction should be started at least 60 min [17,19,20] before the start of endurance-type exercise, and anticipation of 90 min has even been recommended for children and adoles-cents [29], although few studies support this recommendation [30], which seems hard to apply in daily life, not just for chil-dren and youths, but also for adults. A possible compromise could comprise anticipation of physical exercise by between 30 and 60 min, but this point remains to be evaluated. If exercise cannot be anticipated by at least 30–60 min, then capillary BG should be monitored before, and if<8.3 mmol/l, unless exercise can be delayed, patients should be advised to take preventive extra carbohydrates in proportion to the foreseeable average glycaemic fall (−3.3 to −3.9 mmol/l).
One question arising from the present study is how these can results be translated into everyday practice, where patients have no means of precisely evaluating their VO2max. It should be stressed that patients’ own evaluation of their exercise was fairly accurate for moderate exercise, with 90% describing exercise at 50% VO2max as moderate, although their evaluation was less accurate for intense exercise. Use of our algorithms in daily life therefore requires learning by individual patients of the effects on their BG levels of 30 min of exercise defined as either ‘moderate’ or ‘intense’.
A number of limitations to the present study should be acknowledged. First, it was conducted in a small number of
adult patients; even if this number was statistically appropri-ate and the amount of data produced substantial, care must be taken in any attempt to generalize these results. Second, the proposed adjustments to insulin therapy would require adap-tation in the case of activities that are of longer duration, not entirely aerobic, or performed at some time of day other than the afternoon. Third, detection of hypoglycaemic events was based solely on interstitial glucose measurement by CGM, which is of questionable reliability in a context of exercise [31]. Moreover, the limitations of CGM were demonstrated herein, with the tendency to under-evaluate the extent of BG reduction during exercise. Fourth, we opted to investigate the manage-ment of insulin doses with regard to exercise and pump ther-apy, although taking extra carbohydrates represents an alterna-tive for the prevention of hypoglycaemia and still constitutes the only valid approach for glucose values<8.3 mmol/l where exercise has not been anticipated.
Finally, our results show that it is possible to avert the risk of increased hypoglycaemia for exercise lasting 30 min at the start of the afternoon simply by a standardized reduction of the BR of insulin flow from the pump, although these data require valida-tion in a broader patient populavalida-tion. A large-scale prospective study is about to be launched to test these algorithms under nor-mal daily living conditions with and without any anticipation.
Acknowledgements
The authors would like to thank Odile Beltoise for her involve-ment in the conduct of the study, Frederic Mistretta for his extremely useful advice, and Patrick Saunders for his help in drafting and revising the manuscript. The authors also thank Medtronic (Northridge, CA, USA) for providing Ipro2 devices and sensors.
This work was supported by a research grant from the Euro-pean Foundation for the Study of Diabetes (Düsseldorf, Ger-many) and Lifescan.
Conflict of Interest
No potential conflicts of interest relevant to this article are reported. Medtronic was not involved in study design, data collection or analysis.
Data extracts from this study were presented at the 49th Annual Meeting of the European Association for the Study of Diabetes, Barcelona, Spain, 23–27 September 2013, Vienna September 2014, at the American Diabetes Association, Chicago, 21–25 June 2013 and San Francisco, 13–17 June 2014. Contributions: S.F. conceived the study, reviewed the lit-erature and wrote the initial manuscript. C.P. contributed to write the protocol and to gather data. A.D., A.P., E.P., F.K. and M-H.P. contributed to data collection. C.R. tabled the results and revised the manuscript. D.N. conducted statistical analy-ses. C.S., M.D., E.H. and A.P. critically revised the manuscript. G.C. supervised this work, reviewed the protocol and critically revised the manuscript. S.F. and G.C. had full access to all the data in the study and take the responsibility for the integrity of the data, the accuracy of the data analyses and the decision to submit for publication.
Supporting Information
Additional Supporting Information may be found in the online version of this article:
Figure S1.Participant flow diagram.
Figure S2.Late post-lunch exercise sessions during the night.
Figure S3.Early post-lunch exercise sessions.
Table S1.Late (3 h) post-lunch sessions. Afternoon CGM values.
Table S2. Evolution of BG values during late and early
post-lunch sessions.
Table S3.Late (3 h) post-lunch sessions. Night-time CGM values.
Table S4.Early postprandial sessions: afternoon CGM values.
References
1. American Diabetes Association. Physical activity/exercise and diabetes. Diabetes Care 2004; 27(Suppl. 1): S58–62.
2. 2 Kemmer FW. Prevention of hypoglycemia during exercise in type I diabetes. Diabetes Care 1992; 15: 1732–1735.
3. Grimm JJ, Ybarra J, Berné C, Muchnick S, Golay A. A new table for prevention of hypoglycaemia during physical activity in type 1 diabetic patients. Diabetes Metab 2004; 30: 465–470.
4. Riddell MC, Bar-Or O, Ayub BV, Calvert RE, Heigenhauser GJ. Glucose ingestion matched with total carbohydrate utilization attenuates hypoglycemia during exercise in adolescents with IDDM. Int J Sport Nutr 1999; 9: 24–34. 5. Francescato MP, Geat M, Accardo A, Blokar M, Cattin L, Noacco C. Exercise and
glycemic imbalances: a situation-specific estimate of glucose supplement. Med Sci Sports Exerc 2011; 43: 2–11.
6. Mauvais-Jarvis F, Sobngwi E, Porcher R et al. Glucose response to intense aerobic exercise in type 1 diabetes: maintenance of near euglycemia despite a drastic decrease in insulin dose. Diabetes Care 2003; 26: 1316–1317. 7. Rabasa-Lhoret R, Bourque J, Ducros F, Chiasson JL. Guidelines for premeal
insulin dose reduction for postprandial exercise of different intensities and durations in type 1 diabetic subjects treated intensively with a basal-bolus insulin regimen (ultralente-lispro). Diabetes Care 2001; 24: 625–630. 8. Perkins BA, Riddell MC. Type 1 diabetes and exercise: using the insulin pump to
maximum advantage. Can J Diabetes 2006; 30: 72–79.
9. Jimenez CC, Corcoran MH, Crawley JT et al. National athletic trainers’ asso-ciation position statement: management of the athlete with type 1 diabetes mellitus. J Athl Train 2007; 42: 536–545.
10. Peirce NS. Diabetes and exercise. Br J Sports Med 1999; 33: 161–172; quiz 172–173, 222.
11. Borg GA. Psychophysical bases of perceived exertion. Med Sci Sports Exerc 1982;
14: 377–381.
12. Chiang JL, Kirkman MS, Laffel LMB, Peters AL, Type 1 Diabetes Sourcebook Authors. Type 1 diabetes through the life span: a position statement of the American Diabetes Association. Diabetes Care 2014; 37: 2034–2054. 13. Hopkins D. Exercise-induced and other daytime hypoglycemic events in patients
with diabetes: prevention and treatment. Diabetes Res Clin Pract 2004;
65(Suppl. 1): S35–39.
14. Riddell MC, Iscoe KE. Physical activity, sport, and pediatric diabetes. Pediatr Diabetes 2006; 7: 60–70.
15. Taplin CE, Cobry E, Messer L, McFann K, Chase HP, Fiallo-Scharer R. Preventing post-exercise nocturnal hypoglycemia in children with type 1 diabetes. J Pediatr 2010; 157: 784–788.e1.
16. Desjardins K, Brazeau A-S, Strychar I, Rabasa-Lhoret R. Are bedtime nutritional strategies effective in preventing nocturnal hypoglycaemia in patients with type 1 diabetes? Diabetes Obes Metab 2014; 16: 577–587.
17. Hammond P, Dudley S. Insulin pump therapy and exercise. In: Nagi D, ed. Exercise and Sport in Diabetes. Chicester: John Wiley & Sons, Ltd, 2005; 121–129.
18. Edelmann E, Staudner V, Bachmann W, Walter H, Haas W, Mehnert H. Exercise-induced hypoglycaemia and subcutaneous insulin infusion. Diabet Med 1986; 3: 526–531.
19. Grimm JJ. Exercise in type 1 diabetes. In: Nagi D ed. Exerc Sport Diabetes, 2nd edn. John Wiley & Sons, Ltd, 2005: 25–44.
20. Jeandidier N, Riveline J-P, Tubiana-Rufi N et al. Treatment of diabetes mellitus using an external insulin pump in clinical practice. Diabetes Metab 2008; 34: 425–438.
21. Frohnauer MK. Adjustment of basal lispro insulin in CSII to minimize glycemic fluctuations caused by exercise. Diabetes Res Clin Pract 2000; 50: S80. 22. Diabetes Research in Children Network (DirecNet) Study Group, Tsalikian E,
Koll-man C et al. Prevention of hypoglycemia during exercise in children with type 1 diabetes by suspending basal insulin. Diabetes Care 2006; 29: 2200–2204. 23. Franc S, Dardari D, Biedzinski M et al. Type 1 diabetes: dealing with physical
activity. Diabetes Metab 2012; 38: 466–469.
24. Frenzke H, Varnhorn A, Schulze H, Nauck MA. A prospective randomised study in patients with type 1 diabetes on the need for additional carbohydrates with standardised physical activity to prevent hypoglycemia. Diabetologia 2013;
56(Suppl. 1): S85.
25. Yardley JE, Iscoe KE, Sigal RJ, Kenny GP, Perkins BA, Riddell MC. Insulin pump therapy is associated with less post-exercise hyperglycemia than multiple daily injections: an observational study of physically active type 1 diabetes patients. Diabetes Technol Ther 2013; 15: 84–88.
26. Admon G, Weinstein Y, Falk B et al. Exercise with and without an insulin pump among children and adolescents with type 1 diabetes mellitus. Pediatrics 2005;
116: e348–355.
27. Mallad A, Hinshaw L, Schiavon M et al. Exercise effects on postprandial glucose metabolism in type 1 diabetes: a triple-tracer approach. Am J Physiol Endocrinol Metab 2015; 308: E1106–1115.
28. Jankovec Z, Krcma M, Gruberova J et al. Influence of physical activity on metabolic state within a 3-h interruption of continuous subcutaneous insulin infusion in patients with type 1 diabetes. Diabetes Technol Ther 2011; 13: 1234–1239.
29. Robertson K, Adolfsson P, Scheiner G, Hanas R, Riddell MC. Exercise in children and adolescents with diabetes. Pediatr Diabetes 2009; 10(Suppl. 12): 154–168. 30. Chu L, Hamilton J, Riddell MC. Clinical management of the physically active
patient with type 1 diabetes. Phys Sportsmed 2011; 39: 64–77.
31. Fayolle C, Brun JF, Bringer J, Mercier J, Renard E. Accuracy of continuous subcutaneous glucose monitoring with the GlucoDay in type 1 diabetic patients treated by subcutaneous insulin infusion during exercise of low versus high intensity. Diabetes Metab 2006; 32: 313–320.


![Figure 3. Late post-lunch exercise sessions. Median [+ interquartile range (IQR) Q1–Q3 ] continous glucose monitoring glucose (grey curves) and median (+ IQR Q1–Q3 ) blood glucose (red curves)](https://thumb-eu.123doks.com/thumbv2/123doknet/14097177.465229/5.892.86.809.571.727/figure-exercise-sessions-median-interquartile-continous-glucose-monitoring.webp)