A simple approach to fairer hospital
benchmarking using patient
experience data
BARBARA M. HOLZER1AND CHRISTOPH E. MINDER2 1
Division of Internal Medicine, University Hospital Zurich, Zurich, Switzerland, and2Horten Centre, University Hospital Zurich, Zurich, Switzerland
Address reprint requests to: Barbara Holzer, Division of Internal Medicine, University Hospital Zurich, Raemistrasse 100, 8091 Zurich, Switzerland. Tel: þ41-44-255-99-57; Fax: þ41-44-255-44-26; E-mail: [email protected]
Accepted for publication 4 July 2011
Abstract
Objective. To determine the factors contributing most to variability in patient experience in order to present approaches for fairer benchmarking of hospitals and for quality improvement.
Design. Secondary analysis of data from a widely used survey on patient experience.
Setting. Inpatients from all 24 acute hospitals in the Canton of Bern in Switzerland. Data collection followed the standardized and validated Picker Institute methodology for a period of 13 weeks in the fall/winter of 2005.
Participants. Inpatients age 18 years and older (n ¼ 14 089), discharged within the sampling period.
Main outcome measures. ‘Patient experience’, measured by the total Picker Problem Score (PPS) and by six domain scores (care, communication, respect, cooperation, organization, discharge management).
Results. In regression analysis, the patient factors self-reported health, age and education explained the highest proportion of variability in the PPS (4.8, 2.2 and 0.7%, respectively). Multiple linear adjustment for factors associated with patients removed between 29 and 33% of variability between hospital categories. The domain score means varied from under 5% for ‘respect towards the patient’ to 34% for ‘discharge management’. Ranking of hospitals by domain scores differed from the ranking based on the total PPS.
Conclusions. Statistical adjustment for patient mix and additional stratification for some hospital factors make benchmarking using patient survey data fairer and more transparent. Use of our approach for presenting quality data may make interpret-ation easier for the different target groups and may enhance the relevance of such informinterpret-ation for decision-making.
Keywords: patient experience, patient mix adjustment, benchmarking, quality improvement, hospital care, patient satisfaction
Introduction
As quality and quality improvement become part of the moni-toring of hospital performance, the publication of outcome data from hospitals is becoming standard practice. Among these quality data, evaluation of the patient’s perspective is a major component for measuring the ability of the health system to meet patients’ expectations and needs. These results serve patients in selecting a hospital and help providers of hospitals to focus on improvement efforts and monitor quality in their hospitals and to compare themselves to bench-marks. They help policy-makers to monitor and promote quality of care and competition among hospitals [1].
By using validated and standardized survey instruments, survey providers assure the production of reliable data. Comparisons of these data between hospitals inevitably raise the question of fairness. Several studies investigated factors that influence patient experience scores [2–4]. Based on these studies, it is now commonly accepted that to avoid biased comparisons, it is necessary to adjust patient experience scores for patient or hospital characteristics [1, 5, 6]. The Centers for Medicare & Medicaid Services in the USA defined a standard for adjustments needed for the publication of their hospital data [7]. Researchers in other countries such as the Netherlands [8] or Sweden [9] are currently about to follow a similar approach. In Switzerland, recommendations
for the publication of medical outcome data exist [10], but so far no standard has been defined.
The aim of this study is to present standardized and rela-tively simple methods for analyzing and using patient experi-ence data for quality improvement and for publication in a form that facilitates clear and easy interpretation. Our work comprised three steps: first, identifying the factors contribut-ing most to variability in patient experience on the patient and hospital levels; second, presenting approaches to achiev-ing fair and transparent assessments of hospitals for internal and external benchmarking; third, suggesting methods for using patient experience data to identify areas for improvement.
Materials and methods
This study is based on a secondary analysis of data collected using the Picker Institute questionnaire for adult inpatients (age 18 years and older) in all 24 hospitals and clinics with acute care units in the Canton of Bern, Switzerland, in the fall/winter of 2005. There were 16 public and 8 private hos-pitals, with an average of 162 beds and an average of 6254 discharges (minimum 632 to maximum 33 704) per year [11]. A total of 26 155 questionnaires were sent out; the overall response rate was 58.5% (33.5 – 66.8%). The database consisted of 15 294 inpatient questionnaires; 92.1% of these returned questionnaires (n ¼ 14 089) were sufficiently com-plete to be included in further analyses. Each hospital con-tributed between 113 and 2807 useable questionnaires.
The Picker Institute methodology has been described and examined in various studies [12–16]. The Picker survey instrument is guided by the aim of fostering patient-centred care in health services; it is a questionnaire eliciting patient reports on concrete aspects of their hospital stay. In this study, the questionnaire was sent home 3 weeks following the patient’s discharge from hospital; one reminder was sent after 3 weeks of no response. The main outcome variable used in this study was the Picker Problem Score (PPS), i.e. the percentage of survey questions on which patients rated their inpatient care experience as less than good. The PPS-based measures were slightly modified for this study and were defined and calculated as follows:
† PPS: calculated over 35 relevant questions per patient † Total PPS: average of the ( patient-specific) PPS over all
patients in all participating hospitals
† Domain scores: similar to PPS but calculated over a subset of questions (domain).
To obtain more detailed results and a better insight we subdi-vided the Picker questionnaire into six domains (Table 1). Domains were defined on the basis of considerations of face validity, supplemented by a factor analysis.
The adjustment factors are listed in Table2. These factors were classified into three groups ‘patient factors’, ‘hospital factors’ and ‘process factors’. Our interest focused on the influence of these factors on the PPS and the domain scores. Three items were not used in any domain (e.g. patients’ intention to recommend the hospital to others). Domain
scores were computed similar to the PPS for all domains listed in Table1based on all questions in the domain.
Statistical analysis
Multiple linear regression incorporating all factors in Table1 was used to assess the relative influence of each factor on the PPS using partial R2. Multiple linear regression with all patient factors was used to compute adjusted PPS (aPPS). PPS, total PPS and domain scores were calculated as raw
. . . .
Table 1 Domains (study outcome)
Domains Content
Care (five items) Confidence and trust towards health professionals, opportunities to talk about fears about treatment as well as about individual worries and fears
Communication (six items)
Clear answers to questions of the patient, explanations about results of examinations, involvement of relatives and family members Respect (six items) Respect and dignity towards
patient, communication in front of patient as if he/she were not there Cooperation (two items) Teamwork between health
professionals, inconsistent information of patient Organization
(eight items)
Organization of processes (incl. waiting times), availability of health professionals, timely support of patient (e.g. call button) Discharge management
(five items)
Information about purpose of the medication, side effects, danger signals, information about resumption of daily activity, involvement of relatives and family members to support recovery
Table 2 Adjustment factors Patient
factors
Gender, age (three levels), self-reported health (five levels), education (five levels), marital status (six levels), health insurance (three levels)
Hospital factors
Public vs. private hospital (legal status) Health service classification of hospitals (four levels)
Process factors
Mode of admission (planned/emergency) Service department (surgery, medicine, gynaecology)
scores and adjusted scores (aPPS). Model assumptions were checked using various plots (residual, mean observed vs. expected PPS); regression residuals had a skewed distri-bution; regression residuals of log-transformed PPS were more nearly normal. We nevertheless used a linear model with raw, untransformed PPS as response. The influence of non-normality was assessed by comparing results based on raw and log-transformed PPS, respectively: it was limited and did not affect conclusions.
We proceeded in four steps. First, the mean PPS by cat-egories of each factor examined were tabulated. All factors were categorical; age was coded in three levels. The variability of the PPS was determined between categories of hospital and process factors. Second, the relative influence of each factor on the PPS was assessed using the partial R2. Third, adjusted PPS (aPPS) were calculated using multiple linear regression with patient factors only and tabulated by hospital and process factors. Variability of aPPS and raw PPS between hospital categories was calculated and compared. Fourth, similar analyses were done for each of the six domains. A synthesis of the results of steps 1 to 4 led to proposals for fair internal and external benchmarking.
Results
The mean age of the study population was 58.3 years (18 – 100); 53.3% of the respondents were women; 55.4% had a middle level of education (secondary level); 36.2% were emergency patients. Of all patients, 30.5% rated their self-reported health status as very good/excellent, 43.8% as good and 25.7% as fair to poor. The total PPS was 14.2%. Younger patients (age 18 – 40 years) had higher PPS, i.e. more problems with their inpatient care experi-ence (mean: 17.7%) than patients age 41 – 70 (12.6%) or patients older than 70 (15.1%).
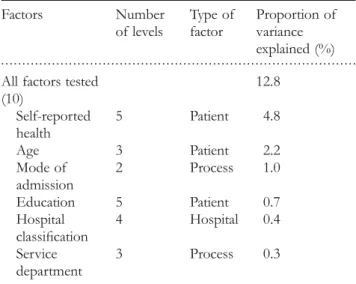
Some results of a multiple linear regression of various factors on the PPS are presented in Table3. The overall frac-tion of variance explained was 12.8% (R2¼ 0.128). Each factor is listed in the table with its partial R2, showing its relative importance. All factors not listed here (see Table 1) explained ,0.2% of the variance. P values were significant for all investigated factors (P , 0.0005).
Factors contributing to the variability in patient experience
In this first step of our analyses, we found that the factors having the greatest effect on the PPS, i.e. explaining most of the variance in the PPS, were self-reported health, age, mode of admission and education. Three of these factors are patient factors and one is a process factor; hospital factors were of lesser importance.
The total fraction of variance explained was 12.8%, which appears to be modest. However, it must be seen in the light of what is mathematically possible. To determine an upper limit of variance explained, we simulated PPS data using the regression equation from Table 3, treating the PPS as a
binomial variate. We obtained explained variances of around 50%, the remaining variance being due to random binomial variation; higher values than 50% are impossible for math-ematical reasons. Thus, the explained variance of 12.8% cor-responds to about one-quarter of all the variance one can hope to explain, a value in line with values for the explained variance found commonly in empirical investigations in the social sciences.
Patient-factor adjustment
To obtain fair comparisons between hospitals or hospital units (e.g. service departments), the next step was to statisti-cally adjust the PPS for the influence of patient factors. In this study, we obtained adjusted PPS (aPPS) using multiple regression with the patient factors as predictors. From the resulting regression equation, we calculated the aPPS for each patient in the study by adding the raw mean PPS (over all patients) to the deviation of the individual PPS from its predicted value from this regression. In Table4raw PPS and aPPS are compared by hospital and process factor levels. The rows labelled ‘SD’ report the standard deviation between the PPS or aPPS of factor levels, respectively. The SD is a measure of variability between the levels of each factor. The correction of the PPS for patient factors reduced the varia-bility between hospital categories. The reduction in SD through adjustment between hospital and process categories amounts to about one-third (29.0 – 43.7%), illustrating that an important part of the differences in PPS between the levels of any hospital or process factor is due to differing patient mix. The biggest reduction of PPS by adjustment was found in medical departments and planned admission and the biggest increase in speciality clinics (only a small number). Nevertheless, there remain sizable differences between the categories of all factors.
. . . .
Table 3 Patient, hospital and process factors in order of the fraction of variance explained
Factors Number of levels Type of factor Proportion of variance explained (%) All factors tested
(10) 12.8 Self-reported health 5 Patient 4.8 Age 3 Patient 2.2 Mode of admission 2 Process 1.0 Education 5 Patient 0.7 Hospital classification 4 Hospital 0.4 Service department 3 Process 0.3
Adjusted PPS by domains
The next step was to create sub-scores to assess certain dimensions of quality in care to make benchmarking more informative, to allow quick identification of problem areas and thus to enable quality improvement. For this purpose we defined six domains (see Table 1) and calculated adjusted partial PPS (aPPS) for each of them. The differences between the domain aPPS scores were large, with an average aPPS of .34% for ‘discharge management’, about 20% for the interpersonal aspects of ‘care’ and about 17% for ‘com-munication’ between patient and health professionals (the
most problematic domains in Fig. 1). These means were affected to a lesser extent only by process and hospital factors.
In our results the general graph pattern of the means of domain PPS by hospital and process factors was the same for all domains. For example, for all domains the mean aPPS was the highest for the service department medicine, slightly lower for surgery and the lowest for gynaecology. Comparably, patients with emergency admis-sion had a higher average aPPS than patients with planned admission (Fig. 1).
. . . .
Table 4 Raw and adjusted PPS averages by hospital and process factors
Levels Raw PPS Adjusted
PPS (aPPS)a
Difference raw minus adjusted PPS
% Reduction in SD Hospital factors
Legal status (%) Public 16.1 15.5 0.6
Private 11.2 12.2 21.0 SDb 2.38 1.61 0.78 32.8 Classification of hospital, modified following [11] Large 16.9 16.2 0.7 Medium 13.2 13.2 0.0 Small 13.0 13.7 20.8 Specialty clinics 10.2 12.4 22.2 SDb 1.96 1.39 0.57 29.0 Process factors
Mode of admission (%) Emergency 18.0 16.6 1.4
Planned 12.1 12.9 20.8
Unknown 14.0 14.0 20.1
SDb 2.72 1.73 0.99 36.4
Service department (%) Surgery 13.6 14.3 20.7
Medicine 16.9 15.1 1.8
Gynaecology 11.2 11.3 20.1
Unknown 12.1 12.5 20.4
SDb 1.74 0.98 0.76 43.7
a
The aPPS column shows means based on adjusted PPS.bSD, standard deviation; for details see text.
Benchmarking by domains
To illustrate how domain aPPS can be used for benchmark-ing, we calculated the ranks per domain of four public hospi-tals (Table 5), selected out of a total of 16. The aim of transforming the aPPS to ranks was to create a simple and comprehensible presentation, with comparable scaling for all domains. Rank 1 corresponds to the lowest aPPS for this domain and rank 16 to the highest. The four hospitals were chosen specifically to show the variability of ranks depending on the domain within one single hospital and to show the changes before and after patient-factor adjustment.
Hospital B, with Rank 4 for the total aPPS, was evalu-ated as a generally good hospital, but in the domain ‘cooperation’ between health professionals, it has the highest rank of all 16 hospitals—that is, it was rated the worst. Hospital C, with a middle rank of 8, has a very good rank in the domain ‘discharge management’. Hospitals A and D are examples of good and worse per-formance, with total Ranks of 3 and 11. Again, both hos-pitals show ratings in single domains that are a lot worse or better than their ranks in other domains.
Table 5 also illustrates the changes in ranks before and after adjustment for all of the selected hospitals. Adjustment for patient factors led to a change in rank in 59% of all domain ranks over all 16 hospitals. For the total PPS per hospital, adjustment led to a better rank for 8 out of the 16 hospitals, to no change for four hospitals and to a worse rank for another four hospitals.
Discussion
In this study, we assessed 10 patient and hospital/process factors and their impact on patient experience as measured by the PPS. Differences in patient experience scores appeared to occur mainly at the patient level and to a lesser extent at process and hospital levels.
Our results concur with the findings of several previous studies using different survey methodologies, namely, that of the patient factors, patients’ self-reported health and age [2, 4–6, 8] and to a lesser extent education [5, 6, 8] are the strongest predictors influencing patient experience scores.
The results support the hypothesis that these patient charac-teristics have an impact on patients’ experience.
We found one study [17] reporting a nonlinear relationship between age and patient experience similar to the findings in our study population, where patients younger than age 40 and older than 70 reported more problems with their hospi-tal care than the middle-aged patients did.
Among the process and hospital factors, the mode of admission had the strongest effect on the patients’ experi-ence; patients admitted through emergency were less satisfied than patients with a planned admission. This factor has been rarely examined in previous studies; only Rahmqvist and Bara [9] had similar results in an outpatient survey.
Patient experience showed large within-hospital variation even after patient-mix adjustment when looking at level service departments [1,3,6,9,18,19]. Patients in the gynae-cology department (excluding women with childbirth) tended to have lower PPSs than patients in medicine or surgery. Furthermore, in all of the studies including ours, the hospital factors examined did not seem to be major determinants of patient experience.
Nevertheless, hospital factors should be taken into account in stratification as an additional measure to assure more meaningful comparisons, as it supports efforts towards more transparency of the data. Although the fraction of 12.8% of variance explained by all the examined factors in our study seems modest, it corresponds to other findings in this kind of survey [5,6].
In our analyses we made several choices. The first was to group the factors into ‘patient’, ‘hospital’ and ‘process’ factors. After analyzing the threefold subdivision, we can say that a division into patient and hospital factors would be suf-ficient: analyses and conclusions would remain essentially the same.
We also chose to define domains so that they closely pertain to distinct interactions between patient and health professionals. There are a few other studies that investigated hospital care by quality dimensions similar to our domains [8, 18,20]. Other classifications, such as separating care into nursing and medical care, could be considered. In any case, communication, including information of the patient, and discharge management are clearly important areas for improvement.
. . . . . . . .
Table 5 Ranks based on raw and adjusted domain PPS (total aPPS) for four selected public hospitals (out of 16)
Domains Ranks of Hospital
A Ranks of Hospital B Ranks of Hospital C Ranks of Hospital D
Raw Adjusted Raw Adjusted Raw Adjusted Raw Adjusted
Care 10 11 3 4 9 9 3 6 Communication 4 4 3 5 9 9 12 14 Cooperation 2 2 14 16 13 10 11 11 Respect 1 1 2 4 9 9 11 11 Organization 2 3 5 6 11 11 8 8 Discharge management 9 10 3 4 2 2 7 9 Total aPPS 4 3 2 4 9 8 7 11
With regard to improving patient experience, the presen-tation of differences in our study between the domain ranks within and between hospitals (see Table 4) shows that this approach is successful in capturing areas for improvement. The presentation of ranks instead of adjusted PPSs provides a quick view of the strengths and weaknesses. Nevertheless, the adjusted domain scores can be used as another form of presentation, depending on the target group (e.g. patients). This approach of presenting benchmarks is transparent and also enables easy identification of examples of good practice. Other approaches and methodologies, such as the Dutch model for academic hospitals [20], follow a different aim by presenting only the best-practice hospitals for several dimen-sions of quality.
In the literature there is an international consensus [1, 7, 8, 19] that using statistical adjustment for patient mix (and survey mode) is necessary for valid comparison of patient experience scores across hospitals. Researchers agree that the effect of this adjustment is modest but the ranking of hospi-tal may be affected substantially.
Another choice that we made was to use a linear model for adjustment of the expected value of PPSs. This model for patient-mix adjustment is currently used for comparisons of national HCAHPS hospital data in the USA [7]. In fact, we are not aware of any analyses based on nonlinear models. The linear approach has the advantage of independent effect sizes, e.g. the effect of age on the patient experience score is the same for patients reporting good health as for those reporting bad health, etc. However, considering the non-normality of the distribution of regression residuals, we believe that there is need for further investigation in this area.
Limitations
This study is subject to the main limitations associated with patient experience surveys, response rate and non-response bias.
Our response rate of 58.5% was fairly good compared with other international Picker Institute surveys [15], and it was also at the level of similar studies with methodologically different mail surveys [8,18,21].
The non-responders are a major concern of this kind of survey, although research [22] showed that the effect is negli-gible on the outcome of patient experience. According to Centers for Medicare & Medicaid Services [7], after the implementation of the statistical adjustment for patient mix and for survey mode (mail or telephone survey), no further adjustment for non-response was necessary. Under these conditions, the potential impact of non-response bias on the comparison between hospitals was reported to be small.
Conclusions
In this study, we presented a simple approach for using patient experience data to identify areas of improvement quickly and to assure and promote good practice in hospital
care (by subdividing adjusted total patient experience scores into domain scores). To increase the usefulness of patient experience data for benchmarking, we transformed domain scores into ranks. The changes in ranking after the adjust-ment for patient factors underline the importance of this statistical adjustment. Adjustment and ranking permit a fairer and more transparent comparison of hospitals. In any case, it remains to be seen whether a methodology for the publi-cation of quality data like the one we propose here will lead to improvements in patient experience scores in the future.
Acknowledgements
The authors thank the Picker Institute Europe, Oxford, UK, and especially Dr. Penny Woods, Chief Executive, for their cooperation.
Funding
This work (data collection and analysis) was supported by Quality Improvement in Acute Inpatient Care of Hospitals in the Canton of Bern (QABE), which also gave us permission to publish the results of the 2005 QABE patient experience survey.
References
1. O’Malley AJ, Zaslavsky AM, Elliott MN et al. Case-mix adjust-ment of the CAHPS hospital surveys. Health Serve Res 2005;40:2162 – 81.
2. Hall JA, Dornan MC. Patient sociodemographic characters as predictors of satisfaction with medical care: a meta-analysis. Soc Sci Med1990;30:811 – 8.
3. Young GJ, Meterko M, Desai KR. Patient satisfaction with hos-pital care: effects of demographic and institutional character-istics. Med Care 2000;38:325 – 34.
4. Jaipaul CK, Rosenthal GE. Are older patients more satisfied with hospital care than younger patients? J Gen Intern Med 2003;18:23 – 30.
5. Rahmqvist M. Patient satisfaction in relation to age, health status and other background factors: a model for comparisons of care units. Int J Qual Health Care 2001;13:385 – 90.
6. Hargraves JL, Wilson IB, Zaslavsky AM et al. Adjusting for patient characteristics when analyzing reports from patients about hospital care. Med Care 2001;39:635 – 41.
7. Centers for Medicare & Medicaid Services. Mode and patient-mix adjustment of the CAHPSw Hospital Survey (HCAHPS), April 30, 2008 [ paper on the Internet]. http://www. hcahpsonline.org/modeadjustment.aspx (14 December, 2010, date last accessed).
8. Hekkert KD, Cihangir S, Kleefstra SM et al. Patient satisfaction revisited: a multilevel approach. Soc Sci Med 2009;69:68 – 75.
9. Rahmqvist M, Bara AC. Patient characteristics and quality dimensions related to patient satisfaction. Int J Qual Health Care 2010;22:86 – 92.
10. Swiss Academy of Medical Sciences (SAMS). Erhebung, Analyse und Vero¨ffentlichung von Daten u¨ber die medizinische Behandlungsqualita¨t: Empfehlungen [The collection, analysis and publication of data about quality of medical treatment: recommen-dations]. Schweizerische A¨ rztezeitung 2009;90:26/27:1044–54. 11. Federal Office of Public Health. Key data of the Swiss Hospitals
2005. 2007. http://www.bbl.admin.ch/bundespublikationen 12. Cleary PD, Edgman-Levitan S, Walker J et al. Data watch:
patients evaluate their hospital care. A national survey. Health Aff1991;10:254 – 67.
13. Cleary PD, Edgman-Levitan S, Walker J et al. Using patient reports to improve medical care: a preliminary report from ten hospitals. Qual Manag Health Care 1993;2:31 – 8.
14. Bruster S, Jarman B, Bosanquet N et al. National survey of hos-pital patients. Br Med J 1994;309:1542 – 6.
15. Coulter A, Cleary PD. Patients’ experience with hospital care in five countries. Health Aff 2001;20:244 – 52.
16. Jenkinson C, Coulter A, Bruster S. The Picker patient experi-ence questionnaire: development and validation using data from
in-patient surveys in five countries. Int J Qual Health Care 2002;14:353 – 8.
17. Moret L, Nguyen JM, Volteau C et al. Evidence of a non-linear influence of patient age on satisfaction with hospital care. Int J Qual Health Care2007;19:382 – 9.
18. Sjetne IS, Veenstra M, Stavem K. The effect of hospital size and teaching status on patient experiences with hospital care. Med Care2007;45:252 – 8.
19. Elliott MN, Zaslavsky AM, Goldstein E. Effects of survey mode, patient mix, and nonresponse on CAHPS hospital survey scores. Health Serve Res 2009;44:501 – 18.
20. Kleefstra SM, Kool RB, Veldkamp CM et al. A core ques-tionnaire for the assessment of patient satisfaction in aca-demic hospitals in The Netherlands: development and first results in a nationwide study. Qual Saf Health Care 2010;19:e24.
21. Perneger TV, Kossovosky MP, Cathieni F et al. A randomized trial of four patient satisfaction questionnaires. Med Care 2003;41:1343 – 1552.
22. Lasek RJ, Barkley W, Harper DL et al. An evaluation of the impact of non response bias on patient satisfaction surveys. Med Care1997;35:646e52.