An Asynchronous, Low-Power Architecture for Interleaved
Neural Stimulation, using Envelope and Phase Information
by
Ji-Jon Sit
Bachelor of Science in Electrical Engineering Bachelor of Arts in Computer Science
Yale University, 2000
Master of Science in Electrical Engineering and Computer Science Massachusetts Institute of Technology, 2002
Submitted to the Department of Electrical Engineering and Computer Science in Partial Fulfillment of the Requirements for the Degree of
Doctor of Philosophy in Electrical Engineering and Computer Science at the
Massachusetts Institute of Technology May 2007
@ 2007 Massachusetts Institute of Technology. All rights reserved.
Signature of Author... .... ...
Department of Electrical Engineering and Computer Science May 25, 2007
Certified by...
-,...
Rahul Sarpeshkar
AssociatePFrofessoryf Electrical Engineering and Computer Science Thesis SupervisorAccepted by... . ... ...
Arthur S. Smfith
MASSACHUSETTS INSTiE Chairman, Committee on Graduate Students OF TECHNOLOGY Department of Electrical Engineering and Computer Science
An Asynchronous, Low-Power Architecture for Interleaved
Neural Stimulation, using Envelope and Phase Information
by
Ji-Jon Sit
Submitted to the Department of Electrical Engineering and Computer Science On May 25, 2007 in Partial Fulfillment of the Requirements for the Degree of
Doctor of Philosophy in Electrical Engineering and Computer Science
ABSTRACT
This thesis describes a low-power cochlear-implant processor chip and a charge-balanced stimulation chip that together form a complete processing-and-stimulation cochlear-implant system. The processor chip uses a novel Asynchronous Interleaved Stimulation (AIS) algorithm that preserves phase and amplitude cues in its spectral input while simultaneously minimizing electrode interactions and lowering average stimulation power per electrode. The stimulator chip obviates the need for large D.C. blocking capacitors in neural implants to achieve highly precise charge-balanced stimulation, thus lowering the size and cost of the implant. Thus, this thesis suggests that significant performance, power and cost improvements in the current generation of cochlear implants may be simultaneously possible.
The 16-channel -90 square mm AIS processor chip was built in a 1.5pm VLSI process and consumed 107iW of power over and above that of its analog spectral processing front end, which consumed 250pW and which has been previously described. The AIS processor was found to faithfully mimic MATLAB implementations of the AIS algorithm. Two perceptual tests of the AIS algorithm with normal-hearing listeners verified that AIS signal reconstructions enabled better melody and speech recognition in noise than traditional envelope-only vocoder simulations of cochlear-implant processing. The average firing rate of the AIS processor was found to be significantly lower than in traditional synchronous stimulators, suggesting that the AIS algorithm and processor can potentially save power and improve hearing performance in cochlear-implant users.
The stimulator chip was built in a 0.7sm high-voltage VLSI process and performed dynamic current balancing followed by a shorting phase. It achieved <6nA of average DC current error, well below the targeted safety limit of 25nA for cochlear-implant patients. On +6 and -9V rails, the power consumption of a single channel of this chip was 47piW when biasing power is shared by 16 channels. It puts out a charge-balanced stimulation pulse whenever it receives an asynchronous input signal from an AIS processor encoding phase information and 7-bit amplitude information, thus making the AIS processor chip and stimulator chip fully compatible in the cochlear-implant system.
The AIS algorithm and charge-balancing circuits described in this work may be useful in other nerve-stimulation prosthetics where good fidelity in input-information encoding, minimization of electrode interactions, low-power strategies for stimulation, and compact charge-balanced stimulation are also important.
Thesis Supervisor: Rahul Sarpeshkar
Acknowledgements
Issac Newton famously wrote to Robert Hooke in 1676, "If I have seen a little further it is by standing on ye shoulders of Giants." Recently I was thinking to myself, I have rather finished my Ph.D. only because I have been carried upon a Giant number of shoulders. Sort of like the paralytic, who was carried by his friends up on a roof, and through the tiles down to Jesus for healing (in Luke 5). I would like to give thanks to these shoulders here.
My friends in my fellowship at MIT and at Park Street Church have all played a crucial part in my "great deliverance," by wrestling with God for me in prayer. I believe God was delighted to encourage all of them by answering their common request for me to finish my thesis and pass my defense with His grace!
I also have much to be thankful for because my research group is without exception, made up of not just gifted, but more importantly, humble and upright individuals. I think it is hard to find this combination anywhere, period. I have learnt a lot from them and count myself blessed to have worked with all of them, past and present - in rough order of when I met them over my 7 years - Heemin and Maziar, Micah and Chris and George, Alex and Baker, Serhii and Lorenzo and Tim, Soumyajit and Keng Hoong, Scott and Pok and Ben. In the same breath I cannot fail to mention our administrative assistants over the years: Travis, Mary, Rose and Gretchen have also a spot in my heart for so much behind-the-scenes support.
Without the guidance and assistance from Andrew Oxenham and Andrea Simonson, I would have been at a loss in how to undertake the research pertaining to psychoacoustics, and the opportunity to work with them at MIT was really fortuitous. Mike Perrott's advice on writing my thesis around the figures, collecting only the absolutely essential data, and improving the clarity of my technical descriptions made a big difference. But what was even more valuable to me is the support he communicated along with all the details. I would probably not have come to MIT if not for the financial support from Advanced Bionics, through Mike Faltys and Van Harrison, and I'm also grateful that through Mike I've had a very smooth road to getting a job there even before graduation.
for taking me in, tirelessly searching for funds to support me, and training me up with invaluable research skills. But I appreciate even more his unwavering pursuit of truth and real insight, never never never giving up, and how he sees the lab bench as "talking with God" because he's seen so clearly that all the moments of truth that we can learn from God's other book are revealed not so much at the computer but in the lab.
My family, Mum, Pop and Mae, have never failed to support me with their love and concern for my well-being and future. They have always wished the best for me, and I have not the slightest doubt in my mind about that fact - which has formed the bedrock of my ability to enjoy independence as an adult, and to still pursue child-like dreams wherever they may take me. This firm, unshakable foundation is priceless. My wife's family, Papa, Mummy, and Jeffrey have also been recently grafted to me but are no less precious - their love and support is as if it comes from much further back in time - and in fact I believe it does. This is also the gift of God.
But the biggest gift of God in my time here is my beautiful wife Felicity - her unconditional love no matter how grumpy and unlovable I make myself at times is the most clear and present reflection of God's love for me. I believe that she loves me more than she loves herself - and she has shown it in countless sacrifices of time and energy to support me in everything she's seen me need. I love you, sweetiebear!
God deserves the highest thanks and honor for being the provider of all these blessings and more. He revealed Himself to me one year before grad school, perhaps knowing that it was just when I needed Him most. He is the One who gifted me to be able to attend MIT, granted me success in all I undertook, but above all else, granted me peace in my heart from the forgiveness of my sin in Jesus Christ. Without that peace, I am sure my mind and soul would have been too clouded and dark for me to do anything good. He is the source of all my inspiration, recorded in these pages, so I want all the glory to go to Him!
Does he who implanted the ear not hear? Psalm 94:9 (NIV)
TABLE OF CONTENTS
1. INTRODUCTION ...
8
2. BACKGROUND...9
2.1. Problems with synchronous stimulation... 9
2.2. What is phase information? ... ... ... ... ... ... .. ... . . 10
2.3. How important is phase information for CI users?... ... . . 11
2.4. How can phase information be delivered?... ... . . 12
2.5. Increased membrane noise in the relative refractory period... 14
2.6. Gamma distributions in the Interspike Interval Histogram (ISIH)... 15
2.7. Rate limitation in the auditory response ... 16
3. Asynchronous Interleaved Stimulation (AIS)... 17
3.1. The "race-to-spike" algorithm ... 17
3.2. Results from MATLAB simulations... 21
3.2.1. Capacitor Voltage and Inhibition Current waveforms... 22
3.2.2. Half-wave rectified inputs against spiking outputs... 22
3.2.3. Interspike-Interval Histograms ... 24
3.3. Power Savings... 25
3.4. AIS spike reconstruction and comparisons... 25
3.4.1. Channel-by-channel spike reconstruction... 26
3.4.2. Composite signal spike reconstruction ... 28
3.4.3. Hilbert decomposition and correlation... 29
3.4.4. What do they sound like?... 31
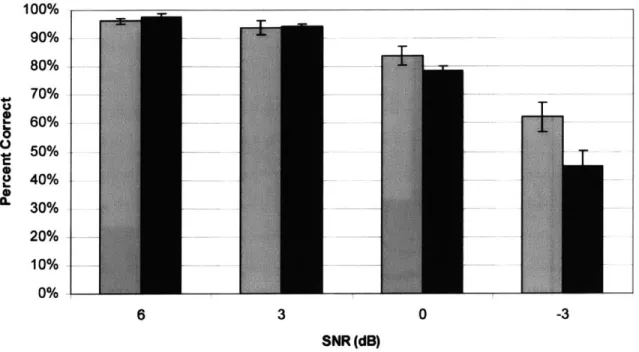
3.5. Perceptual tests in noise ... 32
3.5.1. M ethods... . 32
3.5.2. R esults... . 34
3.6. Discussion... 36
3.7. Summary of contributions... 37
3.7.1. Acknowledgements... 37
4. Analog Circuit Implementation of AIS...38
4.1. Motivation... 38
4.2. Circuit Specifications... 40
4.3. The "race-to-spike" circuit... 41
4.3.1. A translinear current gain input stage ... 42
4.3.2. A voltage winner-take-all topology with positive feedback... 45
4.3.3. A superbuffer to set attack and release time constants ... 46
4.3.4. Superbuffer small signal analysis ... 51
4.3.5. Interpretation of Ta and Tr, and "spikes" vs. "pulses"... 52
4.3.6. Device Sizing ... 52
4.4. Sensitivity Analysis ... 53
4.4.1. Noise from input gain stage ... 54
4.4.2. Input-referred noise from the voltage WTA ... 55
4.4.3. Input-referred offset from the voltage WTA ... 57
4.4.4. Vth variation due to doping ... 57
4.4.6. The minimum detectable signal... 58
4.5. Digital output protocol... 59
4.5.1. Multiplexing of channel data using a bank of tristates ... 60
4.5.2. M odification of LogADC output latches ... 60
4.6. Testing strategy and results... 61
4.6.1. 3-wire Serial Peripheral Interface (SPI) programming... 62
4.6.2. Using the Logic Analyzer ... 63
4.6.3. Filter calibration curves ... 64
4.6.4. Sound reconstruction results... 65
4.6.5. Interspike interval histogram s... 69
4.6.6. Power Consumption... 70
4.7. Summary of contributions... 71
5. Charge B alanced Stim ulation...
71
5.1. Background on electrodes... 71
5.2. Specifications... 72
5.3. Dynam ic Current Balancing ... 73
5.3.1. Overview of strategy to achieve charge balance... 73
5.3.2. Closed-loop sample and hold with low-leakage storage... 75
5.3.3. Analog circuit implem entation ... 77
5.3.4. NM OS current DAC and control switches ... 81
5.3.5. Logic Circuits... 84
5.3.6. Delay Circuits ... 87
5.4. Feedback and Noise analysis ... 88
5.4.1. Closed loop stability and bandwidth... 89
5.4.2. Effect of non-dominant poles from source follower... 92
5.4.3. Noise estim ate... 93
5.4.4. Final error estim ate ... 95
5.5. RC analysis on shorting (when is shorting beneficial?)... 96
5.5.1. Effectiveness of shorting... 96
5.5.2. Lim itation of shorting ... 98
5.6. Test Results... 103
5.6.1. Biphasic pulse on a resistor and capacitor load ... 104
5.6.2. Capacitor voltage waveform s ... 106
5.6.3. DAC error m easurements ... 108
5.6.4. Vp settling tim e m easurem ents... 111
5.6.5. Noise measurem ents ... 113
5.6.6. Power consumption... 115
5.7. Summ ary of contributions... 116
6. CO N CLU SIO N ...
117
7. A PPEN D ICES...118
7.1. Sample M ATLAB code to shift bits into AIS ABEP ... 118
8. REFEREN CES...119
8.1. List of Tables ... 119
8.2. List of Figures...119
1. INTRODUCTION
Many biomedical implants that seek to restore lost sensory function to disabled patients currently convey information to the nerves by pulsatile current stimulation, delivered via an implanted microelectrode array. The most prevalent method of pulsatile stimulation in current-generation implants is:
a) Synchronous (at a fixed stimulation rate, set by a fixed carrier frequency)
b) Amplitude-Modulated (a slowly-varying envelope of pulses reflects the sensory input intensity)
c) Time-Interleaved (no more than 1 or 2 electrodes fire a pulse at any one time) d) Biphasic (charge-balanced with equal positive and negative phases per pulse)
However, several problems have been identified with this current paradigm of neural stimulation. Of primary concern to us is that the fidelity of sensory input information that is conveyed to the nerves within this paradigm may be inherently limited by both (a) and (b). The reasons for this will be outlined in the Background section, and a new stimulation architecture which has the potential to improve the fidelity of information transmission will be presented in section 3.
A major discovery made in the early 90s was that (c), or interleaved stimulation, as part of a strategy called Continuous Interleaved Sampling (CIS), could greatly mitigate undesirable electrode interactions which would take place due to current spreading from nearby electrodes (Wilson, Finley et al. 1991). For the same reason, the proposed stimulation architecture in this thesis also enforces interleaved stimulation as a key requirement.
Finally, this thesis will also address a practical issue related to (d). In order to prevent electrolysis and potential rejection of the implant by the immune system, the positive and negative phases of each current pulse are designed to be precisely charge balanced so as to deliver negligible net charge into the body. Traditionally, a large series blocking capacitor on the order of
lOOnF
was sufficient to perform this function on every electrode channel, but in an effort to decrease the size and cost of the implanted electronics, it has become desirable to remove these DC-blocking capacitors. This thesis includes acurrent-drive system which will balance the charge pulses electronically, down to a current error which is considered physiologically safe.
This study focuses particularly on delivering auditory information to the cochlear nerve in cochlear implants (CIs), but could impact any multi-channel stimulation paradigm. In conclusion, this thesis presents a novel architecture for neural stimulation which seeks to improve the fidelity of sensory information when encoded and conveyed to the nervous system, from the point of receiving timing-rich sensory information to the point of driving current pulses to the implant electrodes.
2. BACKGROUND
2.1.
Problems with synchronous stimulation
It has been shown that acoustic stimulation of the ear produces much less across-fiber synchrony and much more within-fiber jitter than electrical stimulation (Kiang and Moxon 1972), due to stochastic properties of the inner-hair-cell synapse that are not reproduced in electrical stimulation.
In particular, there is unnecessary synchronization of the neural response to the fixed-rate electrical carrier, despite the carrier containing no information. Physiological studies have shown that many neural artifacts are produced, which are never seen under normal acoustic stimulation. For example, at low-rate (<500-800 Hz) stimulation, there is deterministic entrainment to the carrier (a neural discharge once per stimulus cycle), while at high-rate (>500-800 Hz) stimulation, there are severe distortions in the temporal discharge patterns caused by neural refractoriness (Litvak, Delgutte et al. 2003; Litvak, Smith et al. 2003).
Secondly but equally important, synchronous stimulation inherently excludes the possibility of delivering phase, or fine-timing information to implant users. If there is a significant amount of information which is not carried in the envelope amplitude alone, but also in the fine-time structure (or phase) of a signal, then an AM method of encoding envelope information on a fixed carrier frequency is simply unable to carry that
information. A mathematically more rigorous description of the envelope and phase components to a signal is described further in the next section.
All the problems above can be avoided if fixed-rate stimulation is replaced by some form of asynchronous stimulation that also takes the limits of neurobiology into account. For example, the stimulation should refrain from driving the nerves heavily into refractory-rate limited firing, where cross-fiber synchrony becomes pronounced.
2.2.
What is phase information?
It has been shown that any bandpass signal x(t) with center frequency oo and bandwidth W can be decomposed into quadrature components xc(t)-cos oo(t) + x,(t)-sin oo(t) (Siebert 1986) and hence also into envelope and phase components E(t) and (t) respectively, where x(t) = E(t)-cos[oot + (t)] as shown in (Figure 1).
X) x x(t) = x,(t)coswot+x,(t)sin ot
= E(t) cos[cot +
#(t)]
E(t) = x 2(t)+x|2(t)
-X()
x(t) =arctan( t)
Figure 1. Quadrature decomposition of a bandpass signal x(t)
As W can be as large as 2co, any bandlimited signal can be expressed in the general form of E(t)-cos 0(t) where the angle component 0(t) = oot + (t) when oo is specified. The angle component 0(t) or, equivalently (when oo is defined), the phase component *(t) is what we will refer to as the phase information in a signal. In the psychoacoustic literature, phase information is commonly referred to as "fine time structure" or "FM (frequency modulation) information," as it can be thought of as how rapidly the instantaneous frequency is being modulated, as opposed to "AM (amplitude modulation) information" in E(t).
HILBERT(O)
Hilbert transform
1
HLR-impulse response
R
t
--Figure 2. The Hilbert Transform in time and frequency domain representation
x(t) =xjt)coscot+x,(t)sincot
1()
xH(t) 4 x(t)*- = 5 ' [X(f)- HILBERT(f)] (1)
= x, (t) sin cot - x, (t) cos wot (since the Hilbert transform serves to exchange sine and cosine components) If we then define the analytic signal s(t) = x(t) +
j-xH(t),
s(t) 4 x(t) + JxH
= x,(t)[cos cot + j sin cot] - jx, (t)[cos cot + j sin oot] (2)
=[x.(t)- jx,(t)]eao't
We should note E(t) and 0(t) can then be obtained identically from s(t) as |s(t)| and
Zs(t) respectively:
Is(t)
= xEt)-jx,(t)j-te)*'(= 1x|(1 )+x,2(t) E(t)
4ds(t) = d[x,(t)-jx,(t)]+4 eO'O
= -rcax (1)
= arctan( ) )+Cot =#(t)+aOt =0(t)
x,(t)
When analyzing a signal, it is useful to use the Hilbert transform to look at the E(t) and
0(t) components separately, especially when comparing two signals, as they may be
similar in one component but not the other.
2.3. How important is phase information for CI users?
Experiments by Smith et al. have shown that the melody in music will be carried
primarily in the fine structure, or phase component (t), when the number of bandpass
analysis channels is smaller than 32 (Smith, Delgutte et al. 2002). The current generation of cochlear implants is limited to 16-24 analysis channels and delivers only E(t) at a fixed
rate, discarding 0(t) altogether (Wilson, Finley et al. 1991). Thus it is no surprise that CI users have trouble perceiving tones, much less the melody in a piece of music.
In an attempt to restore tonal perception, which is important in many Asian languages like Mandarin Chinese and Cantonese, researchers have attempted to modulate the
bandpass center frequencies oo by the fundamental frequency FO in each channel, with significant success in normal-hearing listeners (Lan, Nie et al. 2004). Lan et al.'s results can be interpreted as modulating 0(t) in each bandpass channel, to better approximate the true phase of the signal.
Furthermore, recent work by Nie et al. using acoustic simulations on normal-hearing listeners shows that speech recognition in noise is significantly improved by the addition of FM information, which is essentially what we refer to as 0(t), bandlimited to 400 Hz. They hypothesize that additional FM cues allow better segregation of a target sound into a perceptual stream that is more distinct from competing noise (Nie, Stickney et al.
2005).
This may be particularly important under conditions of low spectral resolution, such as those experienced by CI users (Fu, Shannon et al. 1998). An average CI user appears to receive at most 10 usable channels of spectral information, regardless of the number of implanted electrodes (Dorman, Loizou et al. 1998; Friesen, Shannon et al. 2001). So compared to normal-hearing listeners, who potentially have as many as 35,000 independent auditory nerve fibers that can convey spectral information, this is a severe limitation.
If CI users are able to utilize FM cues similar to normal-hearing listeners in addition to however many spectral channels they currently receive, then their ability to perceive speech and music should improve. Overall, these studies and others (Litvak, Delgutte et al. 2003; Litvak, Delgutte et al. 2003) suggest that the introduction of phase information, if delivered in ways that were usable, could provide substantial benefit for CI users.
Consequently, at least two published strategies have attempted to incorporate this additional information into new methods of neural stimulation for cochlear implants, by stimulating at the peaks (Vandali, Sucher et al. 2005) or zero-crossings (Grayden, Burkitt et al. 2004) of CI filter-band outputs. Unfortunately, these strategies have yet to show significant improvement in hearing performance for CI users.
2.4. How can phase information be delivered?
While there are many reasons to believe that phase information is important for higher fidelity listening, it is not at all clear how phase adjustments or frequency modulation
should be conveyed to a CI user. The variation of 0(t) is usually very wide and rapid, which means it cannot be delivered directly to neurons, which have an absolute refractory period and hence a bandwidth usually no larger than 1 kHz. With regard to CI users in
particular, perceptual data show that they cannot detect FM rate changes at base rates of
more than a few hundred Hz (Zeng 2002; Chen and Zeng 2004). Hence any scheme proposing to convey phase information to CI users must practically impose both a rate limitation and a bandwidth limitation on the delivery of 0(t) (Nie, Stickney et al. 2005).
One method is to utilize a zero-crossing detector: we know 0(t) is exactly 0 or 7c at the zero-crossings, and so delivering this information (e.g. by stimulating at the zero-crossing times) should provide the brain with fairly rich knowledge of what the phase should be, even with the bandlimiting requirement. However, to stimulate at zero-crossing times, we need some quick and intelligent way of choosing a zero-crossing in one channel over another, because zero-crossings may arrive simultaneously on different channels, and also very rapidly in the high-frequency channels.
Even if zero-crossing stimulation is not used, channel selection is still required to enforce interleaved stimulation, to avoid simultaneous interactions between electrodes. The channel selection process must also prevent one or two strong (high input-intensity) channels from dominating the firing and not giving other channels a chance to fire.
However, zero-crossing stimulation may not be the ideal method of delivering phase information. In the presence of noise, the reliability of zero-crossing times as an indicator of 0(t) rapidly deteriorates. Furthermore, stimulation at a deterministically precise phase in the signal is very different from what actually happens in biology, as nerves tend to fire at times which are smoothly distributed over all phases, but concentrated near the peak in signal energy (Litvak, Delgutte et al. 2003).
To introduce FM information into the stimulation paradigm, Nie et al. have proposed that either a carrier be frequency modulated with 0(t), or that the carrier itself be replaced by the band-limited 0(t) signal (Nie, Stickney et al. 2005). In this thesis, and in the spirit of Nie et al.'s latter idea, our objective is to convey 0(t) but depart entirely from the concept of either an AM or FM carrier.
Finally, in the search to uncover the neural coding of pitch perception, a study on tones transposed by high frequency modulation (to activate more basal regions of the
cochlea) showed that fine time structure should be mapped tonotopically, or to the correct place along the cochlea, if the pitch is to be perceived (Oxenham, Bernstein et al. 2004). This must be taken into account when incorporating phase information into the stimulation.
2.5. Increased membrane noise in the relative refractory period
In (Matsuoka, Rubinstein et al. 2001), membrane noise properties during the relative refractory period were characterized by electrically stimulating chemically deafened cats according to the paradigm shown in (Figure 3).
Interpulse interval (IPI)
MaskeProbe
Figure 3. Stimulus paradigm to study growth of the evoked action potential (EAP) during the relative refractory period. A masker pulse was applied, followed by a probe after a fixed interpulse interval
(IPI).
Various interpulse intervals were used and the refractory growth function was measured, defined as the amplitude of the EAP resulting from the probe as a function of the stimulus current. The refractory growth function was fit using an integrated Gaussian, and a significant peak in the relative spread (RS, defined as the standard deviation divided by the mean of the Gaussian) of the refractory growth function was measured when the IPI was varied from 0.7 to 4ms. The peak in RS occurred consistently across the
5 implanted cats between an IPI of 0.9ms and 1.ims, and is re-plot from the paper in (Figure 4).
Estimates of Relative Spread Data orm Matsuoka, Rubinstein et al. 2001 0. E 0 0.s .s 2 2s5 3 3.s IPI (mS)
Figure 4. Normalized RS responses for 5 chemically deafened cats. A strong peak shows that the slope in the I/O function is flattest around ims. One animal has responses recorded for both cathodal
and anodal stimulation.
The increase in RS at the "specific IPI" of-lms is due to the smaller number of noisy sodium channels available (due to deactivation) during the relative refractory period. A large number of sodium channels would increase the averaging effect that causes the stochastic response to converge upon a mean, deterministic response. Correspondingly, the gradual reduction in active and noisy sodium channels during the relative refractory period would cause the variance of the response, and hence the RS, to rise.
To summarize, the basic result is that there exists a "specific IPI" which increases membrane noise in a nerve. Thus, if electrical stimulation was configured to prefer this IPI, cross-fiber synchrony may be reduced by activating only a stochastically-varying fraction of the neuron population possessing responsive sodium channels. This potential possibility will have to be verified in a clinical setting.
2.6. Gamma distributions in the Interspike Interval Histogram (ISIH)
(1) It has been claimed that ideally, interspike intervals should be exponentially distributed, as this corresponds to an underlying Poisson process (Rubinstein, Wilson et al. 1999).
(2) More precisely, as we understand neuronal spiking not to be a Poisson process in itself but rather a result of integrating Poisson distributed stimuli up to a fixed firing threshold, the inter-spike interval should have a Gamma
(or Erlang random variable) distribution (Stein 1965). Two sample distributions are shown in (Figure 5).
Gamma Distribution (Eriang R.V.) Gamma Distribution (Eriang R.V.)
1.4 0.7111
- P r arrivals) .t tir t - P(r arrivals) at time t ,fJ " [2.00,6.72*.WO1I
1.2- 0.6
fa~) .( [. tt'i , (r-I)l .-s I r fw -p'it-tor I (r-I)l -04*46, 1 -. refaty time to -100 - 0.5 - Ab.refatr time, to -.00
-Menrats of arrival, p -3.00ea rats of arrival, p -3.00
Threshold IIIarrivals, r 2 Thrsshold 0 arrivals, r-4
0.8
0.4-0.6-
0.3-104 -- 0.2
-0.2- 0.1
-0 053 1.5 2 2.5 3 3.5 40 !05 1 1.5 2 2'5 3 3.5 4 4.5 5 Time t (arbitrary units) Time t (arbitrary units)
Figure 5. Gamma distribution with parameters to=1.0, p=3.0, r=2 and r=4. Note that the value of r controls the slope of the rising edge, and r=1 reduces the gamma distribution to an exponential
distribution with an abrupt (infinite) slope at to.
A bio-realistic ISIH should therefore reflect a more gently rising slope, which peaks before an exponential "decay," where the steepness of the rising slope is determined by the voltage threshold for spiking: a high threshold will have a gentler slope, while a low threshold will have a steeper slope.
2.7.
Rate limitation in the auditory response
A final piece of research which impacts our architecture is that of the limitation on rate discrimination, a.k.a. rate limitation in the auditory response. It has been shown that the discrimination of rate changes above 300 pulses per second (pps) is very poor in cochlear implant patients (Shannon 1983). Normal hearing listeners can discriminate changes in rate (i.e. changes in pitch, or FO) of less than 1% for pure tones at low to moderate frequencies, while implant patients have FO difference limens (FODLs) on the order of 10% if even measurable, around 300 Hz (Tong and Clark 1985).
This could be a constraint that limits the usefulness of frequency-modulated information (i.e. phase information) in cochlear implants. Furthermore, current CI users may experience a perceptual dissonance due to the lack of consistency of phase cues between neighboring channels that would be present in a normal traveling-wave architecture (Loeb 2005).
Nevertheless, the ability of a CI user to discriminate changes in pulse rate varies between individuals (Townshend, Cotter et al. 1987), and some CI users may yet benefit from rate-coding of pitch and tonal information.
3. Asynchronous Interleaved Stimulation (AIS)
3.1.
The "race-to-spike" algorithm
If we do not use zero-crossings, how might we generate good asynchronous firing times? In this section, we propose a bio-inspired way to provide stimulation pulses at asynchronous times which still have a definite correlation with (t). However, if we make the firing times a sole function of $(t), this decouples the local decision to fire from global knowledge of activity in other channels, which may be important. In addition, we also do not want to decouple the decision to fire from the envelope strength, as it should be probabilistically more important to provide correct FM information when the AM signal is strong. Therefore, our strategy attempts to incorporate global information across all channels about E(t), and favors the firing of a pulse when E(t) in that channel is larger than others. The resulting times will naturally be asynchronous, and should even appear pseudorandom for natural, arbitrary sounds, given complex interactions between channels during the channel-selection process. Further biological justification for this technique is presented in section 0.
The system is comprised of coupled electronic neurons that incorporate information about E(t) across all channels, and in competition with each other, generate the asynchronous firing times. The strategy is also termed a "race-to-spike" algorithm, as the neurons are set up in a race where the winning channel gets to deliver a stimulation spike on its electrode. The algorithm is described in the following steps:
(1) The system receives as inputs half-wave rectified currents from a bank of bandpass analysis filters, which could be actual currents like those generated by an analog processor (Sarpeshkar, Baker et al. 2005; Sarpeshkar, Salthouse et al. 2005), or a digital version as produced by a DSP.
(2) There is one integrate-and-fire neuron (Dayan and Abbott 2001) associated with each channel, receiving the above-mentioned current input from that
channel, to charge up its neuronal capacitance from the ground state. This begins the "race-to-spike."
(3) The first neuron to reach a fixed voltage threshold "wins" and resets all capacitors back to zero. This ensures that the interleaved stimulation requirement is satisfied, as there can be only one winner.
(4) The winning neuron then fires a current spike (which is an asynchronous timing event) on its electrode that is scaled by the channel envelope's energy.
(5) Once a neuron wins, its input current is inhibited (i.e. weakened) for a period determined by a relaxation time constant, to prevent it from winning
repeatedly.
(6) After the winning neuron has fired its spike, we start the neuronal "race-to-spike" (step 2) again.
Natural variations of this algorithm could be implemented, and we will list just a few. The inputs to the integrate-and-fire neurons could be generated by any signal analysis front-end, for example a modulated filter bank or a cochlear cascade of low-pass filters. The voltage threshold could be different for different channels, to create pre-emphasis or to accommodate different sensitivity to stimulation. The level of the electrode current spike could be an arbitrarily complex function of its input, such as an average past envelope stored dynamically on a capacitor in that channel. The level of inhibition following a spike, and also its duration could be arbitrarily complex functions of the past. For the purposes of this thesis, we will implement in simulation only a simple version of this strategy, to be elaborated on below.
We wanted to build on existing work on an ultra-low-power analog bionic ear processor (ABEP) to eventually implement a very low power strategy in hardware (Sarpeshkar, Baker et al. 2005; Sarpeshkar, Salthouse et al. 2005). Thus, to examine the effectiveness of this strategy in conjunction with low-power analog signal-processing components already built, we simulated as our front-end the bandpass filters and envelope detectors exactly as they were implemented in the ABEP: The bandpass filters were conventional 2-stage 4th-order filters with Q=4 and 12 dB/octave highpass and lowpass rolloffs; 16 channels were implemented, with center frequencies scaled logarithmically from 116 Hz to 5024 Hz. The envelope detectors were implemented with
asymmetric attack and release 1st-order low-pass time constants, with rA=lms and ,rR=3ms respectively, acting on full-wave rectified filter outputs in order to compute an approximation for E(t). The envelope detector may therefore be thought of as a low-pass filter with cutoff frequencies of 1 kHz and 333 Hz for rising and falling transients respectively. To simulate the finite sampling rate in digitizing E(t), E(t) was passed through a sample and hold running at a rate of 1.8 kHz. Half-wave rectified versions of the bandpass filter outputs were used as inputs to the integrate-and-fire neurons.
Neuronal capacitances are simply modeled as capacitive state variables, and their voltage threshold was set to be the same for all channels, where a low value of around 35mV (in simulation units) turned out to give good results. Using this threshold and input speech tokens at conversational sound pressure level, all channels reach their threshold and fire within -400 ps of receiving an input pulse, with a time-to-spike of 50-200 ps being most common. A histogram of typical times-to-spike is shown in (Figure 6).
Time-to-spike distribution: die
Vte,,,= 3 5 mV khm-0.5 ",h=0.8ms (F.=44100 Hz) Chi f=1 16H1z 40 --- T=8ff.62hit- --~ Mean=203ps ~20 ---- =5O7 sJ----0 &oc 0 500 Ch5 f=450Hz 40 - T=2.22m1~~~ Mean=133s 20 -1-70#s --0 0 0 500 100 Ch9 f=1o096H e T=0.91msI 50 ..Mean-65pis CT=89ps 0
0
k
500 100 Ch 3 f=26211 T=0.38msI 50 -. Mean=136s L =188s f 0 500 Interspike time ( ps) Ch2 f=180Hz Ch3 f=274Hz 40 Ch4 f=345Hz 40 T 5.56ris 40 -- Ta3.65msi *T=2.90msMean=141s Mean=155ps 20 .i n=175ji 20 - 145ps 20 -=137jps -=240PS 0 0 0 0 500 0 500 0 500 100 Ch6 f=556Hz 100 Ch7 f=706Hz 200 Ch8 f=900Hz T=1.80ms T=1.42ms T=1.11ms 50 --M!1n6 s 50 . Mean7js- - 100 -- ean=5s cr=632ps CF=93ps CF=83ps 0 -1Z" 1 0 0 - _-0 500 0 500 0 500
100 Chi0 f=1368 1 00 Chil f=1710 z 40 Chi2 f=2116 z
T=0.73ms T=0.58ms T=0.47ms 50 Mean-5ps 50 Mean9gs - 20 IM 136 s a=138ps CF=87ps (F=200pts 0 0 0 jMO ais 0 500 0 500 0 500 Z 20 Chi4 f=3245Hz 10 Chl5 f=4057 z 4 Chi6 f=502414z T=0.3lms T=0.25ms T=0.20ms 10 .Mean-163s 5 . Mean=14s 2 -M an=166us
CT=240pis a=90ps a 35ps
0 " " 0
jj
0 500 0 500 0 500
Interspike time ( ps) Interspike time ( ps) Interspike time ( ps)
U
Figure 6. Histogram of times-to-spike, with Vthresh=35mV (in simulation units) and conversational SPL for the speech token "die."
The size of the spike fired was simply set to the sampled-and-held value of E(t), which could be easily implemented in hardware by D/A converters.
The last important detail is the time course of the inhibition described in step (5)
above. We wanted to ensure that firing was absolutely prohibited for a minimum amount of time that is determined by the absolute refractory period of biological neurons. This prohibition avoids wasting stimulation power when biological neurons are unable to respond. However, after the absolute refractory period, we would like to softly turn off the inhibition current, thus enabling a very strong input to overcome the imposed inhibition.
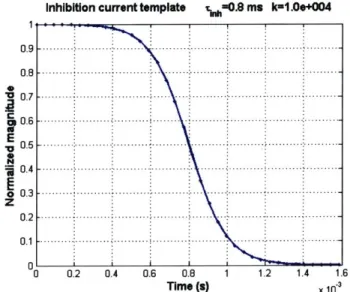
To accomplish these objectives, we designed the time course of the inhibition current to be modeled by a Fermi-Dirac exponential roll-off, given by the equation
1
h,) 1 where rinh sets the time where the inhibition falls to half its maximum value, fixed at 0.8 ms in our simulations and k sets the steepness of the rolloff, fixed at 104. The value of rinh was chosen to be 0.8 ms to enforce a minimum inter-spike interval near the refractory period of auditory neurons (Miller, Abbas et al. 2001). The shape of this time course is shown in (Figure 7).
Inhibition current template 0.8 ma k-1.0e+004
0 .7 - -.--- --...-- --..-- -.- -..--- 1 0 .6 - - - - --- - - -.. .--- .. -.-.--.--.- - -- - -E V 0 .5 ---.. -. ---.. .. ...-. -. -- --.-..-.-- ... . -..-- .. ... -- -.--- -. ... .-. 6 0 .3 --- --- ..---.. -. -. ----. -- -..--- ... .. -.--- .. . .. --.-- . -- .. -..- -0 .2 .--- .-- .. ... --- . ---.. ---.. -- . -. -- --.--- -- -- -- -- -- -. .. 0 .1 .--- -. .. --- .--- -- -- --.-- -- ---.- .. -..--- ..--- --.. - --00 0.2 0.4 0.6 0.8 1 1.2 1.4 1.6 Time (s) X 10
Figure 7. Time profile of inhibition current, with exponential rolloff modeled by the Fermi-Dirac equation. Note the current falls to half its value when t = Tinh.
It also happens to match closely with the decrease in current output of a subthreshold current source if the gate voltage on a pass transistor is linearly decreased, which can be easily implemented in electronics. The inhibition current Inh(t) is then defined as
Aih -hnh(t), where Ainh sets the maximum inhibition current, fixed at -0.5 in our simulation
units.
The algorithm is described in the following pseudocode:
Initialize: capacitor voltages Vcap(t) = 0 V channels Initialize: time-of-last-spike tastspike = -co V channels
Initialize: spiking output spike(t) = 0 V channels At each timestep t, V channels,
Compute: Iinh(t) Ainh-hinh(t-lastspike) ... (step 5) Increment: Vcap(t) += max[HWR(t) - Inh(t), 0] ... (step 1,2) where HWR(t) is the half-wave-rectified bandpass filter output for that channel If max [Va,,(t)] > (Vthresh= 35mV)
Vchannels
Find: max ch = channel with max [V, (t)]
Vchannelsca
Set: Vcap(t) = 0 V channels ... (step 3)
Set: spike(t)= E(t) in channel maxch ... (step 4)
Set: t
astspike= t in channel max ch ... (step 5)
3.2. Results from MA TLAB simulations
Various sound files in the .wav format were loaded into MATLAB and input to the simulation. We tested speech utterances of the words "die" and "buy," a Handel chorus containing a word vocalization of "hallelujah," and a piece of music (jazz) that does not contain words.
Being a digital simulation, we had to choose some level of timing resolution with which to discretize the time steps, thus a "sampling rate" of Fs=44100 Hz was used, indicating a timing resolution of about 23 ts. Preliminary results (not shown) suggest that a timing resolution much worse than that degrades the accuracy of our experiments. We present results from "die," which is one of the two speech utterances tested, to illustrate the performance of the system.
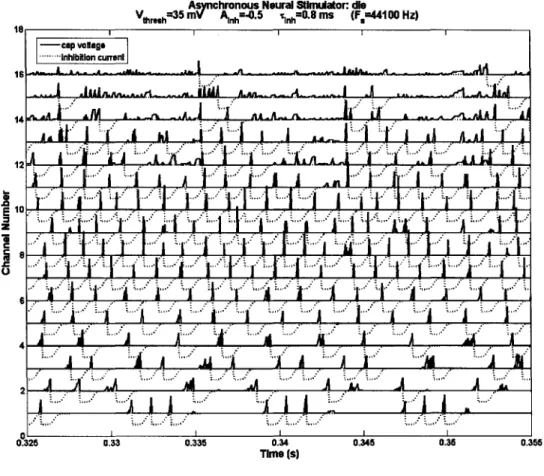
3.2.1. Capacitor Voltage and Inhibition Current waveforms
(Figure 8) is a zoomed-in figure of typical capacitor voltage and inhibition current waveforms. We note that spikes are fired when the capacitor voltage reaches a threshold, turning on a negative inhibition current that has the profile as described in (Figure 7). Immediately after a spike, all capacitors are then reset to zero as given by the algorithm. As the level of inhibition current Ainh at -0.5 was set to be higher than the highest input level, no channel fires again until its inhibition current has almost returned to baseline.
Asnchronous Neural Stimidator: de
Vthresh35 m A Inh=-0.5 tfl.S ms (F,=44100 Hz) 18III -cap vlags - .Inhiblon curreni 14 6 0 z U
-4l
I 144j'
4
2l .. ... ... 0.325 0.33 0.335 0.34 0.345 0.35 0.355 Time (s)Figure 8. Capacitor voltage (solid lines) and inhibition current (dotted lines) waveforms from race-to-spike simulation of the speech utterance "die."
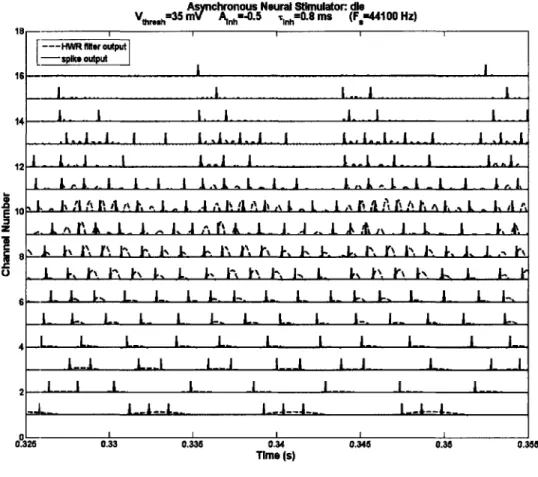
3.2.2. Half-wave rectified inputs against spiking outputs
(Figure 9) shows the half-wave rectified outputs of the bandpass filters, used as inputs
to the asynchronous race-to-spike system, and plotted against its spiking outputs for the same time window as in (Figure 8). We should note that spikes tend to fire near the
fired is not deterministic. Instead, the time of firing exhibits some pseudo-stochastic variation due to the competition between channels. We should point out that our strategy does not explicitly model stochastic firing that arises normally in the auditory system, but may, however, introduce stochastic responses that are similar to those encountered normally. By firing only when enough charge has accumulated within a fraction of a half-wave rectified cycle, and when the intensity of a channel is high enough to be the first to spike, a channel will generate spike times that are correlated with but not precisely determined by important features in the phase of the signal (t). The resulting spike trains, as we shall show later, are sufficient for high-fidelity signal reconstruction, and encode phase information with a high degree of correlation.
Asnchronous Neural Stknulator: die
Vthreshm3V A nh4 nlhEO. mS (F,=44100 Hz) --- HWR filer output -spike output .4- A- I I 12 L 1 .l. L 1. I I 1.,.L. .i I L ... L . 1 .l...A A AI...I SL . i1. .. A A A I L I L L ...l . 1, L ,.
z .in I A. .. ,1 -L..I I IJ ,It L.I k .-- I 1,A.
L kL L LPL\ . L t. L LP- L . LI-L L L L L L L L L. L. L L L 4L L. L_ L L L. L I L._ -L1- LdA IJ I Lj A -]]I 2 - --- I L I .. _ 0.325 0.33 0.335 0.34 0.345 0.35 0.355 Time (s)
Figure 9. Half-wave-rectified bandpass filter outputs (dashed lines) used as inputs to the race-to-spike simulation, plot against the spiking outputs (solid lines). The race-to-spikes in this figure are shown
before scaling by E(t), for clarity.
fired over a single pulse of energy. This allows pulses of long duration to be well represented, which would not occur in zero-crossing based stimulation.
3.2.3. Interspike-Interval Histograms
The interspike-interval histogram of each channel is presented in (Figure 10). An "absolute refractory period" of about 1 ms is shown to be enforced, keeping the instantaneous firing rate in each channel below a maximum of 1 kHz. The distributions also look fairly natural, where a perfectly natural distribution due to spontaneous firing would be a smooth gamma distribution indicating Poisson arrival of inputs to a neuron. The histograms do not show exact gamma distributions, but the distribution is nevertheless more natural than any distribution produced by synchronous firing.
die: V hrh mV A. :2-0.6 . h0.8 ms (F,=44100 Hz) 100 so ...- C If=116Hz ... o T=8.62mi 60 .... #spkMs=05 AFR=30f4Hz 40 ... ... ---20 --- -0 100 80 - 0 5=-450Hz s T2.22mS o ... #spikes=235 --IF345.6Hz 40 .u 20 ....- -.-.. -. --.-.-.-. -0 2 6 8 100 80 ... . 9=1096Hz T=0.91ms 60 -- #spikes=204 40 -. . ...- 300. 0Hz 20 0 0 2 4 6 8 100 60 - 1013 4=2621Hz S T=0.38ms S60 #sopikes=207 4. AFR=304.4Hz '~40 20 00 2 4 6 8 interspike time (ms) 100 80 C..2.=180Hz -T=56mS 60 . pikes227-4IAP-=333.8Hz 204 - - -- -0 0 2 4 6 8 100 105 80 C6 f=556Hz T=1.80ms so #s ikes=24 40 AFR=388.2Hz 20 . ...-.. -...- .-.----0 2 4 6 8 100 113 80 -C0104=1368Hz--T=0.73ms 60 -- #spikes=214 AFR=314.7Hz 0 2 4 6 8 100 80 0... Ch44 f=3245Hz T=0.31ms 60 #spikes= AFR=113 2Hz 40 20 0 -0 2 4 6 8 Interspike time (ms) 100 80 Cr3f-=274Hz..-T=3.65ms 60 - - -#spikes=24- - -20 ... ...- - - . 40 -- -29FI 20 0 2 4 6 8 100 0 - C7 f=706HZ T=:1.42ms 60 #spikes=281 AFR=383.8Hz1 4011 20 ... ... -.-. -0 2 4 6 8 100 80 -..---.. =. 10Hz-T=b.58m6 60 #*ikes=216 317.6Hz 20 0 2 4 6 8 100 8o . Ch1f=4057Hz.-5 T=O.25ms 60 .. #pikes=21 -.-.-AFR=30 9Hz 40 20 0 0 2 4 6 8 Interspike time (ms) 100 80 0..4. =345Hz -=2.90ms 6011#spikes=215 II F =310.1Hzl 20 - -- -0 0 2 4 6 8 100 84 80 018 1=900Hz T=1. IImg 60 #spikes=264 AFR=388.2Hz 40 201--00 2 4 6 8 100 s0 -- Ch12-=2 1Hz --T=0.47mS 60 - #pikes=182 AFR=267.6Hz 20 --- -0 0 2 4 6 a 100-s0 - -16 f=5024Hz T=0.20mi 60 #sikes=b AFR=11.8Hz 40 20 0 2 4 k0 (6 Interspke time (ms)
Figure 10. Interspike-interval histograms for the 16 stimulation channels. Also shown for each channel are f, the center frequency of each channel, T = 1/f, the number of spikes in that channel,
and the AFR. Spike counts > 100 are clipped (but reported numerically above the figure), and spike intervals > 9ms are not shown in the histogram.
3.3. Power Savings
A major advantage of asynchronous stimulation is that the average firing rate (AFR) is able to fall significantly below the worst case maximum firing rate. In contrast, synchronous paradigms need a clock that is fast enough to handle the fastest event rate. Asynchronous stimulation allows the input firing rate to be averaged across time and across channels such that no power is spent during quiet periods or on quiet channels to continuously sample the signal. Sensory codes that adapt to signal statistics are efficient (Smith and Lewicki 2006) and asynchronous stimulation allows us to adapt our sampling rate in time and spectral space to the needs of the signal.
We should note in our simulation above that the AFR in each channel is about 300-388 Hz for most channels, and when averaged over all 16 channels comes down to only 279 Hz per channel. This AFR is lower than the firing rate in conventional synchronous stimulation where firing rates are not adapted to the input stimuli. (Table 1) shows the power savings possible with our technique by stating the worst-case channel's AFR and also contrasting it with the mean AFR of all the channels. We see that averaging in time reduces the worst-case AFR below 1 kHz, thus saving power, and that averaging across channels reduces the mean AFR, also saving power.
Table 1. Maximum and mean (across channels) of each channel's average firing rate (AFR)
Sound file Maximum Channel with Mean AFR
AFR (Hz) max AFR Hz
"die" 388.2 6 279.4
"bu " 466.5 7 288.9
Handel 772 9 451.9
chorus I I I
Jazz music 556.9 7 275.3
3.4. AIS spike reconstruction and comparisons
In this section, we present a method of comparing the AIS strategy against other acoustic simulations of cochlear implants. Many acoustic simulations reconstruct the sound input to a CI from its output of channel envelopes by using white-noise or tonal carriers for each channel (Shannon, Zeng et al. 1995; Dorman, Loizou et al. 1997), and are known as noise/tone vocoding reconstructions. To similarly reconstruct a sound from
the train of spikes generated by AIS, we use a spike-based reconstruction technique that has its foundation in prior neurophysiology work, showing that analog waveforms can be accurately reconstructed from spiking waveforms. For example, optimal low-pass filters can be designed, that when applied to the recorded spike trains from the Eigenmannia electric fish, produce as their output a very well-correlated reconstruction of the input voltage variations in the fish's sensed aquatic environment (Wessel, Koch et al. 1996). Such experiments show that frequency modulations in neuronal spike trains can encode an analog input so well that only conventional low-pass filters are needed for stimulus reconstruction.
Recent work has also shown that a spike-based auditory code can very efficiently encode speech, outperforming gamma-tone, wavelet and Fourier decompositions, achieving the highest SNR in representing speech at coding rates <60 kbits/s (Smith and Lewicki 2006). In this research, sound signals are also reconstructed from spikes using tuned kernel filters that have impulse responses closely resembling those of high-order resonant low-pass filters. Interestingly, these impulse responses independently matched physiological data; the dictionary of 32 kernel filters that were adapted to give good reconstructions turned out to match the tonotopic population of auditory neuron impulse responses in cats, as derived from reverse correlation analysis (deBoer and deJongh 1978). These results lend further support to the validity and usefulness of impulse response reconstructions for neuronal spiking codes.
3.4.1. Channel-by-channel spike reconstruction
Motivated by prior work on spike-based reconstruction techniques like that in the electric fish, we applied 2-stage 4th-order low-pass resonant filters (with the same center frequency and
Q
of 4 as the bandpass filters in each channel and with 24 dB/octave low-pass rolloffs) to the spiking outputs from each channel. The spikes effectively behave like envelope-scaled impulses and the filters sum the impulse responses from various spikes to recreate the analog information in each channel:f spike,,(r) -h (t - r) dr where spike,,(t) contains the E(t)-scaled spikes from channel ch, (4)
reconstruction,, (t) h(t) ha is the low-pass filter impulse response for channel ch,
=
max h and reconstruction,,(t) is the reconstructed signal on channel ch
center frequency, we needed to normalize the reconstructions across channels by dividing by the peak value of hch(t). The reconstructed waveforms on a channel-by-channel basis are shown in (Figure 11):
V, .33 -4 A. 0 - F*.41N2 m V00,330 U*. 4491 Hz) 50"M rm. 340739..00 2110). -06.1 1710 r.5 55M). r 04 45MH I-IL71 s4 2 ~110f0.4.&3 % 0 0.2 0.3 SA S 56 7 0? 3n SM 0.35 0.M 5.350 1sM .
Figure 11. Sixteen-channel spiking reconstruction (solid lines) of the bandpass filter outputs (dashed lines). A magnified version of the same time window as in earlier figures is shown on the right.
Correlation coefficients (r) for each channel are computed from the following equation:
f
BPFoutput e, (t) - reconstruction,(t) dt where BPFoutputch (t) is the bandpass output for channel ch, (5)r = and both BPFoutputh(t) and reconstruction,(t) have
BPFoutput,'(t) dt -reconstructionc2(t) dt had their means removed, i.e. are zero-mean signals
The correlation coefficient is on a scale from 0 to 1, with 1 indicating a perfect correlation between the bandpass filtered output and the spike reconstruction. The correlations between each channel are fairly good, with a low-frequency channel having a correlation coefficient as high as 0.86. In performing these correlations, it was also important to account for group delay introduced by the bandpass and low-pass filters, which causes the composite reconstruction(t) (as defined in the next section) to lag the original signal. Thus, to compensate for the group delay (which does not affect the sound fidelity), the cross-correlation between reconstruction(t) and the original signal was performed, and the lag corresponding to the peak in the cross-correlation was then used to time-shift reconstruction(t) and align it with the original signal. The lags for the 4
3.4.2. Composite signal spike reconstruction
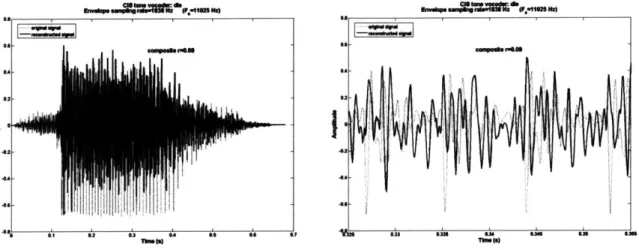
If we sum all the reconstructed channels together, we can generate a composite reconstruction of the original signal just as in CI acoustic simulations using vocoding reconstruction, defined as follows:
16(6
reconstruction(t)= reconstruction.,(t) (6)
The summated signal is shown in (Figure 12), with a zoomed-in version again on the right. The phase relationships are clearly preserved, and the envelope is also fairly well tracked.
Figure 12. Composite spiking AIS reconstruction (solid line) of the waveform "die," by summing the channel reconstructions together. Note the reconstruction is downsampled to match the sampling
rate of the original sound signal (dotted line). The composite correlation coefficient is 0.48.
The composite correlation coefficient is 0.48 in this example, the word die, and is calculated as follows:
Forigi
nal (t) - reconstruction(t) dt where original(t) is the original sound signal, (7)r = i and both original (t) and reconstruction(t) have
j
original2(t) dt -freconstruction2(t) dt had their means removed, i.e. are zero-mean signalsNote that the sampling rate was reduced to match the same sampling rate of the original signal, to make a fair comparison. A flowchart of our entire reconstruction technique is shown in (Figure 13).
Log-spaced f. from 116-p024 Hz Spiking output Load .wav sound file Analyze into 16 Q=4 bandpass channels
Q
L1
I
i
L~
H"IILow-pass filter with same Q and fc as
bandpass channels
Reconstructed Sound
Figure 13. Flowchart of the entire AIS reconstruction process.
3.4.3. Hilbert decomposition and correlation
It is not immediately obvious how much of the phase information j(t) is retained in the spike output from the AIS strategy. In order to better quantify the transmission of 0(t), we performed a Hilbert decomposition of the reconstructed signal into E(t) and 0(t) components as described in Section 2.2. These components were then correlated separately with the original signal's envelope and phase. In order to see whether the correlations for E(t) and 0(t) were significant for AIS, we then compared them against CIS noise and tone vocoding reconstructions, and also a CIS spike-based reconstruction which employs the same reconstruction filters as described in Eq. (4), except that the non-overlapping spike input is now sequentially and synchronously firing at a fixed rate
Extract ~2kHz sampled envelope and half-wave rectified
magnitudes Race-to-spike algorithm 1~ 'roll t 001V "_ I I I I I I I I I I I I
T 1%. a
r__ F i 1111111111111of 1.4 kHz. Other firing rates were tested as well but found not to make a significant difference to the results. The sound samples used were the words die and buy, to be representative of speech, and snippets from Handel's Hallelujah chorus and a jazz piece, Highway Blues, to be representative of music. As the results for CIS noise vocoding could vary significantly between trials due to randomness in the noise input, we conducted 100 trials and present the mean and standard deviation of those trials. Envelope correlations are shown in (Table 2), phase correlations are shown in (Table 3) and composite correlations are shown in (Table 4).
Table 2. Correlation in E(t) envelope component for different processing methods Sound file AIS spike-based CIS noise-based CIS tone- CIS spike-based
reconstruction vocoding based reconstruction
100 trials) vocodin (1.4 kHz firing rate) "die" 0.6 0.50 ± 0.04 0.57 0.48 "buy" 0.6 0.46 ± 0.08 0.46 0.37
Handel chorus 0.54 0.27 ± 0.06 0.33 0.27
Jazz music 0.49 0.18 ± 0.02 0.29 0.52
Table 3. Correlation in 0(t) phase component for different processing methods Sound file AIS spike-based CIS noise-based CIS tone- CIS spike-based reconstruction vocoding based reconstruction
100 trials vocodina 1.4 kHz firin rate) "die" 0.19 0.03 ± 0.02 0.07 0.16
"buy" 0.13 0.03 ± 0.02 0.01 0.07
Handel chorus 0.42 0.03 ± 0.01 0.02 0.01
Jazz music 0.4 0.01 ± 0.01 0.01 0.01
Table 4. Correlation in composite reconstruction for different processing methods Sound file AIS spike-based CIS noise-based CIS tone- CIS spike-based
reconstruction vocoding based reconstruction 1______ _ 1 (100 trials) vocodina 1.4 kHz firin rate)
"die" 0.48 0.10 ± 0.02 0.09 0.07
"buy" 0.43 0.10 ± 0.02 0.08 0.04
Handel chorus 0.67 0.08 ± 0.02 0.04 0.01
Jazz music 0.58 0.04 ± 0.01 0.02 0.01
Correlation coefficients for 0(t) are in general lower than that for E(t) because 0(t) by nature varies much more rapidly than E(t). However, 0(t) correlation coefficients are