Supplementary Information
Biogeography and evolution of seeder and resprouter forms of Erica coccinea (Ericaceae) in the fire-prone Cape fynbos
Fernando Ojeda1*, Katharina B. Budde2,3, Myriam Heuertz2,4,5,6, José G. Segarra-Moragues7, Santiago C. González-Martínez2,4,5
1
Departamento de Biología-CeiA3, Universidad de Cádiz, Campus Río San Pedro, E-11510 Puerto Real, Spain
2
Departamento de Ecología y Genética Forestal, Centro de Investigación Forestal, INIA, E-28040 Madrid, Spain
3
University of Copenhagen, Department of Geosciences and Natural Resource Management, Rolighedsvej 23, 1958 Frederiksberg C, Denmark
4
INRA, UMR 1202 BioGeCo, F-33610 Cestas, France 5
Université de Bordeaux, UMR 1202 BioGeCo, F-33400 Talence, France 6
Université de Fribourg, Department of Ecology and Evolution, CH-1700 Fribourg, Switzerland
7
Centro de Investigaciones sobre Desertificación (CIDE-CSIC/UV/GV), E-46113 Moncada, Valencia, Spain
*Author for correspondence: [email protected], ph. +34956016766
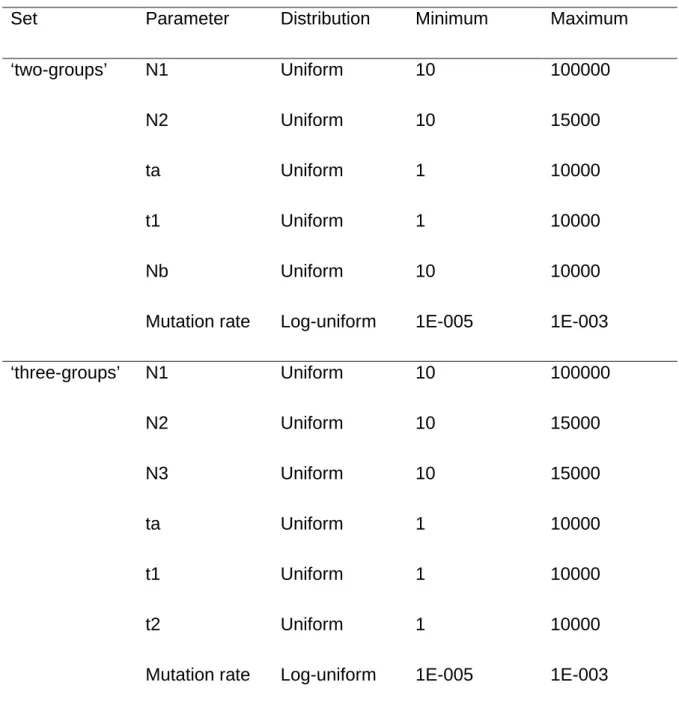
Table S1. Priors and summary statistics for ‘two-groups’ and ‘three-groups’ ABC models.
Set Parameter Distribution Minimum Maximum
‘two-groups’ N1 Uniform 10 100000
N2 Uniform 10 15000
ta Uniform 1 10000
t1 Uniform 1 10000
Nb Uniform 10 10000
Mutation rate Log-uniform 1E-005 1E-003
‘three-groups’ N1 Uniform 10 100000 N2 Uniform 10 15000 N3 Uniform 10 15000 ta Uniform 1 10000 t1 Uniform 1 10000 t2 Uniform 1 10000
Mutation rate Log-uniform 1E-005 1E-003
All ABC models were base in the following summary statistics:
• One sample statistics: mean number of alleles, mean genic diversity, mean size variance and mean Garza-Williamson’s M statistic.
• Two sample statistics: mean number of alleles, mean genic diversity, mean size variance, Fst, Classification Index, shared allele distance and (dµ)2 distance.
Table S2. Ribotype definition (see Fig. 2 in main text for ribotype distribution and Fig. 3 for a network connecting ribotypes).
position in alignment (bp) Ribotype 81 113 132 187 241 253 280 283 284 298 481 501 550 559 636 648 682 719 I C T T C T T T - - - C C A C G T - T II C T T C T T T - - - C C G C T T - N III C T T C T T T - - - C C G C G T - T IV C T T C T T T - - - C C G T G T - T V C A T C T T T - - - C C G T G T - T VI C T C C T T T - - - C C G T G T - N VII C T C C T T T G T T C C G T G T - T VIII C T C C T C T G T T C C G T G T - T IX C T C C T T T G T T C C G T G T A T X C T C C T T T G T T C C G C G T A T XI C T C A T T T G T T C C G T G T - N XII C T C A T T T G T T C C G T G C - C XIII T T T C T T T - - - C C G T G T - T XIV T T T C C T T - - - C C G T G T - T XV C T C C T T T - - - C G G T G T - N XVI C T C C T T T - - T C G G T G T - T XVII C T C C T T T - - - C C G T G T - T XVIII C T C C T T C - - - T C G T G T - T
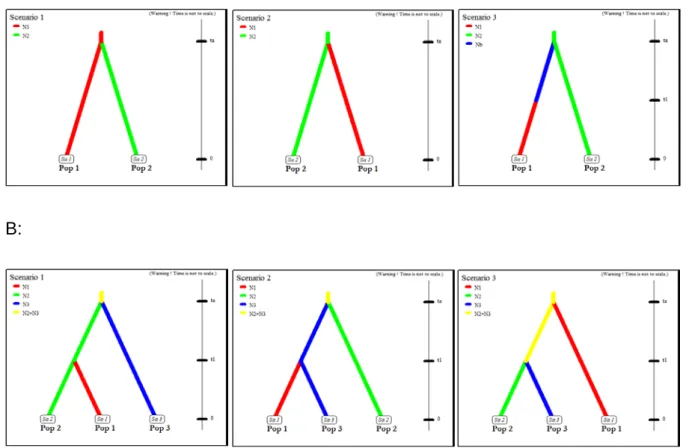
A:
B:
Figure S1 A: Basic ‘two-groups’ models compared using ABC. Pop 1 refers to seeders and Pop 2 to resprouters. Notice that in Scenario 1, seeders are the
ancestral lineage while in Scenario 2 resprouters are ancestral. Scenario 3 includes a population size change in the seeders. Finally, ta refers to the splitting time
between seeder and resprouter forms and t1 to the time of population size change in seeders. B: A similar set of ABC models but with resprouters divided in western (Pop 2) and eastern (Pop 3) groups (see main text). In Scenario 3, t1 refers to the splitting time between western and eastern resprouters.
Figure S2 ‘Three-groups’ models compared using ABC. Pop 1 refers to seeder populations, Pop 2 to resprouter populations, and Pop 3 to mixed populations. Two separated sets of models were run (see main text), one for the mixed populations from the Cape Peninsula (S01 and R02) and the other for those from the Caledon region (S09, R05 and R07). Notice that t2 refers to the time of secondary contact between seeders and resprouters.
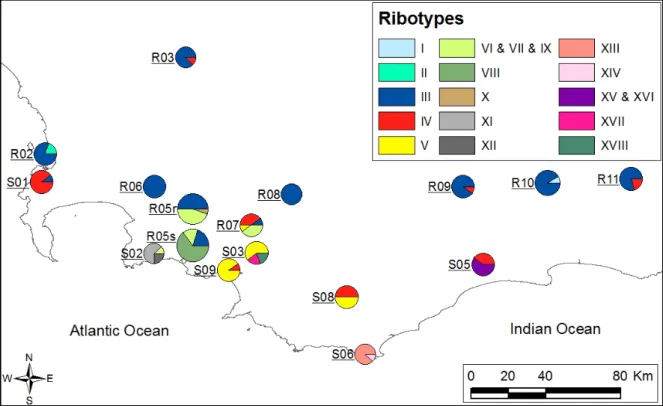
Figure S3 Geographic distribution of 15 ITS ribotypes found in E. coccinea once indels were removed. Pie charts are proportional to sample size. Notice that a prefix ‘S’ indicates a seeder population and a prefix ‘R’ a resprouter population, except for R05 where both seeders (R05s) and resprouters (R05r) were sampled.
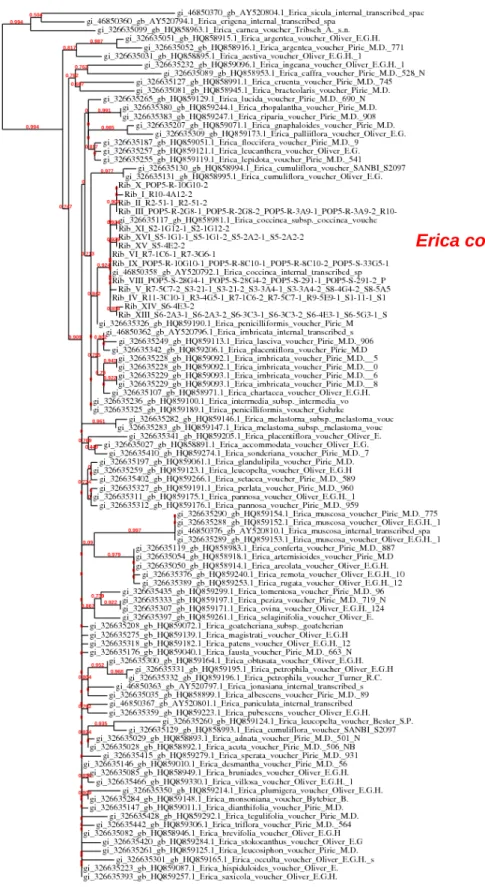
Fig. S4 Maximum likelihood phylogenetic tree obtained from PhyML. The branch length is proportional to the number of substitutions per site. Branch support is the probability of an approximate likelihood ratio test.
Fig. S5 Maximum likelihood phylogenetic tree based on both phased and unphased
E. coccinea ITSs and close outgroups. The branch length is proportional to the