HAL Id: hal-02388362
https://hal.archives-ouvertes.fr/hal-02388362
Submitted on 1 Dec 2019
HAL is a multi-disciplinary open access
archive for the deposit and dissemination of
sci-entific research documents, whether they are
pub-lished or not. The documents may come from
teaching and research institutions in France or
abroad, or from public or private research centers.
L’archive ouverte pluridisciplinaire HAL, est
destinée au dépôt et à la diffusion de documents
scientifiques de niveau recherche, publiés ou non,
émanant des établissements d’enseignement et de
recherche français ou étrangers, des laboratoires
publics ou privés.
Electron Transfer at the Metal Oxide/Electrolyte
Interface: A Simple Methodology for Quantitative
Kinetics Evaluation
Iban Azcarate, Cyrille Costentin, Christophe Méthivier, Christel
Laberty-Robert, Alexis Grimaud
To cite this version:
Iban Azcarate, Cyrille Costentin, Christophe Méthivier, Christel Laberty-Robert, Alexis Grimaud.
Electron Transfer at the Metal Oxide/Electrolyte Interface: A Simple Methodology for Quantitative
Kinetics Evaluation. Journal of Physical Chemistry C, American Chemical Society, 2018, 122 (24),
pp.12761-12770. �10.1021/acs.jpcc.8b02289�. �hal-02388362�
Electron Transfer at the Metal Oxide/Electrolyte Interface: A
Simple Methodology for Quantitative Kinetics Evaluation
Iban Azcarate,
†,‡,OCyrille Costentin,
§Christophe Methivier,
⊥Christel Laberty-Robert*
,‡,OAlexis
Grimaud*
,†,O†
, , , 75231, Paris Cedex 05, France
‡ b v s és− P v. P s , , L b sé
de Paris, 4 place Jussieu, F-75005 Paris, France
O
Rés s k q ( ), N 3459, 33 L , 39 A s, France
§
Université Paris Diderot, Sorbonne Paris Cité, Laboratoire d'Electrochimie Moléculaire, Unité Mixte de Recherche Université - CNRS N° 7591, Bâtiment Lavoisier, 15 rue Jean de Baïf, 75205 Paris Cedex 13, France. Present address: Department of Chemistry and Chemical Biology, Harvard University, 12 Oxford Street, Cambridge, Massachusetts 02138, United States
⊥ b v s és− P v. P s , Laboratoire de Réactivité de Surface, Unité Mixte de Recherche
UPMC-CNRS N° 7197, Bâtiment Lavoisier, 4 place Jussieu, F-75005 Paris, France
ABSTRACT: While quantitative models exist for measuring rate constants for electron exchange at the surface of semiconductors to or from redox couples in solution, their use is very limited for studying transition metal oxide electrodes. Taking advantage of the possibility of tuning the doping level of WO3 by thermal treatment, we measured the
rate constants for electron injection from soluble probes in the so-called reverse mode. Hence, we could demonstrate that intermediate states located below the conduction band take part to the oxidation process and that the rate constant is bimolecular with a first order dependence on the concentration of redox probes and the concentration of intermediate states. A kinetics model was thereby developed to describe this reverse mode and a zone diagram established which can then be used to quickly assess rate constants for interfacial electron transfer on the surface of transition metal oxides semiconductors that are critical for applications such as solar energy conversion.
Introduction
The ever-growing demand for clean and sustainable energies urges us to expand the use of renewable energies and to develop new energy storage and conversion devices. The last decades have thus seen the emergence of new classes of materials which led to the development of technologies such as Li-ion batteries, solar cells, fuel cells, photo-electrolyzers, among others. One class of materials has been critical for the development of these technologies, namely the transition metal oxides (TMO), and numerous efforts are still paid at further improving their physical and chemical properties. Along these efforts to design better materials, the realization that mastering the electrochemical interfaces became always more prominent.1 Yet, controlling the charge transfer at the solid/solution interface becomes increasingly important for all these applications. Indeed, it is critical to prevent side reactions occurring at high potential on the surface of positive electrodes for Li-ion batteries2 or to enhance
dye-sensitive solar cells3-5 or photo-electrolyzers6-9 properties for instance by proper interface engineering. Therefore, only controlling this interface will allow for developing the next generation of energy storage and conversion devices.
Despite recognizing the importance of such fundamental understanding, relatively limited kinetic information has been obtained on transition metal oxides electrodes. Hence, a strategy commonly adopted consists in using soluble redox molecules from which qualitative observations about electron transfer are often made to evaluate the quality and the doping density of such electrodes.10-14 However, quantitative models derived from the field of semiconductors physics exist, but their use is very limited in experimental studies15-17. This can be, in part, explained by the relative difficulty to accurately control physical parameters of TMO electrodes such as thickness and porosity, the surface termination and the
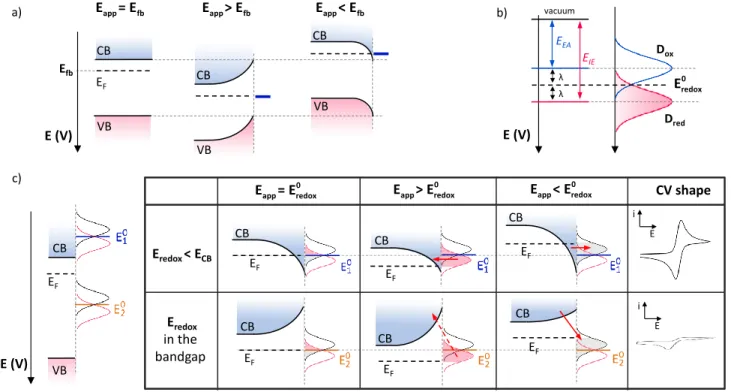
Figure 1. (a) Energy diagram of a n-type semiconductor in the cases when the applied potential (Eapp) i) equals the flat band
potential Efb (left), ii) is more positive than Efb (middle), iii) is negative to Efb (left). CB: Conduction Band; VB: Valence Band; EF :
Fermi level. (b) Representation of the energy diagram of a redox couple according to the Marcus-Gerischer model. EEA : Electron
affinity; EIE: Ionization energy ; λ: Reorganization energy; : standard potential of the redox couple; Dox and Dred :
respectively the energy distribution of the oxidized (empty) and reduced (filled) forms of the redox couple. (c) Energy diagram of a n-type semiconductor electrode in contact with 2 redox probes of standard potential and , with .
Evolution of the conduction band according to the position of the standard potential of the redox probe and the applied potential. Red arrows indicate the flow of electrons between the SC and the redox probe.
presence of surface states and the doping level, among others, to ensure sufficient reproducibility for the kinetics measurements. Theories on electron transfer mechanism at the interface between a semiconductor (SC) electrode (Figure 1a) and an electrolyte (Figure 1b) have been extensively studied.14,18-24
A simple description of the accepted model proposed by Marcus, Hush, Gerisher, Memming and others is presented in Figure 1c for n-type SC. Several cases were previously described in the literature that we briefly summarized below. For further details, readers can refer to previous reviews on this topic.25-29
In the left side of Figure 1c is depicted a n-doped semiconductor at its flat band potential (Efb) in contact
with two redox probes of different standard potentials ( and , with ). For these two probes,
electron exchange with the semiconductor electrode is supposed to occur through the conduction band (CB) as the valence band (VB) is too far in energy. For a redox couple with a standard potential negative to the conduction band edge, when the applied potential equals , the semiconductor is accumulating
electrons at its surface in a so-called space charge layer. Under these conditions, whether a positive or negative bias is applied (compared to E°redox), the SC is maintained
in an accumulation mode. Thus, a large density of states
is available for electron transfer from the reduced form “ ” of the redox couple (filled states in the Gerischer model) to the semiconductor CB, and inversely from the CB to the oxidized form “Ox” (empty states) of the redox couple. Therefore, the SC behaves like a metallic electrode and the resulting cyclic voltammetry (CV) curve exhibits a typical reversible wave.
When the applied potential equals the standard potential of a redox couple located in the bandgap ( in Figure 1c), the SC is in a depletion mode. The density of majority charge carrier (electrons in the case of a n-doped SC) in the space charge layer is lower than in the bulk. Under application of a negative bias, the band bending is lowered but the SC is still in a depletion regime and the density of electrons at the surface is very low. Therefore, in the so-called forward mode, i.e. injection of electron from the n-type SC to Ox, little cathodic current is expected. A large negative bias is then required to reach the flat band potential and suppress the potential barrier due to bend bending. Once this sufficiently negative bias is applied, a significant electron density at the SC surface is restored leading to an increase of the redox probe reduction current. A least studied case is the so-called reverse mode. When a positive bias is further applied, the depletion is strengthened and the band bending is increased. There are no states available in the SC at the Red energy distribution level, and a high potential barrier
CB EF CB EF EF EF EF EF Eredox< ECB Eredox in the bandgap CV shape CB CB CB CB b) c) CB VB EF CB VB CB VB E (V) a) E (V) λ λ EEA E (V) CB VB EF Dred Dox vacuum EIE Efb i E i E 0 app redox E = E 0 app redox E > E 0 app redox E < E 0 redox E app fb E = E Eapp> Efb Eapp< Efb
prevents electron transfer from the probe to the CB. While this last case was previously described in the literature, very few is known concerning its kinetics which we intend to investigate in this work.30,31
Rather than developing a new physical model, our aim is to provide a simple methodology so to quantitatively assess the electron transfer rate at the oxide/electrolyte interface in this reverse mode. In that respect, we revisited the approach consisting in using soluble molecular redox probes to investigate the electrochemical behavior of n-type semiconductors in a reverse bias mode (anodic polarization) taking WO3, vastly studied as
photocatalyst or for its electrochromic behavior, as a model oxide. Doing so, we could demonstrate the bimolecular nature of the rate constant characterizing this mode. Furthermore, we could provide evidence that this behavior is nested into the presence of so-called “ s ates”, . . y v s j s b w the conduction band of n-type SC and that can be thermalized. Then, using a kinetic model, we provide researchers from the broad field of energy a simple guide from which not only kinetics constants for electron transfer could be extracted, but also the quality of any transition metal oxides SC thin film could be rapidly and accurately assessed independently of the doping level.
Results
Energy levels diagram
Dense crystalline sol-gel WO3 and TiO2 films were
synthesized on Fluorine-doped Tin Oxide (FTO) electrodes by a previously reported dip-coating technique (see Supporting Information, SI, for experimental details on the synthesis and characterization of the two oxides).32 The films were approximately 150 nm thick and presented a low degree of porosity (Figures S1 and S4 in SI). A series of porous WO3 films were also prepared in order to
investigate the effect of the porosity. Energy diagrams (Figure 2) reconstructed for WO3 and TiO2 from
ultraviolet photoemission spectroscopy (UPS) and UV-vis measurements (see Figure S2 and S3 for UPS and UV-Vis results) are consistent with those previously reported in the literature for films deposited by wet techniques.33-36 The two scales (energy and potential) of the diagram are correlated according to the equation37 :
/ 4.7 / . /
Energy eV Potential V vs Ag AgCl
E E
In the rest of the article, all energies are given using the potential scale, and potentials are reported in V vs Ag/AgCl.
In addition to the transition metal oxides band energies, the energy diagram in Figure 2a also includes the standard potential of five selected redox molecules, which will serve as probes to study the electron transfer with the semiconductor films. The chemical structure of the molecular redox probes and their standard potential in acetonitrile are reported in Figure 2b. These probes are all based on the same bis(cyclopentadienyl) motif and were
selected because 1) they all demonstrate a reversible one-electron wave on metallic electrodes and 2) their standard potentials cover a wide potential window of more than
2V.14,38 Hence, among the five selected redox probes, the
two most negative (CoCp2Me10 and CoCp2) have standard
potentials within the conduction band of both WO3 and
TiO2, while the three others lie in the band gap of the two
oxides.
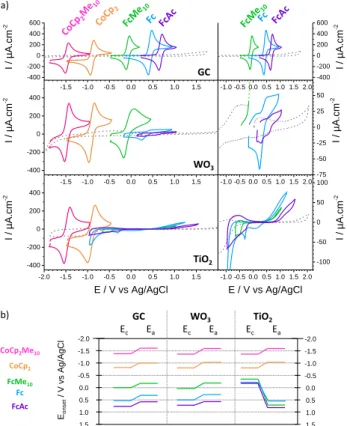
Figure 2. (a) Band energy diagram of sol-gel WO3 and TiO2
films, compared to the 5 redox probes standard potential. (b) Molecular structure of the 5 selected redox probes with their standard potential in acetonitrile in V vs. Ag/AgCl .
Electrochemical measurements
The CV responses for the five molecular redox probes were studied on WO3 and TiO2 coated electrodes and
compared to the responses measured with glassy carbon (GC) and non-coated FTO electrodes (Figure 3 and Figure S5; additional experimental details in SI). As expected, the five redox probes showed a perfectly reversible one-electron signal on GC and FTO. A similar response was observed with porous WO3 films, indicating a rapid
diffusion of the molecular redox probes through the pores of the films to the underlying FTO electrodes. On the contrary, the responses on dense metal oxide semiconductor electrodes were noticeably different, suggesting that diffusion phenomena can be neglected and that electrodes can be seen as flat and non-porous surfaces of WO3 or TiO2.
For both WO3 and TiO2 electrodes, the two most negative
redox probes with a standard potential in the TMO conduction bands (CoCp2Me10 and CoCp2) demonstrate
an almost perfectly reversible signal with apparent standard potentials similar to the ones measured on GC.
WO3 φ = 4 .5 EVB = 2.1 TiO2 Eg =2 .7 φ = 4.7 EVB = 3.3 Eg =3 .3 0 1 2 3 -1 -2 -3 0 -1 -2 -3 -4 -5 -6 -7 -8 -9 4 -4
CoCp2Me10 CoCp2 FcMe10 Fc FcAc
b) -1.47V -0.90V -0.08V 0.43V 0.67V a) : 0 redox E
Only a slight increase of the peak separation ( ) could be observed (Table S1 in SI).
Unlike the behavior observed for CoCp2Me10 and CoCp2,
the electrochemical responses for the most positive redox probes (Fc, FcAc) on WO3 and TiO2 were dramatically
different from the ones on GC. Indeed, a large drop of the current intensity was observed on the two TMO electrodes. The shapes of the CV were also far from the typical reversible – diffusion limited wave, and were noticeably different between WO3 and TiO2.
Figure 3. (a) Cyclic voltammetry of solutions of CH3CN + 0.1
M n-Bu4NPF6 at 0.1 V/s under 1 atm. Ar on GC, WO3 and
TiO2 working electrodes in absence (grey dotted lines) and in
presence (colored plain lines) of the 5 redox probes at 1mM. (b) Anodic (Ea) and cathodic (Ec) onset potentials of the 5
redox probes as function of the working electrode material. Onset potentials are measured at the foot of the anodic and cathodic waves.
On WO3, a clear anodic plateau could be distinguished,
with a current decreasing with increasing standard potential for the redox probes. These anodic plateaus were accompanied by a cathodic peak on the reverse scan. Moreover, the onset potentials for these plateaus were similar to the onset potential of the anodic peak measured on GC, and the peak separation was found to moderately increase in comparison to GC (Figure 3b and Table S1 in SI).
On TiO2, the positive redox probes (FcMe10, Fc and FcAc)
present a poorly defined anodic wave of relatively low current density in comparison to the diffusion limited
reversible wave. The anodic onset potentials of these waves are significantly more positive than on GC or on WO3. On the reverse scan, one or two cathodic peaks
could be observed, once again, at more negative potentials than on GC, leading to a very large separation between the anodic and the cathodic features. Hence, for the three most positive probes, the cathodic peaks were lying at about the same potential (≈-0.3V), independently on their standard redox potential. This effect is similar to the so-called leveling effect previously discussed by Bard et al. for TiO2.13,14 This leveling of the redox potential is
therefore attributed to the presence of trap states in the band gap of TiO2 that mediate the electron transfer from
the SC to the redox molecule, and vice versa. The absence of leveling effect for WO3 strongly suggests the absence of
trap states in the band gap mediating the charge transfer, and the existence of a different electron transfer mechanism.
The results reported in Figure 3 match well with the model of electron transfer developed by Gerischer.20,22,25,39 The redox couples with standard potential above the lower edge of the conduction band (CoCp2Me10 and
CoCp2) show a reversible signal, while the exchange
current is significantly reduced or almost suppressed for redox probes with standard potential in the band gap (FcMe10, Fc and FcAc). We therefore decided to
investigate in depth the origin for the low current anodic plateau observed for Fc and FcAc on WO3 at a reverse bias mode.
In Figure 4a is shown a typical CV for Fc at v = 0.1 V.s-1
and a concentration of 1 mM. The CV curve exhibits the characteristic anodic plateau accompanied by a cathodic peak on the reverse scan. We first demonstrate that the anodic plateau is scan rate independent from 50 to 1000 mV.s-1, at a fixed Fc concentration of 1 mM (Figure 4b-c).
In contrast, the current for the anodic plateau varies linearly with the Fc concentration from 1 to 25 mM (Figure 4d-e). Hence, the rate for electron transfer from the probe to the SC shows a first order dependence on the concentration of the probe below a critical concentration. Over this critical concentration of about 25 mM, the correlation between the redox probe concentration and the plateau current deviates from linearity. As further discussed later on, this saturation effect was previously described and interpreted as a limitation related to the f v b p y “ s s” mediating the electron transfer between the redox probe and the SC conduction band.31
Eo n se t / V v s Ag /Ag Cl 0.0 -1.0 -2.0 1.0 -1.5 -0.5 1.5 0.5 0.0 -1.0 -2.0 1.0 -1.5 -0.5 1.5 0.5 GC WO3 TiO2 Ec Ea Ec Ea Ec Ea CoCp2Me10 CoCp2 FcMe10 Fc FcAc b) GC WO3 TiO2 a) -1.5 -1.0 -0.5 0.0 0.5 1.0 1.5 -400 -200 0 200 400 600 -1.5 -1.0 -0.5 0.0 0.5 1.0 1.5 -400 -200 0 200 400 -2.0 -1.5 -1.0 -0.5 0.0 0.5 1.0 1.5 -400 -200 0 200 400 -1.0 -0.5 0.0 0.5 1.0 1.5 2.0 -400 -200 0 200 400 600 -1.0 -0.5 0.0 0.5 1.0 1.5 2.0 -75 -50 -25 0 25 50 -1.0 -0.5 0.0 0.5 1.0 1.5 2.0 -100 -50 0 50 100 I / µA.cm -2 I / µA.cm -2 I / µA.cm -2 E / V vs Ag/AgCl I / µA.cm -2 I / µA.cm -2 I / µA.cm -2 E / V vs Ag/AgCl
Figure 4. Cyclic voltammetry of Fc in CH3CN + 0.1 M
n-Bu4NPF6 under 1 atm. Ar on a working electrode of WO3. (a)
Typical CV scan for [Fc] = 1mM and v = 0.1V/s (b) Effect of the scan rate on the anodic plateau. [Fc] = 1mM and v= 50, 100, 200, 400, 600, 800 and 1000 mV/s. (c) Plot of the anodic plateau current versus the scan rate. (d) Effect of the Fc concentration on the anodic plateau. [Fc] = 1, 2, 4, 6, 10, 25, 50 and 100 mM, and v = 0.1 V/s. (e) Plot of the anodic plateau current versus the Fc concentration.
Electrochemical doping
Inspired by this result, we then explored the effect of s s y f s “ s s” f WO3 under reductive potential. The shift of the cathodic
inversion potential toward increasingly negative potential is supposed to partially reduce40,41 WO3 and to create
“ s s” b w B.42 Because of the close p x y f s “ s s” w B minima edge, these states can be thermally ionized and electrons injected into the CB. This process increases the doping density of the SC and simultaneously leaves empty surface states that enhance the electron uptake from reduced redox probes. Two different solutions were thus prepared, the first one containing CoCp2, FcMe10 and Fc
(Sol. A) and the second one containing CoCp2, FcMe10
and FcAc (Sol. B). The CVs for these two solutions with a cathodic inversion potential progressively shifting from -1.25V (red curve) to -1.95V (blue curve) are given in Figure 5a,b. A standard one-electron reversible signal is observed for CoCp2 regardless of the cathodic inversion
potential, ensuring that no film degradation occurs during the reduction process. In contrast, the three other probes see their signal evolving from no current to an almost perfectly reversible wave. This process was found reversible, and the anodic current decreases when
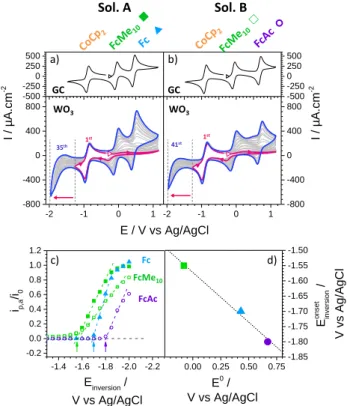
Figure 5. Cyclic voltammetry in CH3CN + 0.1 M n-Bu4NPF6
under 1 atm. Ar at v = 0.1V/s of (a) 1mM CoCp2 + FcMe10 + Fc and (b) 1mM CoCp2 + FcMe10 + FcAc on GC and WO3z. The
1st scan (red curve) and last scan (blue curve) are highlighted for clarity. The white triangles indicate the starting point and the scanning direction. The red/blue arrow indicates the progressive shifting of the cathodic inversion potential from--1.25V (1st scan) to -1.95V (last scan) . c) Evolution of the anodic peak current of FcMe10, Fc and FcAc ( )
normalized by the peak current of CoCp2 ( ) with the cathodic inversion potential. Filled symbol: Sol. A; Empty symbols: Sol. B. The vertical arrows indicate the onset cathodic inversion potentials for the 3 probes. d) Correlation between the onset cathodic inversion potentials and the standard potentials of the redox probes.
increasing back the cathodic inversion potential to its original value (Figure S9). The evolution of the anodic peak current for the three probes (FcMe10, Fc and FcAc)
with the cathodic inversion potential is plotted in Figure 5c. The onset cathodic inversion potential for which the probe oxidation current starts to increase (green, blue and purple arrows in Figure 5d) is around -1.55V for FcMe10 in both solutions A and B, and around
-1.70V and -1.80V for Fc and FcAc, respectively. The linear correlation found between the standard potentials of the redox probes and the onset cathodic inversion potentials (Figure 5d) suggests that the more positive the standard potential (the further from the CB), the highest the concentration of empty intermediate states is required to allow electron transfer.
Visually, no color change of the WO3 electrodes was
observed during the progressive shifting of the cathodic inversion potential towards negative values. Likewise, in
situ spectroelectrochemical measurements monitoring
0.0 0.2 0.4 0.6 0.8 1.0 -50 0 50 100 150 0 500 1000 0 20 40 60 80 100 120 600 I / µA.cm -2 E / V vs Ag/AgCl 1000 800 400 200 100 50 v (mV/s) i,a / µA.cm -2 v / mV.s-1 a) c) d) e) b) -0.4 -0.2 0.0 0.2 0.4 0.6 0.8 1.0 1.2 -100 -50 0 50 100 I / µA.cm -2 E / V vs Ag/AgCl 0.0 0.2 0.4 0.6 0.8 1.0 0 1000 2000 3000 4000 5000 0 25 50 75 100 0 1000 2000 3000 4000 5000 100 I / µA.cm -2 E / V vs Ag/AgCl 50 25 10 6 42 1 [Fc] mM i,a / µA.cm -2 Fc / mM -2 -1 0 1 -800 -400 0 400 800 -500 -250 0 250 500 -2 -1 0 1 -800 -400 0 400 800 -500 -250 0 250 500 I / µA.cm -2 E / V vs Ag/AgCl I / µA.cm -2 GC GC WO3 WO3 a) b) c) d) Sol. A Sol. B FcAc Fc FcMe10 35th 1st 41st 1st 0.00 0.25 0.50 0.75 -1.85 -1.80 -1.75 -1.70 -1.65 -1.60 -1.55 -1.50 E on set in versi on / V vs Ag/AgCl E0 / V vs Ag/AgCl -1.4 -1.6 -1.8 -2.0 -2.2 -0.2 0.0 0.2 0.4 0.6 0.8 1.0 1.2 Einversion / V vs Ag/AgCl ip,a /i0
the UV-vis absorbance of the WO3 electrode while the
cathodic inversion potential was shifted from -1.35 to -2V s w s f s f bs p visible range (Figure S10). This tends to rule out the formation of bandgap states due to the bulk reduction of WVI to WV, giving a deep blue coloration to the oxide.43,44
Chemical doping – bimolecular process
Using an electrochemical approach, we have qualitatively established that variation of the majority charge carrier (electrons) concentration by application of increasingly negative potentials is associated with the formation of empty intermediate states just below the CB that enhance the rate of probe oxidation at the SC surface. We then adopted a chemical approach for quantitatively monitor the SC doping density and establish a general kinetic model for the electron transfer from the redox probe to the SC.
Figure 6. (a) Cyclic voltammetry of Fc in CH3CN + 0.1 M
n-Bu4NPF6 under 1 atm. Ar on working electrodes of GC
(black) and WO3 with various amount of doping (colored).
(b) Mott-Schottky plot of the corresponding electrodes. MS measurements were performed in CH3CN + 0.1 M n-Bu4NPF6
under 1 atm. Ar in absence of redox probe. (c) Variation of the anodic plateau current with the doping density of the x . “P/P ” “G/G ” f z denomination as explicated in the zone diagram in Figure 9.
For that, several WO3 films underwent thermal
treatments under a reductive atmosphere (5% H2 in Ar) at
350°C for 20 to 45 min, treatment frequently used to increase the doping density of transition metal oxides.45-49 First, the doping density for these films was determined from the slope of the linear part of the Mott-Schottky (MS) plots obtained from impedance spectroscopy (see SI for more details) and the flat band potential was then estimated from the intercept of the slope with the x-axis. The electrochemical behavior of these H2-treated
electrodes was then investigated with solutions containing FcMe10, Fc and FcAc. The CV for Fc on six
different films as well as the corresponding MS plots are reported in the Figure 6a,b and compared with the electrochemical response measured for a GC electrode. The anodic current response measured by CV was found to increase with decreasing slopes on the MS plots (Figure 6a,b). Since the slope of the MS plot is inversely proportional to the doping density, this observation indicates that an increasing doping density leads to increasing anodic currents, evolving from low current plateaus for low doping densities to almost perfectly reversible wave for sufficiently high doping densities. This evolution is fully consistent with our previous observations made during the electrochemical reduction of WO3 films. When plotting the anodic plateau or peak
current versus the doping density, a clear trend can be established (Figure 6c). Hence, for relatively low donor density, the CV anodic response measured for Fc exhibits a plateau behavior, whose current intensity increases linearly with the doping density (red “Plateau” area in Figure 6c and Figure 7a). In this case, the current is purely limited by the kinetics of the electron transfer between the redox probe and the oxide film.
Above a certain doping density, the anodic plateau turns into peak, whose intensity progressively tends toward the Nernstian diffusion limited one-electron wave obtained f G (b “P k” ). I s s , the current is no longer limited by the electron transfer rate, but by the diffusion of the redox probe from the bulk solution to the electrode surface. Similar correlation could then be established for FcAc and FcMe10
(Figure 7b,c), where, alike for Fc, a linear trend between the anodic plateau current and the doping density could be observed in both cases.
Therefore, we establish a first order dependence for the anodic current on a reverse bias mode for n-type SC with the doping density. Combined with the first order dependence with the concentration of redox probe previously established (Figure 4c), this first order dependence on the doping density indicates that the charge transfer rate constant from the probe to WO3 is
bimolecular.17 -0.5 0.0 0.5 1.0 -0.5 0.0 0.5 1.0 1.5 I C -2
E / V vs Ag/AgCl
/5 200 µA.cm-2 0,01 cm4 .µF-2 0 50 100 150 200 250 300 350 0 50 100 150 200 250 300 350 400 450 ip,a / µA.cm -2N / 10
25m
-3 1 e- wave c) P/PR G/GRPlateau
Peak
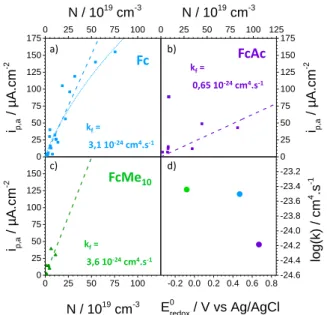
a) b)Figure 7. Variation of the anodic plateau current of Fc (a), FcAc (b) and FcMe10 (c) with the doping density of the WO3 electrodes. (d) Correlation between the apparent rate constant and the standard potential of the redox probes.
Physical origin
After demonstrating the bimolecular nature for the charge transfer rate constant in the reverse bias mode, the question then arises about the physical origin for such transfer. As already mentioned, we assume that doping the SC film leads to the f f “ p y s s” b w b , , w propose that oxidation of the probe in the reverse bias mode results from electron transfer from the probe to these empty “ s s”. T s s s may be q f s “ s” since electrons transiently reside in these states, before to be transferred to the conduction band and eventually to the underlying conductive electrode. Our proposition is indeed supported by the following observations:
i) the reverse (anodic) current is not diffusion limited, ii) the variation of the current with the probe concentration and the doping density follows a first order law and iii) the current saturates above a limiting probe concentration. The last observation indicates that above a limiting concentration, the electron transfer from the intermediate state to the conduction band becomes rate limiting. The existence of a rate-limiting “ s ” s b similarly proposed by Memming for the reduction of a redox probe which standard potential is within the band gap of a p-type SC (reverse current and reverse bias).31 It was found that reverse (cathodic for p-type SC) current was lower than what would be expected for a diffusion limited process, and that the current increases with the probe concentration up to a limiting concentration. Above this concentration, the electron transfer from the valence band to the intermediate states became the rate determining state: the current saturates and further addition of redox probe in solution s lead to any increase of the current.
Altogether, these features suggest that a similar mechanism is ongoing in our system and that intermediate states may govern the electron transfer process at the WO3/electrolyte interface.
Moreover, our model does not take into account the reorganization energy, . However, based on previous reports, for Fc would be close to 0.7 eV in organic solvents.50 Hence, given that the CB minima is located at approximately -0.7V vs. Ag/AgCl, no overlap is expected between the conduction band of WO3 and the states
distribution of redox probes with potential greater than ≈ 0 V vs. Ag/AgCl (Figure 1). This is experimentally confirmed when observing the potential independent plateau for Fc and FcAc, even for a large charge carrier concentration. Furthermore, the anodic current was found to decrease at fixed charge carrier density when increasing the standard potential of the redox probe (from Fc to FcAc, Figure 7). A narrowing of the space charge region at greater anodic potential allowing for electron tunneling can thus be ruled out to explain this oxidative behavior.
Furthermore, no significant changes were detected on both UV-vis spectra and SEM-FEG pictures between pristine WO3 electrodesand WO3 electrodes treated under
H2 5% in Ar at 350°C for 30min (see Figure S3e and
Figure S6 in SI). These observations are corroborated by XPS measurements (Figure S7) performed on a H2 treated
electrode showing only a slight increase of W5+ concentration, indicating that the reductive treatment may generates a small amount of surface intermediate s s (“W5+” s s), b s ff b k f materials.
These measurements are therefore consistent with the presence of intermediate states involved into the oxidative process and which concentration is dependent on the concentration of majority charge carriers. Eventually, this supports the view proposed by Memming and coworkers that these intermediate states can originate from the thermal activation of majority charge carriers from surface states located below the CB into the CB.31
Figure 8. Energy diagram representing the electron transfer mechanism between a redox probe in solution and the semiconductor metal oxide electrode through intermediate states (IS). a) b) c) d) FcMe10 Fc FcAc kf= 3,6 10-24cm4.s-1 kf= 0,65 10-24cm4.s-1 kf= 3,1 10-24cm4.s-1 0 25 50 75 100 0 25 50 75 100 125 150 175 0 25 50 75 100 125 0 25 50 75 100 125 150 175 0 25 50 75 100 0 25 50 75 100 125 150 -0.2 0.0 0.2 0.4 0.6 0.8-24.6 -24.4 -24.2 -24.0 -23.8 -23.6 -23.4 -23.2 N / 1019 cm-3 ip,a / µA.cm -2 N / 1019 cm-3 ip,a / µA.cm -2 E0 redox / V vs Ag/AgCl ip,a / µA.cm -2 N / 1019 cm-3 log(k) / cm 4 .s -1 Redox probe E (V) Solution TMO FTO Bulk CB IS D i K th K i b k th f k Thermalization Interfacial ET th b k Diffusion i f k
Kinetic model and quantitative analysis
Based on the above discussion, the experimental finding can be rationalized with the kinetic scheme shown in Figure 8. The semiconductor oxide electrode is characterized by two energies: the conduction band energy ECB0 (all energies are given using the potential scale), and the energy of intermediate surface states,
E
S, involved in the electron transfer between the solution redox probes (characterized by its standard potential0
redox
E ) and the TMO electrode. Oxidation of the probe occurs through electron injection to the conduction band which electron population depends on the band edge energy, the applied potential E and the intrinsic donor density
N
C. This electron transfer is mediated by intermediate states located below the conduction band and which densityN
S is controlled by the level of doping. Thermalization of intermediate states with the CB is kinetically characterized by kthf and kbth rate constants, while interfacial electron transfer between the probe and intermediate states is described byk
if and kbirate constants (Figure 8). Fast electron transport is assumed within the TMO as well as fast electron transfer at the TMO/underlying conductive electrode (FTO) interface. The system depends on four dimensionless parameters (see Annex S3 in SI),
two thermodynamic parameters:
0
exp / i redox S K F E E RT
0
exp / th S CB K F E E RT and two kinetic parameters:
/ i S f i D N k Fv D RT / 0 th f C th i i f
k N
k C
where D is the probe diffusion coefficient and C0is the probe concentration in the bulk of the solution. The two thermodynamic parameters only depend on the energy levels of the redox probe, the conduction band minima and the intermediate states. The kinetic parameter i D/ describes the competition between the electron transfer from the redox probe to the intermediate states and the diffusion of the redox probe from the bulk to the electrode surface, while
th i/ describes the competition between the electron transfer from the intermediatestates to the CB (thermalization) and the first electron transfer from the probe to the intermediate states. The present analysis assumes that the rate constants are independent from equilibrium constants. This strong assumption is justified a posteriori from the observation that the rate constants measured with three redox probes are only slightly dependent on the probes standard potentials (Figure 7d). However, the kinetic description can be easily refined by introducing a kinetic law binding rate constants to driving forces.
In the framework of cyclic voltammetry, the general current potential curve is then given by (see SI):
/ / / / 1 1 exp 1 1 1 1 1 1 exp i D th i th i i th i i th th i I I K I K K K K
where the dimensionless current is i FSC/ 0 DFv RT
,
the dimensionless potential is
F
E
E
redox0
RT
andI is the convolution integral. From this general equation, three limiting cases are worth examining.
If the redox couple standard potential is in the conduction band, i.e. K Ki th exp F
ECB0 E0
1RT
,
then the present kinetic model is not relevant because electron transfer is not mediated by an intermediate state since the TMO electrode then behaves as a metal. Nonetheless, this can be described as
i D/ , i.e.
1
I
1 exp
0
, hence leading to a Nernstian CV equation as observed experimentally (see Figure 3a).The second case which is worth emphasizing corresponds to a redox couple which standard potential is in the bandgap (K Ki th1) with a small concentration of redox
probe so that / 0 th f C th i f k N k C
. Physically, this impliesthat the thermalization of the intermediate state with CB remains faster than the interfacial electron transfer between the redox probe and the intermediate states. In this case, the general equation simplifies in:
/ 1 1 exp 1 exp i D i I K
A 2D zone diagram representing the various expected CV as a function of the two dimensionless parameters i D/ and
i
K can thus be drawn and is represented in Figure 9a (see SI for details on zone diagram construction as well as expressions and characteristics of the CVs in the various zones). For low doping density (i D/ 0; P, PI and PR zones in Figure. 9), the forward CV trace takes the form of a S-shaped curve with a plateau current:
0 i
pl S f
i
FSC N k
with S the surface area of the electrode.
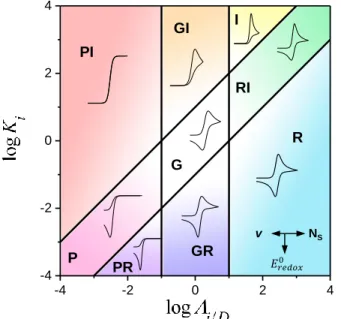
Figure 9. 2D zone diagram representing the expected CV shapes as function of the dimensionless parameters and K . Expressions and characteristics of the CVs in the various zones are given in the SI. G: general zone governed by both parameters and K . P and RI: general plateau and general peak zones governed by one parameter
/ K
. GR and GI: one parameter zones with reversible and irreversible CVs governed by . R: nernstian zero parameter zone, nernstian CV. I: irreversible CV zero parameter zone. PI: irreversible plateau CV, zero parameter zone. PR: reversible plateau CV, zero parameter zoneFor a given redox probe, variation of the scan rate corresponds to a horizontal displacement in the zone diagram. . As the scan rate is large enough for the system to enter the P, PR or PI zones, this plateau current is obtained and further increase of the scan rate does not modify it, which explain the scan rate independence of the anodic plateau. The anodic current is then kinetically controlled by the bimolecular reaction between the redox probe and the intermediate states. For a given redox probe, increasing the density of intermediate states, i.e. doping, also corresponds to a horizontal displacement toward the right side in the zone diagram, with the
forward CV trace changing from a plateau (zones P, PI and PR) to a peak shape (zones G, GR and R). The evolution of the CV shape as a function of i D/ for two given values of
i
K are shown in Figure 10a and can be compared to the CV shape evolution observed experimentally for increasing doping density (Figure 6a). Furthermore, another good correlation can be found between the model anodic plateau or peak current evolution in Figure 10b and the experimental one in Figure 6c.
Figure 10. (a) Simulated CVs as function of for K 0.01 (left) and K 1 (right). = 0.01 (red), 0.1 (orange), 0.2 (yellow), 0.5 (green), 1 (blue), 10 (purple). (b) Simulated dimensionless plateau or peak current as function of for
K 1.
As long as the system remains in the PI, P or PR zones (i.e. i D/ 0, Figure 9), a plateau current proportional to the doping density is obtained, corresponding to
0 i
pl S f
i
FSC N k
. For a given redox probe concentration0
C , kif can thus be retrieved from the slope of the plot of the anodic plateau current as a function of the doping density (NS) of the metal oxide electrode. Control of NS
is achieved experimentally through chemical doping via reductive thermal treatments and NS is evaluated from the MS plot (Figure 6a). The different rates were therefore
-4 -2 0 2 4 -4 -2 0 2 4 I RI R G GR GI PI PR P NS v -10 -5 0 5 10 10 1 0.5 0.2 0.1
0.2 0.01 0.0 0.5 1.0 1.5 2.0 10.0 0.0 0.1 0.2 0.3 0.4 0.5
i/D
p -10 -5 0 5 10
0.2 10 1 0.5 0.2 0.1 0.01 P/PR G/GR R 0.01 i K 1 i K / i D = / i D =a)
b)
extracted for the three probes (Figure 7). Noticeably, the charge transfer rate constant was found to increase following FcAc < Fc < FcMe10. As expected, when
increasing the standard potential for the redox probe, in other words when increasing the barrier height for the electron transfer to the oxide CB, the rate constant for electron transfer decreases. We note however that the experimental rate constants exhibit a shallow variation with the driving force. Rate constants of the order of 10-24 cm4.s-1 are obtained for the three redox probes, which
is several orders of magnitude lower than what was previously obtained for the reduction of viologen molecules at the n-type Si-CH3OH interface16
(≈ 10-17 cm4.s-1). Hence, we could confirm in this study that the rate exchange for a process based on injection of majority carrier from the redox molecule into the semiconductor is by far slower than for the injection of majority charge carrier from the semiconductor to the redox molecule.
From the plateau current expression derived in the
/ 0
i D
limit (PI, P or PR zones) when th i/ , i.e. when the thermalization of the intermediate state with CB is faster than the interfacial electron transfer with the redox probe, we can predict a linear variation of the plateau current with the probe concentration C0. It is indeed the case at small probe concentration (Figure 4e). However, a deviation from this limiting behavior is actually observed experimentally as the probe concentration is increased. This corresponds to the
/ th i
assumption not being valid anymore. We are thus led to the third limiting case which corresponds to a situation where i D/ 0, so that the consumption of the probe at the electrode surface is negligible on the forward scan but without constraint on
th i/ . The S-shaped steady-state (scan rate independent) CV forward scan expression then simplifies into (see SI for details):
0 / 1 exp pl i i D f S i FSk N C where the plateau current is:
/ 0 / 1 pl th i pl i th i f S i FSk N C
and the half-wave potential E1/2 corresponds to
1/2 0, i.e.: / 1/2 / ln 1 th th i S th i K RT E E F
As the concentration of probe is increased (decrease of
/ th i
) the plateau current varies from 1 pl
(th i/ ) to pl (th i/ 0). This leads to the variation of the plateau current from
i
pl
FSk N C
if S 0, proportional tothe probe concentration, to
i
pl
FSk N N
thf S C, independent on the probe concentration. In the latter case, the system is no longer kinetically controlled by the bimolecular electron transfer between the probe and the intermediate state (with fast thermalization of electrons between the intermediate states and the CB) but it is controlled by the kinetics of electron transfer between the intermediate states and the CB. Consequently, the deviation of linearity of plateau current with probe concentration observed experimentally (see Figure 4c) is an indication of increasing interference of intermediate state/CB electron transfer kinetics. Adjustment of the experimental data (Figure 4e and Figure S11 in SI) leads to an evaluation of i/
thf f C
k
k N
6.1 10-3 cm3.mol-1 for Fc. Taking NC1019 cm-3 and kif 3.1 10-24 cm4.s-1, we obtainth f
k
5.1 10-31 cm4.s-1.mol. Interestingly, we note that the half-wave potential E1/2 is almost insensitive to the variation of the probe concentration (Figure 4d) indicating thatK
th
1
and therefore 0S CB
E E in line with the idea that the intermediate states are very close to the conduction band edge.
Conclusion
In this work, we re-investigated the electron exchange on the surface of n-type semiconductor transition metal oxide WO3 under reverse bias (anodic polarization).
Doing so, we could first demonstrate that, as opposed to a process governs by the presence of trap states such as found for TiO2, the oxidation of molecular redox probes
with standard potentials within the band gap of WO3 is
controlled by the presence of intermediate states close to the CB. Hence, the anodic current was found potential independent as well as independent on the scan rate. We could further demonstrate that the anodic current is not only dependent on the concentration of redox probe but also dependent on the majority charge carrier concentration as determined by Mott-Schottky analysis. This observation allows for extracting the bimolecular rate constants for the electron exchange. To do so, we took advantage of an intrinsic property of oxides films prepared by soft-chemistry and so-far considered as a barrier for getting kinetics information, namely the scattering of doping levels among different films, to extract kinetics information. Finally, using a simple kinetic scheme, we provide a guide that will allow for an easy determination of the rate for electron exchange on the surface of transition metal oxides SC for researchers from the broad field of materials for energy. Indeed, we believe that this work provides the fundamental background to quantitatively investigate transition metal oxides electrodes used in a variety of energy storage and conversion devices. Furthermore, this methodology can be extrapolated to the study of porous films commonly used in practical devices.
ASSOCIATED CONTENT
Supporting Information.
Full experimental details, characterization data and detailed kinetic model description. This material is available free of charge via the Internet at http://pubs.acs.org.
Corresponding Author
*E-mail: [email protected] *E-mail: [email protected]
Author Contributions
The manuscript was written through contributions of all authors. / All authors have given approval to the final version of the manuscript.
Notes
The authors declare no competing financial interest
ACKNOWLEDGMENT
I.A, C.L-R and A.G. would like to acknowledge RS2E for financial support. We thank Dr. Cedric Boissière at LCMCP for ellipsometry measurements.
Imaging was performed on a SU-70 HitachiFEG-SEM, instruments facilitated by the IMPC (Institut des Matériaux de Paris Centre FR2482) financially supported by the C'Nano projects of the Region Ile-de-France.
REFERENCES
(1) Stamenkovic, V. R.; Strmcnik, D.; Lopes, P. P.; Markovic, N. M. Energy and Fuels from Electrochemical Interfaces. Nat Mater 2017, 16, 57-69.
(2) Gauthier, M.; Carney, T. J.; Grimaud, A.; Giordano, L.; Pour, N.; Chang, H.-H.; Fenning, D. P.; Lux, S. F.; Paschos, O.; Bauer, C.; Maglia, F.; Lupart, S.; Lamp, P.; Shao-Horn, Y. Electrode–Electrolyte Interface in Li-Ion Batteries: Current Understanding and New Insights. J. Phys. Chem. Lett. 2015, 6, 4653-4672.
(3) Chandiran, A. K.; Zakeeruddin, S. M.; Humphry-Baker, R.; Nazeeruddin, M. K.; Gratzel, M.; Sauvage, F. Investigation on the Interface Modification of TiO2 Surfaces by Functional Co-Adsorbents for High-Efficiency Dye-Sensitized Solar Cells. ChemPhysChem. 2017, 18, 2724-2731.
(4) Bisquert, J.; Zaban, A.; Greenshtein, M.; Mora-Seró, I. Determination of Rate Constants for Charge Transfer and the Distribution of Semiconductor and Electrolyte Electronic Energy Levels in Dye-Sensitized Solar Cells by Open-Circuit Photovoltage Decay Method. J. Am. Chem. Soc. 2004, 126, 13550-13559.
(5) O'Regan, B.; Grätzel, M. A Low-Cost, High-Efficiency Solar Cell Based on Dye-Sensitized Colloidal TiO2 Films. Nature 1991, 353, 737.
(6) Bard, A. J.; Fox, M. A. Artificial Photosynthesis: Solar Splitting of Water to Hydrogen and Oxygen. Acc. Chem. Res. 1995, 28, 141-145.
(7) Lewis, N. S.; Nocera, D. G. Powering the Planet: Chemical Challenges in Solar Energy Utilization. PNAS 2006, 103, 15729-15735.
(8) Walter, M. G.; Warren, E. L.; McKone, J. R.; Boettcher, S. W.; Mi, Q.; Santori, E. A.; Lewis, N. S. Solar Water Splitting Cells. Chem. Rev. 2010, 110, 6446-6473.
(9) Nellist, M. R.; Laskowski, F. A. L.; Lin, F.; Mills, T. J.; Boettcher, S. W. Semiconductor–Electrocatalyst Interfaces: Theory, Experiment, and Applications in Photoelectrochemical Water Splitting. Acc. Chem. Res. 2016, 49, 733-740.
(10) Ratcliff, E. L.; Zacher, B.; Armstrong, N. R. Selective Interlayers and Contacts in Organic Photovoltaic Cells. J. Phys. Chem. Lett. 2011, 2, 1337-1350.
(11) Ou, K.-L.; Ehamparam, R.; MacDonald, G.; Stubhan, T.; Wu, X.; Shallcross, R. C.; Richards, R.; Brabec, C. J.; Saavedra, S. S.; Armstrong, N. R. Characterization of ZnO Interlayers for Organic Solar Cells: Correlation of Electrochemical Properties with Thin-Film Morphology and Device Performance. ACS Appl. Mater. Interfaces 2016, 8, 19787-19798.
(12) Kavan, L.; O'Regan, B.; Kay, A.; Grätzel, M. Preparation of TiO2 (anatase) Films on Electrodes by Anodic Oxidative Hydrolysis of TiCl3. J. Electroanal. Chem. 1993, 346, 291-307.
(13) Kohl, P. A.; Bard, A. J. Semiconductor Electrodes. 13. Characterization and Behavior of n-Type Zinc Oxide, Cadmium Sulfide, and Gallium Phosphide Electrodes in Acetonitrile Solutions. J. Am. Chem. Soc. 1977, 99, 7531-7539.
(14) Frank, S. N.; Bard, A. J. Semiconductor Electrodes. II. Electrochemistry at n-Type Titanium Dioxide Electrodes in Acetonitrile Solutions. J. Am. Chem. Soc. 1975, 97, 7427-7433.
(15) Pomykal, K. E.; Fajardo, A. M.; Lewis, N. S. Theoretical and Experimental Upper Bounds on Interfacial Charge-Transfer Rate Constants between Semiconducting Solids and Outer-Sphere Redox Couples. J. Phys. Chem. 1996, 100, 3652-3664.
(16) Farjardo, A. M.; Lewis, N. S. Rate Constants for Charge Transfer Across Semiconductor-Liquid Interfaces. Science 1996, 274, 969-972.
(17) Lewis, N. S. An Analysis of Charge Transfer Rate Constants for Semiconductor/Liquid Interfaces. Annu. Rev. Phys. Chem. 1991, 42, 543-580.
(18) Marcus, R. A. Chemical and Electrochemical Electron-Transfer Theory. Annu. Rev. Phys. Chem. 1964, 15, 155-196.
(19) Hush, N. S. Adiabatic Theory of Outer Sphere Electron-Transfer Reactions in Solution. J. Chem. Soc. Faraday Trans. 1961, 57, 557-580.
(20) Gerischer, H. Charge Transfer Processes at Semiconductor-Electrolyte Interfaces in Connection with Problems of Catalysis. Surf. Sci. 1969, 18, 97-122.
(21) Gerischer, H. In Photoelectrochemistry, Photocatalysis and Photoreactors: Fundamentals and Developments; Schiavello, M., Ed.; Springer Netherlands: Dordrecht, 1985, p 39-106.
(22) Memming, R. Semiconductor Electrochemistry, 2nd Edition; Wiley-VCH Verlag GmbH & Co. KGaA, 2015.
(23) Memming, R. In Photoelectrochemistry, Photocatalysis and Photoreactors: Fundamentals and Developments; Schiavello, M., Ed.; Springer Netherlands: Dordrecht, 1985, p 107-153.
(24) Gomes, W. P.; Cardon, F. Electron Energy Levels in Semiconductor Electrochemistry. Prog. Surf. Sci. 1982, 12, 155-215. (25) Koval, C. A.; Howard, J. N. Electron Transfer at Semiconductor Electrode-Liquid Electrolyte Interfaces. Chem. Rev. 1992, 92, 411-433.
(26) Beranek, R. (Photo)electrochemical Methods for the Determination of the Band Edge Positions of TiO2-Based Nanomaterials. Adv. Phys. Chem. 2011, 2011, 20.
(27) Krishnan, R. In Encyclopedia of Electrochemistry; Wiley-VCH Verlag GmbH & Co. KGaA: 2007.
(28) Wilson, R. H. Electron Transfer Processes at the Semiconductor-Electrolyte Interface. Crit. Rev. Solid State Mater. Sci. 1980, 10, 1-41.
(29) Morrison, S. R. The Chemical Physics of Surfaces; Springer US, 1977.
(30) Fredlein, R. A.; Bard, A. J. Semiconductor Electrodes: XXI . The Characterization and Behavior of n‐Type Electrodes in Acetonitrile Solutions. J. Electrochem. Soc. 1979, 126, 1892-1898.
(31) Memming, R.; Schwandt, G. Electrochemical Properties of Gallium Phosphide in Aqueous Solutions. Electrochimica Acta 1968, 13, 1299-1310.
(32) Hilliard, S.; Baldinozzi, G.; Friedrich, D.; Kressman, S.; Strub, H.; Artero, V.; Laberty-Robert, C. Mesoporous Thin Film WO3 Photoanode for Photoelectrochemical Water Splitting: a Sol-Gel Dip Coating Approach. Sus. Ener. Fuels 2017, 1, 145-153.
(33) Grätzel, M. Photoelectrochemical Cells. Nature 2001, 414, 338.
(34) Tan, Z. a.; Li, L.; Cui, C.; Ding, Y.; Xu, Q.; Li, S.; Qian, D.; Li, Y. Solution-Processed Tungsten Oxide as an Effective Anode Buffer Layer for High-Performance Polymer Solar Cells. J. Phys. Chem. C 2012, 116, 18626-18632.
(35) Guillain, F.; Tsikritzis, D.; Skoulatakis, G.; Kennou, S.; Wantz, G.; Vignau, L. Annealing-Free Solution-Processed Tungsten Oxide for Inverted Organic Solar Cells. Sol. Energy Mater. Sol. Cells 2014, 122, 251-256.
(36) Vasilopoulou, M.; Soultati, A.; Argitis, P.; Stergiopoulos, T.; Davazoglou, D. Fast Recovery of the High Work Function of Tungsten and Molybdenum Oxides via Microwave Exposure for Efficient Organic Photovoltaics. J. Phys. Chem. Lett. 2014, 5, 1871-1879.
(37) Cardona, C. M.; Li, W.; Kaifer, A. E.; Stockdale, D.; Bazan, G. C. Electrochemical Considerations for Determining Absolute Frontier Orbital Energy Levels of Conjugated Polymers for Solar Cell Applications. Adv. Mater. 2011, 23, 2367-2371.
(38) Koval, C. A.; Austermann, R. L.; Turner, J. A.; Parkinson, B. A. The Effects of Surface Energetics and Surface Oxide Layers on the Cyclic Voltammetry of Metallocenes at Nonilluminated p ‐ InP Electrodes. J. Electrochem. Soc. 1985, 132, 613-623.
(39) Morrison, S. R. The chemical physics of surfaces; Springer Science & Business Media, 2013.
(40) Xie, Z.; Gao, L.; Liang, B.; Wang, X.; Chen, G.; Liu, Z.; Chao, J.; Chen, D.; Shen, G. Fast Fabrication of a WO3.H2O Thin
Film with Improved Electrochromic Properties. J. Mater. Chem. 2012, 22, 19904-19910.
(41) Zhao, J.; Olide, E.; Osterloh, F. E. Enhancing Majority Carrier Transport in WO3 Water Oxidation Photoanode via Electrochemical Doping. J. Electrochem. Soc. 2015, 162, H65-H71.
(42) Mendieta-Reyes, N. E.; Díaz-García, A. K.; Gómez, R. Simultaneous Electrocatalytic CO2 Reduction and Enhanced Electrochromic Effect at WO3 Nanostructured Electrodes in Acetonitrile. ACS Catalysis 2018, 1903-1912.
(43) Granqvist, C. G. Electrochromic Tungsten Oxide Films: Review of Progress 1993–1998. Sol. Energy Mater. Sol. Cells 2000, 60, 201-262.
(44) Deb, S. K. Opportunities and Challenges in Science and Technology of WO3 for Electrochromic and Related Applications. Sol. Energy Mater. Sol. Cells 2008, 92, 245-258.
(45) Gupta, A.; Ifeacho, P.; Schulz, C.; Wiggers, H. Synthesis of Tailored WO3 and WOx (2.9<x<3) Nanoparticles by Adjusting the Combustion Conditions in a H2/O2/Ar Premixed Flame Reactor. Proc. Combust. Inst. 2011, 33, 1883-1890.
(46) Wang, G.; Ling, Y.; Li, Y. Oxygen-Deficient Metal Oxide Nanostructures for Photoelectrochemical Water Oxidation and Other Applications. Nanoscale 2012, 4, 6682-6691.
(47) Wang, G.; Yang, Y.; Han, D.; Li, Y. Oxygen Defective Metal Oxides for Energy Conversion and Storage. Nano Today 2017, 13, 23-39.
(48) Wang, G.; Ling, Y.; Wang, H.; Yang, X.; Wang, C.; Zhang, J. Z.; Li, Y. Hydrogen-Treated WO3 Nanoflakes Show Enhanced Photostability. Energy Environ. Sci. 2012, 5, 6180-6187.
(49) Wang, G.; Wang, H.; Ling, Y.; Tang, Y.; Yang, X.; Fitzmorris, R. C.; Wang, C.; Zhang, J. Z.; Li, Y. Hydrogen-Treated TiO2 Nanowire Arrays for Photoelectrochemical Water Splitting. Nano Lett. 2011, 11, 3026-3033.
(50) Nikitina, V. A.; Kislenko, S. A.; Nazmutdinov, R. R.; Bronshtein, M. D.; Tsirlina, G. A. Ferrocene/Ferrocenium Redox Couple at Au(111)/Ionic Liquid and Au(111)/Acetonitrile Interfaces: A Molecular-Level View at the Elementary Act. J. Phys. Chem. C 2014, 118, 6151-6164.
Table of Contents Graphic
Metal Oxide e -Electrolyte e -Redox probe Intermediate states NS v