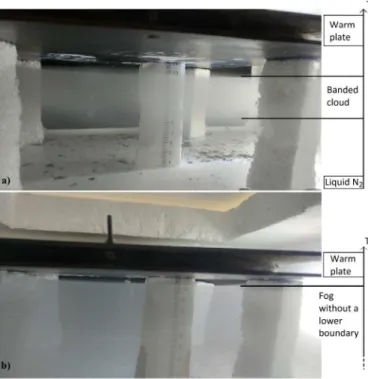
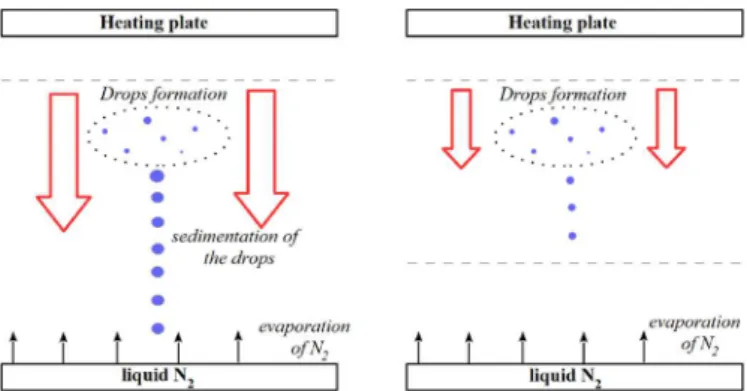
Two types of fog shapes above a cold evaporating liquid
8
0
0
Texte intégral
Figure
+3
Documents relatifs