Airborne and Grain Dust Fungal Community Compositions Are
Shaped Regionally by Plant Genotypes and Farming Practices
Loïc Pellissier,aAnne Oppliger,bAlexandre H. Hirzel,cDessislava Savova-Bianchi,bGuilain Mbayo,bFabio Mascher,d Stefan Kellenberger,d Hélène Niculita-HirzelbUnit of Ecology and Evolution, University of Fribourg, Fribourg, Switzerlanda; Department of Occupational Hygiene, Institute for Work and Health, University of Lausanne and Geneva, Epalinges-Lausanne, Switzerlandb; Computer Science Center, University of Lausanne, Lausanne, Switzerlandc; Plant Breeding and Genetic Resources, Agroscope Changins-Wädenswil, Nyon, Switzerlandd
Chronic exposure to airborne fungi has been associated with different respiratory symptoms and pathologies in occupational
populations, such as grain workers. However, the homogeneity in the fungal species composition of these bioaerosols on a large
geographical scale and the different drivers that shape these fungal communities remain unclear. In this study, the diversity of
fungi in grain dust and in the aerosols released during harvesting was determined across 96 sites at a geographical scale of 560
km
2along an elevation gradient of 500 m by tag-encoded 454 pyrosequencing of the internal transcribed spacer (ITS) sequences.
Associations between the structure of fungal communities in the grain dust and different abiotic (farming system, soil
character-istics, and geographic and climatic parameters) and biotic (wheat cultivar and previous crop culture) factors were explored.
These analyses revealed a strong relationship between the airborne and grain dust fungal communities and showed the presence
of allergenic and mycotoxigenic species in most samples, which highlights the potential contribution of these fungal species to
work-related respiratory symptoms of grain workers. The farming system was the major driver of the alpha and beta
phyloge-netic diversity values of fungal communities. In addition, elevation and soil CaCO
3concentrations shaped the alpha diversity,
whereas wheat cultivar, cropping history, and the number of freezing days per year shaped the taxonomic beta diversity of these
communities.
O
ccupational exposure to grain dust is associated with both
acute and chronic effects on the respiratory tract. The main
reported respiratory effects of exposure to grain dust are asthma
and acute asthma-like symptoms (
1
), reduced lung volume, and
symptoms evoking chronic bronchitis (
2
,
3
). However, the
etiol-ogy of these effects is not completely understood, mainly because
of the complexity and variety of potentially causative agents
within grain dust. Indeed, grain dust is a generic name for the dust
generated by handling different species as well as cultivars of cereal
crops. Grain dust is of heterogeneous composition, consisting of
the variable microbial flora associated with multiple plants,
frag-ments of wheat plants and seeds generated by their abrasion when
handled, fragments of insects and mites, particles of inorganic
matter, and pesticides (
4
). Although several of these components
might affect respiratory health by acting through different
mech-anisms, the adverse health effects of an exposure to high levels of
airborne fungi (2
⫻ 10
9spores/m
3in grain workers with organic
dust toxic syndrome; 1
⫻ 10
8to 4
⫻ 10
8spores/m
3in farmers with
hypersensitivity pneumonitis [HP]; 3
⫻ 10
6to 1
⫻ 10
7spores/m
3in nonsymptomatic individuals) (
5
) direct the research on the
etiology of these respiratory diseases toward the nature and the
diversity of these biological agents within and between samples.
Indeed, although several fungal species were identified as causes of
HP (
6
) or asthma (
7
) in other occupational populations, limited
information on the fungal species identified as causes of these
pathologies and on the frequency of these species in the aerosols
inhaled by the grain workers is available. Thus, evaluating the
homogeneity of exposure to harmful fungi during grain and straw
handling as well as identifying the abiotic and biotic factors that
might shape the structure of the fungal community in grain dust
will allow for the targeting of measures to prevent respiratory
im-pairment in grain workers.
Wheat is a major crop in Western Europe. For this reason, the
study of its associated fungal communities, particularly of its
fun-gal pathogens, is of significant economic and health interest.
Pre-vious studies of wheat-associated fungal communities revealed a
large number of operational taxonomical units (OTUs) that are
dominated by a few basidiomycete yeasts (e.g., Cryptococcus and
Sporobolomyces roseus), filamentous saprobes (e.g., Alternaria,
Cladosporium, and Epicoccum), and plant pathogens (Fusarium)
(
8
,
9
). Among these plant pathogens, the Fusarium species
com-plex, which is responsible for Fusarium head blight (FHB) (
10
),
produces a range of secondary metabolites in the infected host
plant that are harmful to human health when they are ingested
and potentially when they are inhaled (
11
). Moreover, Alternaria,
Cladosporium, and Epicoccum are well known for their allergenic
properties (
7
). Although the drivers of wheat phytopathogen
in-fection, such as climatic factors, wheat cultivar, and cropping
his-tory, have been intensively studied (
12
), little is known about the
factors that shape the structure of entire fungal communities (e.g.,
pesticides) (
13
), and even less is known about fungal diversity in
Citation Pellissier L, Oppliger A, Hirzel AH, Savova-Bianchi D, Mbayo G, Mascher F, Kellenberger S, Niculita-Hirzel H. 2016. Airborne and grain dust fungal community compositions are shaped regionally by plant genotypes and farming practices.
Appl Environ Microbiol 82:2121–2131.doi:10.1128/AEM.03336-15.
Address correspondence to Hélène Niculita-Hirzel, Helene.Hirzel@hospvd.ch.
Supplemental material for this article
Published in "Applied and Environmental Microbiology 82(7): 2121–2131, 2016"
which should be cited to refer to this work.
airborne dust generated during wheat harvesting. Thus, currently
the homogeneity of the exposure of grain workers to fungal
aero-sols from one field to another during their work is difficult to
estimate. There is a need to identify the factors that shape the
fungal community composition that is aerosolized from wheat
dust to better characterize the exposure of grain workers.
The structures of fungal communities in aboveground
ecosys-tems can be shaped by various drivers. One known selective filter
is the plant. Major differences in aboveground fungal community
composition have been noticed between plant species (
14
) and
genotypes (
15
,
16
). Another selective filter is the environment.
Gradients of elevation (
17
), temperature, and rainfall (
18
) as well
as variations in soil nutrient content (
19
) have all been associated
with changes in aboveground fungal assemblage. In temperate
regions, even seasonal thermal fluctuations have been shown to
affect the dynamics of plant pathogens (
20
,
21
). In landscapes
disturbed by agricultural practice, an additional selective filter acts
on aboveground fungal communities: the fungicide treatments
(
13
,
22
). However, no studies have simultaneously investigated
how farming system, environmental variables, and plant cultivars
affect the composition of fungal communities along ecological
gradients and what are the consequences of these eventual changes
on fungal particles aerosolized during plant handling. Thus,
iden-tifying the determinants of the fungal community structure will
help us propose efficient preventive measures for the harvesters
who are exposed to it.
The aims of this study were the following: (i) to identify the
abiotic (e.g., climate and geographic parameters) and biotic (e.g.,
plant cultivar and farming system) drivers that might shape the
fungal community structure in grain dust; (ii) to determine the
similarity between the fungal community structure in grain dust
and that in the aerosols released during harvesting; and (iii) to
identify the allergenic and mycotoxigenic species to which grain
workers are usually exposed during the harvesting activities. We
used 454 sequencing of amplicons from the fungal internal
tran-scribed spacer 1 (ITS1) of the ribosomal DNA to determine the
composition of fungal communities associated with wheat grain
dust and with aerosols collected during harvest from farms that
are managed organically, extensively, and conventionally. Then,
we used a combination of multivariate statistical approaches,
in-cluding model selection procedures (
23
,
24
) and multivariate
analyses (
25
,
26
), which have been used for decades to study
vari-ation among communities of macroorganisms and, in recent
years, among communities of microorganisms (
27
,
28
), to study
assemblages of fungal species.
MATERIALS AND METHODS
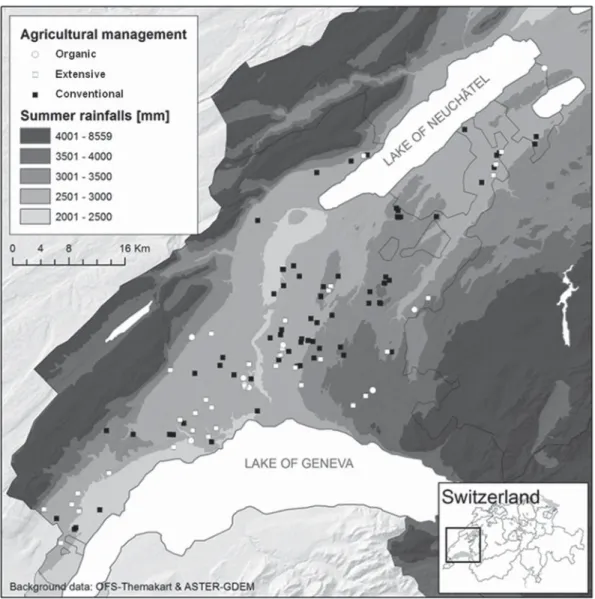
Study site and sampling design. This study was conducted in the grain-growing region of Vaud in Switzerland, which provides approximately 25% of Switzerland’s internal consumption of wheat and covers approx-imately 560 km2(Fig. 1). In this region, the elevation ranges from 300 to
800 m, and the annual mean air temperature and precipitation are quite variable (Fig. 1). Interestingly, in this geographic region there is no corre-lation between the elevation and the number of freezing days although the elevation and the annual or summer precipitation are positively corre-lated (see Fig. S1 in the supplemental material). Wheat is produced in one of the following farming systems: conventional, extensive, or organic farming. The differences among these three farming systems are described inTable 1. Note that no fungicides are applied on the fields in the exten-sive and organic farming systems and that all fields were lowed prior to seeding. In the conventional farming system, the fungicide applications
occurred at BBCH (Biologische Bundesanstalt, Bundessortenamt, and chemical industry) wheat growth stages 30 to 32 and 45 to 51. Detailed information on the fungicide applications in each field is provided in Table S1 in the supplemental material. The grain is ready to be harvested when it loses its moisture at the end of the ripening stage. During this last stage, the plant undergoes senescence and finally dies.
Samples were collected from 98 fields that were cultured with winter wheat (67 conventional, 24 extensive, and 7 organic fields) (Fig. 1), 3 with triticale (2 conventional fields and 1 organic field), and 2 with spelt wheat (both, organic fields) at the full ripening stage (BBCH stages 95 to 100) during the harvesting process between 15 July and 7 August 2010. The fields were chosen randomly and stratified by the elevation gradient (29). Overall, the samples represent the diversity of farming practices of the canton of Vaud with respect to wheat cultivars, wheat species (winter wheat, spelt wheat, and triticale), soil types, fertilization, and fungicide treatments.
The sampling consisted of collecting aerosols, grains, and soil from each field site during the harvesting process. Aerosols were collected on a gelatin filter at a flow rate of 2.0 liters min⫺1for 70 min on average (minimum, 11 min; maximum, 400 min) (see Table S2 in the supplemen-tal material) using a pocket pump (MSA Escort Elf [Mine Safety Appli-ance Company, Pittsburgh, PA, USA] or SKC pocket pump 210-1002 [SKC, Inc., USA]) and clear styrene cassettes with three sections (25-mm diameter; SKC, Inc.). The pump was placed on the harvester 3 m above the soil surface. The temperature, barometric pressure, and relative air hu-midity were measured at each sampling site with a thermo-hygrometer and barometer (PCE-THB 40; PCE Group Iberica). Wind intensity was estimated as absent, low, middle, or strong (see Table S2). A 1-kg sample of harvested grain was collected from the bin. Ten soil cores were sampled from the organo-mineral horizon (10 cm deep) every 20 m. The gelatin filters and grain and soil samples were kept at 4°C during transportation back to the lab. Once in the lab, the aerosol samples (the gelatin filters) were stored at 4°C for 12 h, and the grain samples were frozen at⫺20°C until DNA analyses could be performed. The soil samples from each field were processed immediately.
Collection of climatic variables and farming practices. Two groups of environmental variables were used in this study: climatic and soil vari-ables (see Table S3 in the supplemental material). Climatic varivari-ables and wind speed and direction were recorded by the Swiss network of meteo-rological stations and interpolated using a digital elevation model at 25-m resolution (30,31). The location of the weather stations, monthly mean precipitation, and mean temperature in June, July, and August 2010 are illustrated in Fig. S2 in the supplemental material. The data can be found at the Swiss office of meteorology and climatology, MeteoSwiss (http: //www.meteoswiss.admin.ch/). For describing the average monthly time courses of temperature and precipitation and the number of freezing days across Vaud, all of the stations that delivered data during the period from 1961 to 2010 covering the entire studied region were selected.
Farming practices, including the wheat cultivar, the cropping history over the last 5 years, tillage, fertilization, and fungicide treatments (Table 1), were recorded directly from each farmer according to a standardized questionnaire. Data on the incidence of wheat diseases in 2010 in the wheat fields of Vaud, such as FHB (percentage of symptomatic heads), powdery mildew, rust, septoria, or eyespot (percentage of leaves), came from a cereal disease monitoring program coordinated by the phytosani-tary office of the canton of Vaud (A. Zimmermann, personal communi-cation). The severity of FHB was estimated by the visual inspection of 200 grains from each field after harvesting.
Generation of soil chemical variables. The soil chemical variables were determined from the 10 soil cores sampled from each field that were pooled to smooth out the intrafield variation. The soil samples were dried in an oven at 40°C for 48 h, ground, and sieved through a 2-mm-pore-size sieve. The pH was measured with an automatic system in a solution con-taining 20 g of dry soil and 50 ml of water. The total nitrogen (Ntot) and
Kjeldahl method. The organic carbon content (Corg) was estimated by
removing the amount of mineral carbon that was derived by calcimetric analyses. The total phosphorus (Ptot) and available phosphorus (Pa)
con-tents were determined using the ignition method developed by Saunders and Williams (32), which has been shown to be fairly reliable for weakly weathered soils (33). All of the soil analyses were performed by Sol-Con-seil (Nyon, Switzerland).
DNA extraction, PCR, and 454 pyrosequencing. Wheat grain dust was obtained from 100 g of grain by shaking the grain with 50 ml of 0.9% NaCl for 1 min and by centrifuging the liquid phase for 30 min at 8,500⫻
g. The gelatin filters were shaken at room temperature for 15 min in 6 ml
of 0.9% NaCl before centrifugation under conditions identical to those
used for grain dust. The recovered pellet from both types of samples was mechanically disrupted with a Tissue Lyser (Qiagen) in the first buffer of a FastDNA Spin Kit for Soil (MP Biomedicals, Switzerland). Then, the total DNA was extracted according to the manufacturer’s instructions.
The internal transcribed spacer 1 (ITS1) region was amplified on a Biometra PCR thermal cycler using the forward primer ITS1F (34) and the reverse primer ITS2 (35). The 454 A adapter and a 10-bp molecular identification (MID) tag were appended to the 5= end of the ITS1F primer to allow for sample multiplexing as described in Pellissier et al. (28). The 454 B adapter sequence was added at the 5= end of the ITS2 primer. PCR was performed in 50-l reaction mixtures with 50 ng of DNA, 0.2 M each primer, 200l of each nucleotide, 1 U of peqGOLD Taq DNA Poly-FIG 1 Study area in the grain-growing region, the canton of Vaud, Switzerland. The dots correspond to the sampled wheat fields. Each type of dot corresponds to a wheat field that was managed by a distinct farming system: white circles represent organic farming, white squares represent extensive farming, and black squares represent conventional farming. The background represents the summer rainfall level. Elevation and rainfall were strongly correlated.
TABLE 1 Description of the farming systems used to cultivate wheat in the study area
Farming system Tillage Fertilizer type Herbicide Insecticide Fungicide Plant growth regulator N input type Soil pH correction
Organic Yes Organic No No No No Organic No
Extensive Yes Petrochemical Yes No No No Mineral No
merase (PeqLab, Switzerland), 1⫻ PCR buffer S, and 1⫻ Enhancer solu-tion P. The PCR condisolu-tions were as follows: denaturasolu-tion at 94°C for 3 min, followed by 25 amplification cycles of 30 s at 94°C, 35 s at 50°C, and 90 s at 72°C, with a 7-min final extension at 72°C. The PCR products were visualized using gel electrophoresis. Ninety-six grain dust samples (68 from conventional, 20 from extensive, and 8 from organic farming) and 76 airborne samples (52 from conventional, 16 from extensive, and 8 from organic farming) were successfully amplified. The amplicons were cleaned using a QIAquick PCR Purification kit (Qiagen, Switzerland), quantified using a Quant-iT PicoGreen dsDNA Assay kit (Life Technolo-gies, Switzerland), and pooled in equimolar concentrations. The sequenc-ing was performed on 5/16 of a plate on a GS FLX Titanium sequencer (Life Sciences/Roche Applied Biosystems, Switzerland) by Microsynth, Switzerland.
Bioinformatics analyses. The raw reads were sorted by MID se-quence. Sequences with no mismatch within the MID and the ITS2 primer sequence were retrieved and then denoised with a Denoiser 0.851 (36). The highly variable ITS1 region was extracted with an ITS extractor pro-gram (37). The sequences shorter than 100 bp were removed. The cleaned sequences were grouped into operational taxonomic units (OTUs) using the UCLUST algorithm (38) implemented in the pick_otus function of QIIME (39) at a 97% sequence similarity cutoff. The OTUs were given taxonomic assignment in QIIME based on a previously published se-quence database (28) modified for QIIME compatibility. When the tax-onomy assigned was ambiguous, DBC454, a clustering tool which allows the identification of sequences not correctly assigned in GenBank, was used to resolve the ambiguity (40).
Only nonsingleton OTUs were retained for further analysis. Nonphy-logenetic diversity estimates using Chao1 and observed species numbers for alpha diversity and Bray-Curtis for beta diversity calculations were carried out. Alpha diversity matrices based on observed species at the sample level were used to produce rarefaction curves using EstimateS, version 9.1.0 (41,42). Good’s estimator of coverage was calculated in QIIME.
Alpha diversity of fungal assemblages. Two measures of alpha diver-sity, the taxonomic and the phylogenetic alpha diverdiver-sity, were calculated and correlated with the biotic, abiotic, and management variables men-tioned in Table S3 in the supplemental material. Each of these two mea-sures accounts for the abundance of the nonsingleton OTUs assigned as fungi. The Shannon diversity index was used as a measure of taxonomic alpha diversity. The net relatedness index (NRI) implemented in the Pi-cante, version 1.6, package in R (43), together with a tree of the OTUs generated on the basis of known phylogenetic relationships between tax-onomically assigned OTUs (44), was used as a measure of the phyloge-netic alpha diversity. The NRI is a standardized effect size (SES) of the observed mean pairwise phylogenetic distance (MPD) of all of the species in a community. Null models were built by reshuffling the tip label on the fungal phylogeny in a way that preserved the important property over the study area (e.g., species prevalence and species richness).
The correlations between the taxonomic diversity (Shannon) and phylogenetic (NRI) alpha diversities and different abiotic, biotic, and management variables were assessed by a multiple ordinary least-squares (OLS) regression model that included all of these variables. Based on the full OLS regression model, information-theoretic-based model selection was undertaken by comparing all of the competing models, including all of the possible combinations of variables. To do so, we used the Akaike information criterion (AIC) to quantify the support for each model (23). The selection of the minimum adequate model (MAM) was based on the lowest AIC value. From all of the subset models, we calculated the Akaike weight (w), which can be interpreted as the probability that a specific model is the best (23). We then estimated the relative importance of each predictor in explaining the fungal species richness by summing the Akaike weight values across all of the models that included the predictor variable (23,24,45). These summed Akaike weights (weighted AIC, or WAIC) ranged from 0 to 1, thereby providing a means for ranking the predictor
variables in terms of information content. These analyses were performed using the package MuMIn in R (23).
Beta diversity of fungal assemblages. As a measure of taxonomic beta diversity, we calculated the pairwise variation in composition using the Jaccard dissimilarity index with the vegdist function implemented in the Vegan R package (46). To determine the fungal phylogenetic beta diver-sity, the mean pairwise distance was calculated using the comdist function in the Picante, version 1.6, package (43). The standardized effect size of the mean phylogenetic distance across communities was computed in the same way used for the NRI by calculating a standardized effect size, as described by Swenson (47) and Pellissier et al. (48). Finally, the two beta diversities, taxonomic and phylogenetic, were correlated with the varia-tion in abiotic and biotic variables and with the differences in farming systems (Table 2). The significance was tested using Mantel tests and 9,999 permutations.
Comparison between grain and airborne fungal communities. To estimate the similarity between grain dust and aerosol fungal communi-ties, the prevalence of nonsingleton OTUs in the grain dust and aerosols was determined. Because the number of successfully sequenced samples was uneven between the grain and airborne samples, only the fields from which both the grain dust and airborne fungal communities were ob-tained were reob-tained for further analysis. A coinertia analysis was run using the function coinertia implemented in the ade4 R package (49) to test for the shared structures between the grain dust and the aerosol fungal compositions from each field. The significance of the correlation was tested using a randomization test implemented in the Vegan R package. The null hypothesis was that species are present in the air according to their prevalences on the grain (i.e., rare species on the plant are found rarely in the air, whereas frequent species on the plant are found fre-quently in the air). This relationship should be close to a 1:1 relationship. A Wilcoxon test was performed to assess differences in the number of OTUs between the different farming systems. Linear regressions using the “lm” function in R were employed to calculate the relationship between the relative abundances of Fusarium OTUs and the average score of FHB severity on grain.
Nucleotide sequence accession numbers. The raw sequence data are available at the NCBI under BioProject accession numberPRJNA240301, and the representative OTUs have been deposited in GenBank under accession numbersKT886526toKT886841.
RESULTS
Diversity of grain and aerosol fungal communities. We
assem-bled an extensive spatial data set of the fungi present in 96 grain
TABLE 2 Factors influencing the fungal alpha diversity described by the Shannon index or phylogenetic diversity (NRI)aDiversity measure and factor (unit) R2 Estimate P valueb WAIC
Shannon index (R2⫽ 0.31)
CaCO3(mg kg⫺1) 0.13 ⫺0.3225 ** 1
Elevation (m) 0.04 0.6272 ** 0.8
Annual rainfall (mm) 0.03 ⫺0.6056 * 0.74
No. of freezing days/year 0.03 ⫺0.2477 * 0.51
Corg(mg kg⫺1) 0.02 0.1529 0.4
pH 0.03 0.2443 0.22
Pa(mg kg⫺1) 0.06 ⫺0.2367 0.15
K (mg kg⫺1) 0.02 0.1844 0.07
Phylogenetic diversity (R2⫽ 0.32)
Extensive vs organic system 0.27 ⫺0.2682 ** 1 Extensive vs conventional system 0.2719 **
Annual rainfall (mm) 0.07 ⫺0.1953 * 0.54
aThe table shows the coefficient of determination (R2) and the standardized regression
coefficients estimated from ordinary least-squares multiple regression (OLS) of the minimum adequate model (MAM) with the lowest AIC. The relative importance of each predictor variable was assessed using the summed Akaike weights (WAIC).
dust samples and 76 aerosols released during the harvesting
pro-cess of the 96 fields. These fields were spread across a region of 560
km
2and along an elevation gradient of 500 m (
Fig. 1
). Twenty-two
different winter wheat cultivars, the triticale, and the spelt wheat
were represented. After quality filtering, denoising, the removal of
chimera and short sequences, and the extraction of the ITS1
vari-able region, a total of 115,777 sequences were retained. The
aver-age read length was 281 bp. The averaver-age number of sequences in
each grain dust sample was 933
⫾ 390, and the average number of
sequences in each airborne sample was 708
⫾ 274 (means ⫾
stan-dard deviations [SD]). Rarefaction and species accumulation
curves indicated that the sequencing depth was sufficient to cover
the fungal diversity. Good’s coverage indicated that we recovered
most of the expected OTUs for all of the air and grain dust samples
(median
⫾ SD for grain samples, 95.5% ⫾ 1.1%; median for
aero-sol samples, 95.5%
⫾ 1.9%) (see Table S4 in the supplemental
material). The number of OTUs detected in the grain dust samples
was significantly higher than that within the aerosol samples,
in-dependent of the farming system (median numbers of OTUs that
were found in the grain samples were 30.5, 30.0, and 32.0, and in
the aerosol samples the median numbers of OTUS were 19.0, 20.5,
and 22.0 in the fields that were managed following organic,
exten-sive, or conventional protocols, respectively; Wilcoxon test, W
⫽
2,533; P
⬍ 0.0001 for the Shannon overall diversity indices
be-tween the grain dust and aerosol samples) (see Table S4). Despite
this difference, the fungal communities associated with the grain
and those found in the associated aerosols shared significant
as-semblage structures, as shown by the coinertia analysis (coinertia
coefficient [RV]
⫽ 0.17; P ⬍ 0.0001). Moreover, the abundance of
the fungal OTUs in the grain dust was highly correlated with that
in aerosols (R
2⫽ 0.99, P ⬍ 0.0001) (
Fig. 2
). Thus, the abundant
OTUs in the grain dust samples were also abundant in the aerosol
samples, whereas the OTUs that were scarcely represented in the
grain dust were also rare in the aerosol samples.
Taxonomic composition of wheat-associated fungal
com-munity. In total, 319 OTUs were obtained, of which 197 OTUs
were identified to the species or genus level as fungi (see Table S5
in the supplemental material). The majority of the remaining
OTUs corresponded to fungal species that were not isolated by
culture, namely, uncultured fungi in GenBank (116 OTUs), with
only one being identified as a nonfungus, a plant species
(Pleurop-terus multiflorus). However, for five OTUs, we found no similarity
with any GenBank sequence. Concerning the representativeness
of these OTUs in the data set, 43 OTUs were singletons, 75 OTUs
were doubletons, and 78 OTUs were represented by more than 20
sequences. The abundant OTUs were more easily assigned than
the rare ones. Therefore, only 37% of the OTUs represented by 2
to 19 sequences could be assigned, whereas 78.5% of those with
more than 20 sequences were identified at the genus or species
level.
Overall, pyrosequencing revealed 37 different fungal genera
that were assigned to the phylum Ascomycota (59% of the OTUs)
or Basidiomycota (41% of the OTUs). Of the 37 fungal genera, 30
corresponded to 13 different orders of Ascomycota, and 7
corre-sponded to five orders of Basidiomycota, encompassing primarily
phytopathogenic (44%) and saprobe (40%) fungal species (see
Table S5 in the supplemental material). However, two fungal
classes, the Tremellomycetes and the Dothideomycetes, contributed
⬃60% of the taxon richness. The most frequent species
be-longed to Pleosporales, Capnodiales, Hypocreales, Filobasidiales,
and Erythrobasidiales (
Fig. 3
). Among them, several allergenic
spe-cies, members of the genera Epicoccum, Alternaria, and
Cladospo-rium, were present in almost all of the grain dust and aerosol
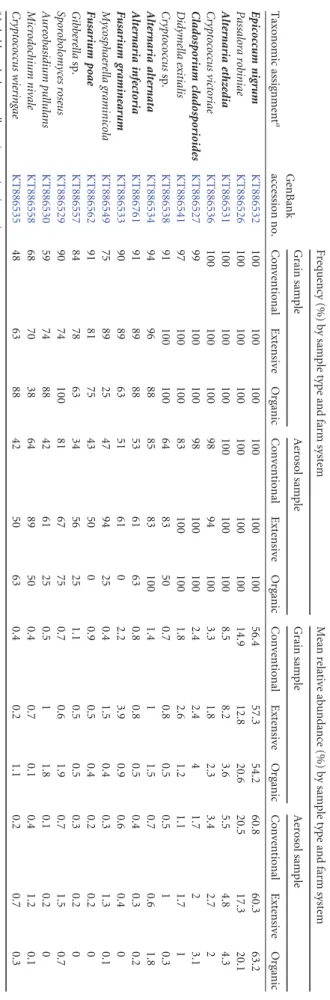
samples. Toxigenic species (members of Fusarium) were also
fre-quently detected in more than 81% of the grain dust samples and
in 43 to 61% of the aerosol samples (
Table 3
; see also Table S6 in
the supplemental material). The relative abundance of the most
frequent Fusarium species in the grain dust and aerosol samples
was found to significantly correlate with the severity of FHB
dis-ease (correlation coefficient of 0.029 and P value of 0.000 for grain
dust and correlation coefficient of 0.386 and P value of 0.000 for
aerosol). The low frequency and abundance of the other wheat
pathogens Blumeria graminis, Puccinia spp., Mycosphaerella
graminicola, Phaeosphaeria avenaria f. sp. triticae, Phaeosphaeria
nodorum, and Pyrenophora tritici-repentis in the 454 data set was
confirmed by the low incidence of the corresponding diseases in
wheat in the year of the sampling (unpublished data).
The majority of the OTUs assigned as fungi were shared
be-tween grain and aerosol samples (73% of nonsingleton OTUs;
96.8% of the OTUs were represented by at least 20 reads) (
Table 3
;
see also Table S6 in the supplemental material). Fifty nonsingleton
OTUs were detected only in grain samples, and seven OTUs were
isolated only from aerosol samples (see Table S6).
Alpha diversity of the fungal communities. We considered
only the 197 assigned OTUs to calculate the taxonomic and
phy-logenetic diversities. These two diversity indexes were found to
correlate significantly with different abiotic and biotic interfering
variables at the local scale (alpha diversity) or among habitats
(beta diversity).
The Shannon alpha diversity of fungal communities was found
to be negatively related to one geographic variable (elevation), two
climatic variables (annual rainfall and the number of freezing days
per year), and one soil variable (the amount of CaCO
3). In
con-trast, the phylogenetic alpha diversity of fungal communities was
FIG 2 Correlation between the OTU prevalence in the grain and aerosols thatwere released during the harvesting of the corresponding fields. All of the OTUs appear to be aerosolized in the same proportion as their prevalence on the grain.
significantly associated only with the farming systems and the
an-nual rainfall (
Table 2
and
Fig. 4
). Thus, the diversity slightly
in-creased in the samples that originated from organic farming
es-sentially because of an increase in the proportion of the saprobe
and epiphyte species, such as Aureobasidium pullulans.
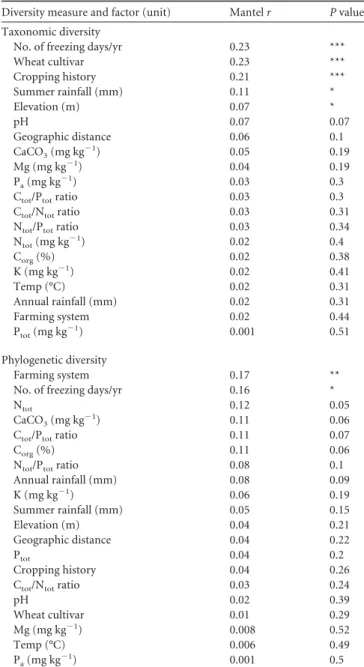
Beta diversity of the fungal communities. The taxonomic
beta diversity of the fungal communities differed between the
wheat cultivars, depended on the cropping history, and was found
to be significantly correlated with summer rainfall, the number of
freezing days/year, and elevation (
Table 4
). The phylogenetic
composition was significantly related only to the farming system
and to the number of freezing days per year (
Table 4
and
Fig. 4
).
However, although the frequencies of some allergenic species such
as Aureobasidium pullulans differed between the farming systems,
no significant difference in the frequencies of other allergenic
(Alternaria, Cladosporium, and Epicoccum) and mycotoxigenic
(Fusarium) species depending on the farming system was found
(
Table 3
).
Note that in the study area, elevation was positively related to
summer precipitation (R
2⫽ 0.78) but not to the number of
freez-ing days. Thus, summer precipitation, and not elevation, is likely
to be the most proximal variable affecting fungal communities.
DISCUSSION
In this study including 96 grain and 76 aerosols samples, we
char-acterized the mycobiome to which the grain workers are exposed
during wheat harvesting, and we simultaneously examined how
farming system, environmental variables, and plant cultivars
af-fect the composition of fungal communities along ecological
gra-dients. Our results show a relatively homogenous composition of
fungal communities in wheat grain dust across the 96 fields
de-spite the large geographic scale (560 km
2). The strong relationship
found between the airborne and grain dust fungal communities
suggests that grain workers are exposed to a relatively
homoge-nous composition of fungal species during wheat harvesting.
However, some variation in the wheat-related fungal community
composition and diversity emerged. The farming system was
identified as the major driver of the alpha and beta phylogenetic
diversity of fungi although cultivar, cropping history, and the
number of freezing days per year were the major factors shaping
the taxonomic beta diversity of fungal communities. In particular,
the frequency of some allergenic species such as Aureobasidium
pullulans was found to be different between the farming systems.
However, no significant differences in the frequency of other
al-lergenic (Alternaria, Cladosporium, and Epicoccum) or
mycotoxi-genic species between farming systems or cultivars were found.
Only the degree of severity of FHB diseases might play a role in the
level of Fusarium particles in the air.
The decrease in fungal community similarity with increasing
geographic distance is one of the most discussed aspects in fungal
community ecology. Our results showed that the fungal
commu-nity in grain dust was relatively homogenous at distances as large
as hundreds of kilometers. In concordance with this, Sapkota et al.
(
16
) found that crop genotype at the species level and fungicide
treatment had a much stronger effect than geographic distance on
wheat fungal communities. The homogeneity of the
wheat-asso-ciated fungi in grain dust has a direct impact on the fungal
parti-cles aerosolized during the harvesting of wheat. Indeed, the
me-chanical process of harvesting breaks the fungal mycelia that were
present on the wheat plants into small fragments, forcefully
re-leases fungal spores from foliage, grain, and straw, and creates a
cloud of fungal fragments and spores in the air. Thus,
indepen-dently of their spore size (
Table 2
), particles of fungi growing on
the plant might be mechanically projected into the air. The overall
high frequency of some species compared to that of others may
actually result from differences in fungal strategies for colonizing
wheat. After human perturbations of the domesticated plant
eco-system, the regional fungal species pool may consist of a restricted
number of ubiquitous species that can cope with the frequent
temporal variability in agricultural management.
Although the variation in fungal community diversity is low,
this variation was sufficient to allow detection of the major factors
that shape the taxonomic and phylogenetic diversity of the fungal
community. The major selective filter on the phylogenetic
diver-sity of the aboveground fungal community is the farming system.
Indeed, the fungal phylogenetic diversity has been found to be
statistically higher in organic than in extensive farming but lower
in extensive farming than in a conventional system. Whereas
con-FIG 3 Fungal community composition in wheat grain dust and in aerosols at the order level depending on the farming systems: conventional, extensive, and organic. The data are represented as the percentage of OTUs affiliated to one particular order that was detected in the samples taken from each farming system.ventional and extensive farming systems share the same wheat
varieties, the difference in fungal phylogenetic diversity values
be-tween the two farming systems indicates that the local fungal
com-munities of conventional fields contain fungal species that are
more distantly related to one another than those contained in
extensive fields. This finding suggests that closely related species
compete more strongly or are under more distinct environmental
constraints in the conventional farming system than in the
exten-sive farming system (this concept is reviewed by Cavender-Bares
et al. [
50
]). The major difference between these two farming
sys-tems that is expected to affect fungal community structure is the
application of fungicides. Previous studies have presented
evi-dence of the effects of fungicide treatment on fungal community
structure (
13
,
16
). Thus, we suggest that fungicide application
might be one of the factors that differentiate the fungal
commu-nity compositions between the extensive and conventional
farm-ing systems. Even more differences between the conventional and
extensive systems are expected in conventional farms with a more
intensive use of fungicides. Indeed, the reduced use of fungicides
in the conventional farms the year of sampling is explained by the
low disease pressure (A. Zimmermann, personal
communica-tion). Nevertheless, because the correlations between farming
sys-tems and fungal community phylogenetic diversity are only
par-tial and because only some cultivars are shared between the
extensive and conventional systems and hardly any between the
organic system and the two others, we cannot exclude the role of
wheat cultivars in shaping the diversity of the associated fungal
community. A controlled experimental design would allow us to
better disentangle the relative effect of each factor.
Although wheat cultivars and species were not identified in this
study to act on the phylogenetic diversity of the fungal
commu-nity, they were determined to be the major selective filter on the
beta taxonomic diversity of this community. These results
con-firmed the major role played by plant genotype on the structure of
aboveground fungal communities, as previously proposed for
grain fungal communities (
16
) and for wheat fungal
phytopatho-gens (
51
). Thus, the selection of wheat cultivars for their resistance
to different wheat diseases affects the infection of wheat not only
by the fungal phytopathogens but also by the other members of
the fungal community. In addition, our results provide evidence
that cropping history might influence both the diversity of fungal
phytopathogens (
51
,
52
) and the overall diversity of the fungal
community. These findings are similar to those previously
pub-lished by Nicolaisen et al. (
9
).
Climatic factors such as summer precipitation and the number
of freezing days per year have also been identified in the present
study to shape taxonomic fungal community diversity. Weather
conditions during the postanthesis period have previously been
shown to affect the composition of Fusarium communities in
win-ter wheat grain, and rainfall during the flowering stage is a major
determinant of grain infection by Fusarium (
12
,
51
). Our results
illustrate the role of climate on the overall taxonomic diversity of
fungi. Thus, by favoring Fusarium infection, summer rainfall
in-directly reduces overall fungal diversity. Moreover, the winter
cli-matic conditions have been shown to affect pathogen survival
de-pending on host and pathogen life histories. Thus, fungal disease
prevalence might decrease in years with more days of exposure
to subzero temperature (e.g., for wheat, the Puccinia striiformis
system [
53
], and for plantago, the Podosphaera system [
20
]).
Although our results cannot directly show the impact of the
TABLE 3 The relative abundances of the most frequent OTUs in the grain and aerosol samples, depending on the farming system Taxonomic assignment a GenBank accession no. Frequency (%) by sample type and farm system Mean relative abundance (%) by sample type and farm system Grain sample Aerosol sample Grain sample Aerosol sample Conventional Extensive Organic Conventional Extensive Organic Conventional Extensive Organic Conventional Extensive Organic Epicoccum nigrum KT886532 100 100 100 100 100 100 56.4 57.3 54.2 60.8 60.3 63.2 Passalora robiniae KT886526 100 100 100 100 100 100 14.9 12.8 20.6 20.5 17.3 20.1 Alternaria ethzedia KT886531 100 100 100 100 100 100 8.5 8.2 3.6 5.5 4.8 4.3 Cryptococcus victoriae KT886536 100 100 100 98 94 100 3.3 1.8 2.3 3.4 2.7 2 Cladosporium cladosporioides KT886527 99 100 100 98 100 100 2.4 2.4 4 1.7 2 3.1 Didymella exitialis KT886541 97 100 100 83 100 100 1.8 2.6 1.2 1.1 1.7 1 Cryptococcus sp. KT886538 91 100 100 64 83 50 0.7 0.8 0.5 0.5 1 0.3 Alternaria alternata KT886534 94 96 88 85 83 100 1.4 1 1.5 0.7 0.6 1.8 Alternaria infectoria KT886761 91 89 88 53 61 63 0.8 0.8 0.5 0.4 0.3 0.2 Fusarium graminearum KT886533 90 89 63 51 61 0 2.2 3.9 0.9 0.6 0.4 0 Mycosphaerella graminicola KT886549 75 89 25 47 94 25 0.4 1.5 0.4 0.3 1.3 0.1 Fusarium poae KT886562 91 81 75 43 50 0 0.9 0.5 0.4 0.2 0.2 0 Gibberella sp. KT886557 84 78 63 34 56 25 1.1 0.5 0.5 0.3 0.2 0 Sporobolomyces roseus KT886529 90 74 100 81 67 75 0.7 0.6 1.9 0.7 1.5 0.7 Aureobasidium pullulans KT886530 59 74 88 42 61 25 0.5 1 1.8 0.1 0.2 0 Microdochium nivale KT886558 68 70 38 64 89 50 0.4 0.7 0.1 0.4 1.2 0.1 Cryptococcus wieringae KT886535 48 63 88 42 50 63 0.4 0.2 1.1 0.2 0.7 0.3 a In bold are the known allergenic or toxigenic species.
number of freezing days per year on pathogen survival, they
nonetheless suggest such an impact by the decrease in species
diversity with the number of freezing days. Concerning the
impact of soil parameters, only CaCO
3was shown to impact
the fungal community structure, which suggests a limited
ex-change between soil and plant-associated fungi or a limited
indirect effect on plant-associated fungi through the effect of
soil characteristics on the plant.
The similarity of the fungal communities in grain dust and in
the associated aerosols is an important finding for the
occupa-tional exposure sciences. Thus, grain dust samples can be used in
place of air samples to predict the fungal species present in aerosol
during harvesting. This information could be useful for future
epidemiological studies on respiratory health in grain workers.
The frequent detection of several allergenic (genera Epicoccum,
Alternaria, and Cladosporium) and mycotoxigenic (genus
Fusar-ium) species highlights the species that might be monitored in
such epidemiological studies. Nevertheless, particular attention
should be given to members of the genus Fusarium which are
known to produce highly toxigenic secondary metabolites for
hu-man health, such as deoxynivalenol, nivalenol, and fusarenon X,
and whose relative abundance in aerosols furthermore increases
with the severity of FHB in grain. These allergenic and
mycotoxi-genic species were frequently detected not only in the aerosol
sam-ples of the present study in Switzerland (
⬃50% or more samples)
but also in Danish (
9
) and Argentinian (
8
) wheat grain samples.
The consistency of our results with those obtained in these
previ-ous high-throughput sequencing (
9
) and culture-based studies
(
8
) underlines the potential exposure of grain workers to
aller-genic and toxialler-genic fungal particles. Their frequent presence in
FIG 4 Examples of correlations between facets of fungal diversity and major predictors described inTables 2and4. (A) The negative correlation between soil CaCO3and alpha taxonomic diversity. (B) The negative correlation between annual precipitation (mm) and alpha phylogenetic diversity. (C) Differences between the three farming systems in the beta phylogenetic diversity of wheat-related fungi. (D) Positive correlation between the beta phylogenetic diversity and the number of freezing days.aerosols calls for further research on their aggregate effect on the
respiratory health of grain workers.
In conclusion, this study provides the most in-depth
charac-terization to date of airborne fungi associated with a single fungal
source (wheat harvest) along a large geographic gradient. Our
multivariate analyses demonstrated relationships between fungal
assemblages and environmental conditions that were similar to
those classically observed for macroorganisms (
48
,
54
,
55
). Our
results demonstrated that fungal diversity in the aerosols
gener-ated during this activity is quite homogenous in fungal
composi-tion in spite of geographic distance. The taxonomic composicomposi-tion
of airborne fungi is highly correlated with that of fungi in grain
dust. Both allergenic and mycotoxigenic fungal species, which
were previously detected in grain, have been shown in this study to
also be frequent in these aerosols. This is an important finding for
occupational health scientists who seek to understand the etiology
of respiratory diseases described in grain worker populations. In
addition, our results answer ecological questions about the
natu-ral and human factors that drive the composition of aboveground
fungal communities. They elucidated the effects of plant cultivar,
climate, and farming systems on the diversity of the grain dust
fungal community.
ACKNOWLEDGMENTS
We greatly appreciate the support of all of the grain workers who partic-ipated in this study. We also thank the two reviewers for their constructive comments, and we thank Laure Bernardet, Briseis Castella, Baptiste Jime-nez, and Jeremie Projer for assistance in sample collection in the field, Celine Pattaroni for assistance in sample processing in the lab, and Hora-tio Herrera and Pierre-Alain Porchet for advice about air sampling.
This work was supported by the Swiss National Foundation grant PMPDP3-129027, an interdisciplinary grant from the Faculty of Biology and Medicine of the University of Lausanne (Switzerland), and Agence Nationale de Sécurité Sanitaire de l’Alimentation, de l’Environnement et du Travail (ANSES, France) grant 2011/1/087 to H.N.-H.
We declare that we have no conflicts of interest.
H.N.-H., A.O., F.M., and S.K. designed the study; H.N.-H. collected the data; D.S.-B. and G.M. processed the samples in the lab; L.P., A.H.H., and H.N.-H. conducted the analysis; H.N.-H. and L.P. wrote the manu-script, and the other authors contributed.
FUNDING INFORMATION
Faculty of Biology and Medicine of the University of Lausanne (Switzerland) provided funding to Helene Niculita-Hirzel. Agence Na-tionale de Securite Sanitaire de l’Alimentation, de l’Environnement et de Travail, France provided funding to Helene Niculita-Hirzel under grant number 2011/1/087. Schweizerischer Nationalfonds zur Förderung der Wissenschaftlichen Forschung (SNF) provided funding to Helene Nicu-lita-Hirzel under grant number PMPDP3-129027.
REFERENCES
1. Rask-Andersen A. 2011. Asthma increase among farmers: a 12-year fol-low-up. Ups J Med Sci 116:60 –71.http://dx.doi.org/10.3109/03009734 .2010.503287.
2. Pahwa P, Senthilselvan A, McDuffie HH, Dosman JA. 2003. Longitu-dinal decline in lung function measurements among Saskatchewan grain workers. Can Respir J 10:135–141.
3. Jouneau S, Boche A, Brinchault G, Fekete K, Guillot S, Bayat S, Desrues B. 2012. On-site screening of farming-induced chronic obstructive pul-monary disease with the use of an electronic mini-spirometer: results of a pilot study in Brittany, France. Int Arch Occup Environ Health 85:623– 630.http://dx.doi.org/10.1007/s00420-011-0708-6.
4. Moira CYM, Enarson DA, Kennedy SM. 1992. The impact of grain dust on respiratory health. Am Rev Respir Dis 145:476 – 487.http://dx.doi.org /10.1164/ajrccm/145.2_Pt_1.476.
5. Eduard W. 2009. Fungal spores: a critical review of the toxicological and epidemiological evidence as a basis for occupational exposure limit setting. Crit Rev Toxicol 39:799 – 864.http://dx.doi.org/10.3109 /10408440903307333.
6. Selman M, Lacasse Y, Pardo A, Cormier Y. 2010. Hypersensitivity pneumonitis caused by fungi. Proc Am Thorac Soc 7:229 –236.http://dx .doi.org/10.1513/pats.200906-041AL.
7. Denning DW, O’Driscoll BR, Hogaboam CM, Bowyer P, Niven RM. 2006. The link between fungi and severe asthma: a summary of the evi-dence. Eur Respir J 27:615– 626.http://dx.doi.org/10.1183/09031936.06 .00074705.
8. Larran S, Perelló A, Simón M, Moreno V. 2007. The endophytic fungi from wheat (Triticum aestivum L.). World J Microbiol Biotechnol 23:565– 572.http://dx.doi.org/10.1007/s11274-006-9266-6.
9. Nicolaisen M, Justesen AF, Knorr K, Wang J, Pinnschmidt HO. 2014. TABLE 4 Results of the Mantel test correlating fungal taxonomic
(Jaccard) and phylogenetic (MPD) beta diversity and various predictor variables
Diversity measure and factor (unit) Mantel r P valuea
Taxonomic diversity
No. of freezing days/yr 0.23 ***
Wheat cultivar 0.23 *** Cropping history 0.21 *** Summer rainfall (mm) 0.11 * Elevation (m) 0.07 * pH 0.07 0.07 Geographic distance 0.06 0.1 CaCO3(mg kg⫺1) 0.05 0.19 Mg (mg kg⫺1) 0.04 0.19 Pa(mg kg⫺1) 0.03 0.3
Ctot/Ptotratio 0.03 0.3 Ctot/Ntotratio 0.03 0.31 Ntot/Ptotratio 0.03 0.34
Ntot(mg kg⫺1) 0.02 0.4 Corg(%) 0.02 0.38 K (mg kg⫺1) 0.02 0.41 Temp (°C) 0.02 0.31 Annual rainfall (mm) 0.02 0.31 Farming system 0.02 0.44 Ptot(mg kg⫺1) 0.001 0.51 Phylogenetic diversity Farming system 0.17 **
No. of freezing days/yr 0.16 *
Ntot 0.12 0.05
CaCO3(mg kg⫺1) 0.11 0.06 Ctot/Ptotratio 0.11 0.07
Corg(%) 0.11 0.06
Ntot/Ptotratio 0.08 0.1 Annual rainfall (mm) 0.08 0.09 K (mg kg⫺1) 0.06 0.19 Summer rainfall (mm) 0.05 0.15 Elevation (m) 0.04 0.21 Geographic distance 0.04 0.22 Ptot 0.04 0.2 Cropping history 0.04 0.26
Ctot/Ntotratio 0.03 0.24
pH 0.02 0.39 Wheat cultivar 0.01 0.29 Mg (mg kg⫺1) 0.008 0.52 Temp (°C) 0.006 0.49 Pa(mg kg⫺1) 0.001 0.5 a *, P⬍ 0.05; **, P ⬍ 0.01; ***, P ⬍ 0.001.
Fungal communities in wheat grain show significant co-existence patterns among species. Fungal Ecol 11:145–153. http://dx.doi.org/10.1016/j .funeco.2014.06.002.
10. Scherm B, Balmas V, Spanu F, Pani G, Delogu G, Pasquali M, Migheli Q. 2013. Fusarium culmorum: causal agent of foot and root rot and head blight on wheat. Mol Plant Pathol 14:323–341.http://dx.doi.org/10.1111 /mpp.12011.
11. Vacher G, Ciarlo E, Savova-Bianchi D, Le Roy D, Hantier G, Niculita-Hirzel H, Roger T. 2015. Innate immune sensing of Fusarium culmorum by mouse dendritic cells. J Toxicol Environ Health A 78:871– 885.http: //dx.doi.org/10.1080/15287394.2015.1051201.
12. Czaban J, Wroblewska B, Sulek A, Mikos M, Boguszewska E, Podolska G, Nieróbca A. 2015. Colonisation of winter wheat grain by Fusarium spp. and mycotoxin content as dependent on a wheat variety, crop rotation, a crop management system and weather conditions. Food Addit Contam Part A Chem Anal Control Expo Risk Assess 32:874 –910.http://dx.doi .org/10.1080/19440049.2015.1019939.
13. Karlsson I, Friberg H, Steinberg C, Persson P. 2014. Fungicide effects on fungal community composition in the wheat phyllosphere. PLoS One 9:e111786.http://dx.doi.org/10.1371/journal.pone.0111786.
14. Meiser A, Balint M, Schmitt I. 2014. Meta-analysis of deep-sequenced fungal communities indicates limited taxon sharing between studies and the presence of biogeographic patterns. New Phytol 201:623– 635.http: //dx.doi.org/10.1111/nph.12532.
15. Bazzicalupo AL, Bálint M, Schmitt I. 2013. Comparison of ITS1 and ITS2 rDNA in 454 sequencing of hyperdiverse fungal communities. Fun-gal Ecol 6:102–109.http://dx.doi.org/10.1016/j.funeco.2012.09.003. 16. Sapkota R, Knorr K, Jorgensen LN, O’Hanlon KA, Nicolaisen M. 2015.
Host genotype is an important determinant of the cereal phyllosphere mycobiome. New Phytol 207:1134 –1144.http://dx.doi.org/10.1111/nph .13418.
17. Cordier T, Robin C, Capdevielle X, Fabreguettes O, Desprez-Loustau ML, Vacher C. 2012. The composition of phyllosphere fungal assem-blages of European beech (Fagus sylvatica) varies significantly along an elevation gradient. New Phytol 196:510 –519.http://dx.doi.org/10.1111/j .1469-8137.2012.04284.x.
18. Zimmerman NB, Vitousek PM. 2012. Fungal endophyte communities reflect environmental structuring across a Hawaiian landscape. Proc Natl Acad Sci U S A 109:13022–13027.http://dx.doi.org/10.1073/pnas .1209872109.
19. Eschen R, Hunt S, Mykura C, Gange AC, Sutton BC. 2010. The foliar endophytic fungal community composition in Cirsium arvense is affected by mycorrhizal colonization and soil nutrient content. Fungal Biol 114: 991–998.http://dx.doi.org/10.1016/j.funbio.2010.09.009.
20. Penczykowski RM, Walker E, Soubeyrand S, Laine AL. 2015. Linking winter conditions to regional disease dynamics in a wild plant-pathogen metapopulation. New Phytol 205:1142–1152.http://dx.doi.org/10.1111 /nph.13145.
21. Suffert F, Ravigne V, Sache I. 2015. Seasonal changes drive short-term selection for fitness traits in the wheat pathogen Zymoseptoria tritici. Appl Environ Microbiol 81:6367– 6379. http://dx.doi.org/10.1128 /AEM.00529-15.
22. Moulas C, Petsoulas C, Rousidou K, Perruchon C, Karas P, Karpouzas DG. 2013. Effects of systemic pesticides imidacloprid and metalaxyl on the phyllosphere of pepper plants. Biomed Res Int 2013:969750.http://dx.doi .org/10.1155/2013/969750.
23. Burnham KP, Anderson DR. 2002. Model selection and multimodel inference: a practical information-theoretic approach, 2nd ed. Springer, New York, NY.
24. Johnson JB, Omland KS. 2004. Model selection in ecology and evolution. Trends Ecol Evol 19:101–108.http://dx.doi.org/10.1016/j.tree.2003.10 .013.
25. ter Braak CJF. 1986. Canonical correspondence analysis: a new eigenvec-tor technique for multivariate direct gradient analysis. Ecology 67:1167– 1179.http://dx.doi.org/10.2307/1938672.
26. Lepš J, Šmilauer P. 2003. Multivariate analysis of ecological data using CANOCO. Cambridge University Press, Cambridge, United Kingdom. 27. Buttigieg PL, Ramette A. 2014. A guide to statistical analysis in microbial
ecology: a community-focused, living review of multivariate data analyses. FEMS Microbiol Ecol 90:543–550.http://dx.doi.org/10.1111/1574-6941 .12437.
28. Pellissier L, Niculita-Hirzel H, Dubuis A, Pagni M, Guex N, Ndiribe C, Salamin N, Xenarios I, Goudet J, Sanders IR, Guisan A. 2014. Soil
fungal communities of grasslands are environmentally structured at a re-gional scale in the Alps. Mol Ecol 23:4274 – 4290.http://dx.doi.org/10 .1111/mec.12854.
29. Hirzel A, Guisan A. 2002. Which is the optimal sampling strategy for habitat suitability modelling. Ecol Modell 157:331–341.http://dx.doi.org /10.1016/S0304-3800(02)00203-X.
30. Zimmermann NE, Kienast F. 1999. Predictive mapping of alpine grass-lands in Switzerland: species versus community approach. J Veg Sci 10: 469 – 482.http://dx.doi.org/10.2307/3237182.
31. Zimmermann NE, Edwards TC, Moisen GG, Frescino TS, Blackard JA. 2007. Remote sensing-based predictors improve distribution models of rare, early successional and broadleaf tree species in Utah. J Appl Ecol 44:1057–1067.http://dx.doi.org/10.1111/j.1365-2664.2007.01348.x. 32. Saunders WMH, Williams EG. 1955. Observations on the determination
of total organic phosphorus in soils. J Soil Sci 6:254 –267.http://dx.doi.org /10.1111/j.1365-2389.1955.tb00849.x.
33. Williams JDH, Syers JK, Walker TW, Rex RW. 1970. A comparison of methods for the determination of soil organic phosphorus. Soil Sci 110: 13–18.http://dx.doi.org/10.1097/00010694-197007000-00003.
34. Gardes M, Bruns TD. 1993. ITS primers with enhanced specificity for basidiomycetes—application to the identification of mycorrhizae and rusts. Mol Ecol 2:113–118.http://dx.doi.org/10.1111/j.1365-294X.1993 .tb00005.x.
35. White T, Bruns T, Lee S, Taylor J. 1990. Amplification and direct sequencing of fungal ribosomal RNA genes for phylogenetics, p 315–322.
In Innis M, Gelfand D, Sninsky J, White T (ed), PCR protocols: a guide to
methods and applications. Academic Press, New York, NY.
36. Reeder J, Knight R. 2010. Rapidly denoising pyrosequencing amplicon reads by exploiting rank-abundance distributions. Nat Methods 7:668 – 669.http://dx.doi.org/10.1038/nmeth0910-668b.
37. Nilsson RH, Veldre V, Hartmann M, Unterseher M, Amend A, Bergsten J, Kristiansson E, Ryberg M, Jumpponen A, Abarenkov K. 2010. An open source software package for automated extraction of ITS1 and ITS2 from fungal ITS sequences for use in high-throughput community assays and molecular ecology. Fungal Ecol 3:284 –287.http://dx.doi.org/10.1016 /j.funeco.2010.05.002.
38. Edgar RC. 2010. Search and clustering orders of magnitude faster than BLAST. Bioinformatics 26:2460 –2461. http://dx.doi.org/10.1093 /bioinformatics/btq461.
39. Caporaso JG, Kuczynski J, Stombaugh J, Bittinger K, Bushman FD, Costello EK, Fierer N, Pena AG, Goodrich JK, Gordon JI, Huttley GA, Kelley ST, Knights D, Koenig JE, Ley RE, Lozupone CA, McDonald D, Muegge BD, Pirrung M, Reeder J, Sevinsky JR, Turnbaugh PJ, Walters WA, Widmann J, Yatsunenko T, Zaneveld J, Knight R. 2010. QIIME allows analysis of high-throughput community sequencing data. Nat Methods 7:335–336.http://dx.doi.org/10.1038/nmeth.f.303.
40. Pagni M, Niculita-Hirzel H, Pellissier L, Dubuis A, Xenarios I, Guisan A, Sanders IR, Goudet J, Guex N. 2013 Density-based hierarchical clustering of pyro-sequences on a large scale—the case of fungal ITS1. Bioinformatics 29:1268 –1274.http://dx.doi.org/10.1093/bioinformatics /btt149.
41. Chao A, Chazdon RL, Colwell RK, Shen T-J. 2005. A new statistical approach for assessing similarity of species composition with incidence and abundance data. Ecol Lett 8:148 –159.http://dx.doi.org/10.1111/j .1461-0248.2004.00707.x.
42. Colwell RK, Chao A, Gotelli NJ, Lin S-Y, Mao CX, Chazdon RL, Longino JT. 2012. Models and estimators linking individual-based and sample-based rarefaction, extrapolation, and comparison of assemblages. J Plant Ecol 5:3–21.http://dx.doi.org/10.1093/jpe/rtr044.
43. Kembel SW, Cowan PD, Helmus MR, Cornwell WK, Morlon H, Ack-erly DD, Blomberg SP, Webb CO. 2010. Picante: R tools for integrating phylogenies and ecology. Bioinformatics 26:1463–1464.http://dx.doi.org /10.1093/bioinformatics/btq166.
44. Hibbett DS, Binder M, Bischoff JF, Blackwell M, Cannon PF, Eriksson OE, Huhndorf S, James T, Kirk PM, Lücking R, Thorsten Lumbsch H, Lutzoni F, Matheny PB, McLaughlin DJ, Powell MJ, Redhead S, Schoch CL, Spatafora JW, Stalpers JA, Vilgalys R, Aime MC, Aptroot A, Bauer R, Begerow D, Benny GL, Castlebury LA, Crous PW, Dai YC, Gams W, Geiser DM, Griffith GW, Gueidan C, Hawksworth DL, Hestmark G, Hosaka K, Humber RA, Hyde KD, Ironside JE, Kõljalg U, Kurtzman CP, Larsson KH, Lichtwardt R, Longcore J, Miadlikowska J, Miller A, Moncalvo JM, Mozley-Standridge S, Oberwinkler F, Parmasto E, et al.
2007. A higher-level phylogenetic classification of the fungi. Mycol Res 111:509 –547.http://dx.doi.org/10.1016/j.mycres.2007.03.004.
45. Burnham KP, Anderson DR. 2004. Multimodel inference: understanding AIC and BIC in model selection. Sociol Methods Res 33:261–304.http: //dx.doi.org/10.1177/0049124104268644.
46. Oksanen J, Kindt R, Legendre P, O’Hara B, Stevens MHH, Oksanen MJ. 2007. Vegan: community ecology package, version 1.15-1.http://vegan.r -forge.r-project.org/.
47. Swenson NG. 2012. Phylogenetic analyses of ecological communities us-ing DNA barcode data. Methods Mol Biol 858:409 – 419.http://dx.doi.org /10.1007/978-1-61779-591-6_20.
48. Pellissier L, Ndiribe C, Dubuis A, Pradervand JN, Salamin N, Guisan A, Rasmann S. 2013. Turnover of plant lineages shapes herbivore phyloge-netic beta diversity along ecological gradients. Ecol Lett 16:600 – 608.http: //dx.doi.org/10.1111/ele.12083.
49. Dray S, Dufour AB. 2007. The ade4 package: implementing the duality diagram for ecologists. J Stat Softw 22:1–20.
50. Cavender-Bares J, Kozak KH, Fine PV, Kembel SW. 2009. The merging of community ecology and phylogenetic biology. Ecol Lett 12:693–715.
http://dx.doi.org/10.1111/j.1461-0248.2009.01314.x.
51. Bernhoft A, Torp M, Clasen PE, Loes AK, Kristoffersen AB. 2012.
Influence of agronomic and climatic factors on Fusarium infestation and mycotoxin contamination of cereals in Norway. Food Addit Contam Part A Chem Anal Control Expo Risk Assess 29:1129 –1140.http://dx.doi.org /10.1080/19440049.2012.672476.
52. Vogelgsang S, Hecker A, Musa T, Dorn B, Forrer H-R. 2011. On-farm experiments over 5 years in a grain maize/winter wheat rotation: effect of maize residue treatments on Fusarium graminearum infection and de-oxynivalenol contamination in wheat. Mycotoxin Res 27:81–96.http://dx .doi.org/10.1007/s12550-010-0079-y.
53. Sharma-Poudyal D, Chen X, Rupp RA. 2014. Potential oversummering and overwintering regions for the wheat stripe rust pathogen in the con-tiguous United States. Int J Biometeorol 58:987–997.http://dx.doi.org/10 .1007/s00484-013-0683-6.
54. Klimek S, Hofmann M, Isselstein J. 2007. Plant species richness and composition in managed grasslands: the relative importance of field man-agement and environmental factors. Biol Conserv 134:559 –570.http://dx .doi.org/10.1016/j.biocon.2006.09.007.
55. Schaffers AP, Raemakers IP, Sýkora KV, Ter Braak CJ. 2008. Arthropod assemblages are best predicted by plant species composition. Ecology 89: 782–794.http://dx.doi.org/10.1890/07-0361.1.