WORKING
PAPERS
SES
N. 456
VI.2015
Direct and indirect effects
of training vouchers for the
unemployed
Martin Huber,
Michael Lechner
and
Direct and indirect effects
of training vouchers for the unemployed
Martin Huber+, Michael Lechnerx, and Anthony Strittmatterx*
+
University of Fribourg, xUniversity of St. Gallen, SEW
Abstract: This paper evaluates the effect of a voucher award system for assignment into vocational training on the employment outcomes of unemployed voucher recipients in Germany, along with the causal mechanisms through which it operates. It assesses the direct effect of voucher assignment net of actual redemption, which may be driven by preference shaping/learning about (possibilities of) human capital investments or simply by costs of information gathering. Using a mediation analysis framework based on sequential conditional independence assumptions and semiparametric match-ing estimators, our results suggest that the negative short term and positive long term employment effects of voucher award are mainly driven by actual training participation. However, also the direct effect of just obtaining the voucher is negative in the short run. This points to potential efficiency losses of voucher award systems if individuals decide not to redeem, as employment chances are lower than under award in the short run and under redemption in the long run, making non-redemption the least attractive option.
Keywords: Mediation analysis, voucher award, training programmes, direct effects, indirect effects, causal
mechanisms, causal channels, matching estimation
JEL classification: J64, J68, C21, C31.
Addresses for correspondence: Martin Huber ([email protected], unifr.ch/appecon/en), Department of Economics, University of Fribourg, Bd. de Pérolles 90, CH-1700 Fribourg; Michael Lechner ([email protected], www.michael-lechner.eu), Anthony Strittmatter ([email protected]), Swiss Institute for Empirical Economic Research (SEW), University of St. Gallen, Varnbüelstrasse 14, CH-9000 St. Gallen.
*
Michael Lechner is also affiliated with CEPR and PSI, London, CESIfo, Munich, IAB, Nuremberg, and IZA, Bonn. Anthony Strittmatter is also affiliated with the Albert-Ludwigs-University Freiburg. We benefitted from comments by Annabelle Doerr, Bernd Fitzenberger, Thomas Kruppe, and Gesine Stephan. Financial support from the Swiss National Science Foundation, grant number SNF 100018_137769 for the project “Identifying causal mechanisms in empirical economics” is gratefully acknowledged. This study is also part of the project “Regional Allocation Intensities, Effectiveness and Reform Effects of Training Vouchers in Active Labor Market Policies”, IAB project number 1155. We gratefully acknowledge data support from the IAB. Anthony Strittmatter acknowledges financial support from the IAB. The usual disclaimer applies.
1 Introduction
In January 2003, the Federal Employment Agency in Germany reformed the allocation
of vocational training programmes, which are a corner stone of German active labour market
policies (ALMPs). An assignment system based on vouchers replaced the direct assignment of
unemployed individuals to vocational training by caseworkers. The aim of the reform was to
increase the involvement of training participants in the training decision as well as to increase
the competition among training providers. In contrast to the pre-reform rules, under which
essentially the caseworker decided about the placement into vocational training, voucher
re-cipients may now choose both the training provider as well as the course (subject to some
restrictions concerning the course objective, content, and duration).
Based on rich administrative data, this paper investigates the effect of voucher award on
re-employment and other labour market outcomes focussing on the distinct causal
mecha-nisms through which this effect may operate. Specifically, we analyse whether in addition to the voucher’s impact through its redemption (i.e. participation in vocational training) there exists a direct effect of mere voucher award (i.e. without participation). The latter may be
driven by motivational effects, preference shaping, and awareness building w.r.t. (the
availa-bility of) ALMPs, that could affect labour market behaviour in one or the other direction. For
instance, the award of a voucher could increase the awareness of and the preference for
possi-bilities to build up human capital and therefore immediately reduce job search intensity. The
same effect occurs if the award of the voucher leads to high information costs when looking
for an appropriate provider and course. On the other hand, if ALMPs are perceived to be a
burden, a threat, or unlikely to be effective, and if voucher award increases the awareness of
potential obligations to participate in future (unattractive) ALMPs, then an immediate
in-crease in job search intensity may be expected. It therefore appears to be an interesting and
a ‘direct’ effect, whose direction is a priori ambiguous, exists, too. In particular, this allows
judging whether it is the quality of the training providers that (through voucher redemption)
drive the voucher effect or whether other effects (through preference shaping, awareness
building, costs of information gathering, etc.) are important as well.
We use a formal mediation framework (see for instance the seminal paper by Baron and
Kenny, 1986) to identify the causal mechanisms of interest and to this end consider
redemp-tion of the voucher as a so-called mediator, i.e. an intermediate outcome on the causal path of
voucher award to the individual labour market outcomes. Besides the impact of voucher
re-demption, we are particularly interested in the so-called controlled direct effect (see for
in-stance Pearl, 2001), i.e. the employment effect of voucher award in the absence of actual
re-demption.1 Causal mechanisms are, however, not easily identified. Even if the vouchers were
randomly assigned, this would not imply randomness of the mediator (see Robins and
Green-land, 1992).
To tackle the endogeneity of voucher award and redemption, a particular conditional
dependence assumption is invoked for identification. It requires (i) that voucher award is
in-dependent of potential employment outcomes (under (non-)award and (non-)redemption of
the vouchers) conditional on observed covariates and (ii) that voucher redemption is
inde-pendent of the potential outcomes conditional on the covariates and voucher award. These
conditional independence assumptions are related to those invoked in the nonparametric
me-diation literature for identifying controlled direct effects (see for instance Petersen, Sinisi, and
van der Laan, 2006, and VanderWeele, 2009), in the dynamic treatment effect literature for
assessing sequences of treatments (see for instance Robins, 1986, 1989, Robins, Hernan, and
Brumback, 2000, Lechner, 2009, and Lechner and Miquel, 2010) and in the multiple
treat-ment effect framework (see Imbens, 2000, and Lechner, 2001). For estimation, we use
1
parametric radius matching with bias adjustment (Lechner, Miquel, and Wunsch, 2011) on the
propensity score of (joint) voucher award and redemption given the covariates.
The results suggest that among voucher recipients, voucher award has a negative
aver-age (total) employment effect in the first three years after voucher receipt and a small positive
one thereafter, with an increased employment probability of roughly 2 to 3 percentage points
in each month four years after receiving the voucher. This implies that the initially negative
lock-in effect of the voucher award system (likely due to decreased job search) is
compen-sated by higher placement probabilities in later periods. Concerning the causal mechanisms,
voucher redemption (and thus, actual participation in or at least starting a vocational training)
has similar negative short term and positive long term effects (again, on the population of
voucher recipients) as voucher award, being slightly more pronounced respectively. It is
therefore voucher redemption which primarily drives the total effect on voucher recipients.
In contrast, the direct effect on voucher recipients, assessed as difference in mean
po-tential outcomes between voucher award and non-redemption vs. non-award (and
non-re-demption), is insignificant in most of the fourth year. This suggests that in the long run, mere
voucher receipt does not affect employment success (e.g. through a change in preferences).
There nevertheless occurs a negative direct effect over the first three years, suggesting that
voucher award decreases job search intensity even despite non-redemption. This points to
po-tential efficiency losses of voucher award systems if individuals decide not to redeem the
vouchers, as employment chances are lower than under non-award in the short run and under
redemption in the long run. Therefore, voucher award together with non-redemption appears
to be the least attractive option, which needs to be taken into account when designing such a
voucher award system.
The main contribution of this study is that it assesses various causal mechanisms of a
programme, which to the best of our knowledge has not been done before. Our research focus
is therefore different to Doerr, Fitzenberger, Kruppe, Paul, and Strittmatter (2014) and
Hein-rich, Mueser, Troske, Jeon, and Kahvecioglu (2010), who evaluate the effectiveness of
vari-ous vocational training programmes under voucher systems, but do not consider the direct
effect of voucher award. It also differs from Doerr and Strittmatter (2014) and Rinne,
Uhlen-dorff, and Zhao (2013), who compare the effectiveness of vocational training under a voucher
and a direct assignment regime, but do not separate award and redemption effects either. Our
paper is one of the few (but growing number of) empirical economic studies aiming at
disen-tangling direct and indirect effects of policy interventions (see Flores and Flores-Lagunes,
2009, Heckman, Pinto, and Savelyev, 2013, and Huber, Lechner, and Mellace, 2014, for
fur-ther examples).
The remainder of this paper is organized as follows. Section 2 outlines the institutional
background of the award of vouchers for ALMP in Germany. Section 3 presents the
econo-metric framework, namely the definition of the effects of interest, the identifying assumptions,
and a brief description of the propensity score matching estimator. Section 4 introduces the
data. In Section 5, we provide descriptive statistics and discuss the plausibility of the
identi-fying assumptions in the light of the data. Section 6 presents the estimation results. Section 7
concludes. Three appendices provide further details on the data, on the estimation, and on the
results obtained.
2 Institutional background of voucher provision
Vocational training programmes constitute a corner stone of ALMPs in Germany. Their
main objective is to adjust the skills of unemployment individuals to changing labour market
requirements and/or changed individual conditions (for instance health issues). Vocational
training primarily consists of three categories: classical vocational training, training in
class-rooms or on the job. Examples are courses in IT-based accounting or customer orientation and
sales. Training in practice firms aims at simulating a (real) work environment. Retraining
leading to a degree (also called degree courses) has a longer duration of up to three years with
the goal to accomplish a (new) vocational degree within the German apprenticeship system. It
covers, for example, the full curriculum of a vocational training for an elderly care nurse.
Between 2000 and 2002, average annual expenditures for vocational training exceeded seven
billion Euros (source: Labour Market Reports, Federal Employment Agency of Germany).
In January 2003, a voucher-based allocation system for the provision of vocational
training was introduced. It aims at promoting the responsibility of training participants as well
as market mechanisms among training providers. Potential training participants receive a
vo-cational training voucher, which permits choosing the training provider and course. As
ex-plained in Doerr and Strittmatter (2014), several rules apply. First, the voucher specifies the
objective, content, and maximum duration of the course. Second, it can only be redeemed
within a one-day commuting zone. Third, the validity of training vouchers varies between one
week and three months. Fourth, no sanctions (e.g. cuts in unemployment benefits) are
im-posed in case of non-redemption.
3 Econometric framework
3.1 Potential outcomes and causal effects
Let D denote a binary indicator for voucher award, the so-called treatment variable, and
Y the labour market outcome of interest, e.g. employment. Furthermore, let M be a binary indicator for voucher redemption (which implies participation in vocational training). This is
the major mediator through which the indirect effect of D on Y operates. To define the effects
de-note by Y the potential outcome as a function of voucher award d d{1, 0}.2
The (total)
aver-age treatment effect on the treated (ATET) of voucher award is therefore given by
1 0
( | 1)
E Y Y D
. Secondly, for investigating distinct causal mechanisms, we denote by ,
d m
Y the potential outcome as a function of both voucher award and redemption, d m, {1,0}. Note that the two types of denoting potential outcomes are linked, namely: Yd Yd M, d, where
d
M is the potential redemption state under voucher award Dd. Therefore, the ATET may be expressed as: 1 0 1, 0, ( M M | 1) E Y Y D . (1)
In our application, M0 0 for everyone, because vouchers cannot be redeemed if not as-signed, so that E Y( 1,M1Y0,0|D1). In contrast, M might be either 1 or 0, depending on 1 whether an individual decides to redeem a received voucher or not. The ATET therefore pro-vides the “reduced form” effect of award (not actual redemption), which may operate through redemption (given that M changes with the value of d for at least some or all individuals) or d
also bear a direct component.
The extended notation allows us to define further parameters of interest, namely the
av-erage effect of voucher award and redemption vs. no award and no redemption, again among
voucher recipients:
1,1 0,0
( | 1)
E Y Y D
. (2)
The difference to the ATET () is that here, the redemption is prescribed to correspond to voucher award. Note that only in the special case of perfect compliance, i.e. everyone’s
re-demption decision corresponds to the voucher award (i.e. Md d for d{1, 0}), is equal
2
By defining the potential outcomes this way, we implicitly impose the Stable Unit Treatment Value Assumption (SUTVA), see Rubin (1980).
to . Again, part or all of the impact may be due to redemption or to a direct effect of award. In a next step we disentangle the latter two components and first consider the so-called
con-trolled direct effect, see for instance Pearl (2001):3
1,0 0,0
( | 1)
E Y Y D
. (3)
This is the impact of training voucher award among voucher recipients net of actual
redemp-tion, i.e. under prescribed non-redemption for everyone. Finally, the effect of redemption is
identified by
1,1 1,0
( | 1)
E Y Y D
. (4)
Here, the effect of redemption vs. non-redemption is investigated when a voucher was
awarded. Note that
and sum up to , which can be seen from adding and subtracting 1,0Y in the expectation of expression (2).
3.2 Identifying assumptions
To identify the effects of interest, we impose (sequential) conditional independence of
the potential outcomes on the one hand and voucher award and redemption on the other hand
(Assumptions 1 and 2 below). This requires that we observe all factors that are jointly related
(i) with D and the potential outcome under non-treatment and (ii) with M and the potential
outcome under non-treatment. We henceforth denote the vector of observed covariates by X.
Furthermore, a particular common support restriction is also needed (Assumption 3 below)
which implies that suitable comparisons in terms of observed covariates exist across various
combinations of D and M.
3
A related parameter is the so-called natural direct effect in the nomenclature of Pearl (2001) or the pure/total direct effect in the nomenclature of Robins and Greenland (1992) and Robins (2003), which is defined upon potential mediator states rather than prescribed mediator values: 1, 1 0, 1
( M M | 1)
E Y Y D , 1, 0 0, 0
( M M | 1)
E Y Y D . The latter two parameters and are equivalent only in the special case that there are no interaction effects between D and M on the outcome Y. Identification and estimation of natural direct effects has been considered in Pearl (2001), Robins (2003), Flores and Flores-Lagunes (2009), Imai, Keele, and Yamamoto (2010), and Huber (2014), among many others.
Assumption 1: {Y1,1,Y1,0,Y0,0} D X| x for all x in the support of X.
Assumption 1 states that the potential outcomes are jointly independent of voucher award
conditional on X. This assumption rules out unobserved confounders affecting award and the
potential outcomes after controlling for the covariates. Together with the first part of
As-sumption 3, it is sufficient for identifying the ATET. In contrast, the identification of ,
, and requires a further conditional independence assumption.Assumption 2: {Y1,1,Y1,0,Y0,0} M X| x D, d for d{1, 0} and all x in the support of X.
If Assumption 2 holds, redemption is independent of the potential outcomes conditional on
the covariates and voucher award. Assumptions 1 and 2 are closely related to conditions (4)
and (5) in Petersen, Sinisi, and van der Laan (2006) for the identification of the controlled
direct effect. They are also related to conditions (1) and (2) in VanderWeele (2009), again for
identifying the controlled direct effect, and conditions (a) and (b) of the Weak Dynamic
Con-ditional Independence Assumption in Lechner (2009) and Lechner and Miquel (2010) for the
evaluation of dynamic treatments. The difference to the latter papers is, however, that they
allow for different sets of covariates to control for confounding of D and M (where the
co-variates for M may be affected by D), whereas we (similarly to Petersen, Sinisi, and van der
Laan, 2006) assume the same X for D and M. Further below, we argue that this appears
rea-sonable in our application.
Assumption 3: Pr(D1|X x) 1 and 0Pr(M 1|D1,X x) 1 for all x in the
sup-port of X.
The first part of Assumption 3 requires that no combination of covariates perfectly predicts
voucher award, otherwise no comparable observations (in terms of conditioning variables X)
without award (and thus, without redemption) exist, implying that , and
(which in-volve Y0,0) cannot be identified. The second part requires that conditional on voucher award,no combination of covariates perfectly predicts redemption or non-redemption, otherwise (which involves both Y and 1,1 Y1,0) cannot be identified.
Note that Assumptions 1 and 2 together imply the following conditional independence
restriction: {Y1,1,Y1,0,Y0,0} { ,D M} |X x for all x in the support of X. This means that technically, the various combinations of D and M may (despite their sequentiality) be treated
as distinct treatments in the identification of ,
, and based on conditioning on X. We can therefore analyse the effects of the various combinations(D1,M 1), (D1,M 0), and (D0,M 0) in a standard multiple treatment effect framework (for assessing a treat-ment that can take more than two value), as outlined in Imbens (2000) and Lechner (2001). Itfollows that 1 0 1, 1 0, 0,0 0 , ( | 1) ( | 1) ( | 1), ( | 1) ( | 1) ( | 1) [ ( | 0, ) | 1], ( | 1) [ ( | , , ) | 1], M M d m E Y D E Y D E Y D E Y D E Y D E Y D E E Y D X x D E Y D E E Y D d M m X x D where the second and third lines are implied by Assumption 1 and Assumptions 1 and 2,
re-spectively.4
However, directly controlling for the possibly high dimensional vector X when
estimat-ing E E Y D[ ( | 0,X x) |D1] and E E Y D[ ( | d M, m X, x) |D1] may be prone to the curse of dimensionality problem in nonparametric estimation. Rosenbaum and Rubin
(1983) show that one may instead condition on the treatment propensity scores, in our case
( ) Pr( 1| )
p x D X x and pdm( )x Pr(Dd M, m X| x), respectively, which
bal-ance the distributions of X. Therefore, it also holds that
0 0, , ( | 1) { [ | 0, ( )] | 1}, ( | 1) { [ | , , ( )] | 1}. M d m dm E Y D E E Y D p x D E Y D E E Y D d M m p x D 4
This has the practical advantage that the vector of covariates is reduced to a single variable
and, thus, circumvents the curse of dimensionality, at least if the propensity scores are well
approximated by parametric probability models. The effects of interest may then be estimated
by propensity score matching on estimates of p x and ( ) pdm( )x , respectively.
3.3 Estimators
Estimation of the various effects of interest (see Section 3.1) is based on radius
match-ing on the propensity score with bias adjustment. Estimation is semi-parametric in the sense
that the propensity scores
p x
x( )
andp
dm( )
x
are parametrically specified by probit models,while the models for the conditional expectations of the outcomes are unrestricted. Therefore,
propensity score matching flexibly allows for effect heterogeneity in X and is more robust in
terms of model specification than fully parametric methods.
To be concise, we use the matching algorithm of Lechner, Miquel, and Wunsch (2011),
which is more precise than standard nearest-neighbour matching because it incorporates the
idea of radius matching (e.g. Dehejia and Wahba, 2002). Furthermore, the procedure uses the
initial matching weights for a (weighted) regression adjustment for bias reduction in a second
step (see Abadie and Imbens, 2011). Therefore, the estimator satisfies a so-called double
ro-bustness property, meaning that it is consistent if either the matching step is based on a
cor-rectly specified selection model or the regression model is corcor-rectly specified (e.g., Rubin,
1979; Joffe et al., 2004). Moreover, the regression adjustment should reduce small sample as
well as asymptotic biases of matching. Huber, Lechner, and Wunsch (2013) investigate the
finite sample properties of this radius matching with bias adjustment algorithm along with
many other matching type estimators and find it to be very competitive.
We match on the linear index of the probit specification of the propensity score and use
a data-driven approach for the choice of the radius size. That is, we set the latter to 90% of the
standard nearest-neighbour matching.5 Other choices of the radius size did not affect the
re-sults importantly. Concerning inference, Abadie and Imbens (2008) show that
bootstrap-based standard errors may be invalid for matching bootstrap-based on a fixed number of comparison
observations. However, our matching algorithm is smoother than the latter approach because
it (by the nature of radius matching) uses a variable number of comparisons that furthermore
are distance-weighted within the radius and on top applies the regression adjustment. The
bootstrap is therefore likely a valid inference procedure in our context. To be precise,
infer-ence is based on bootstrapping the respective effect 999 times and using the standard
devia-tion of the bootstrapped effects as an estimate of the standard error in the t-statistic.
4 Empirical implementation
This section describes the data and the selection of our estimation sample.
4.1 Data
Our analysis is based on administrative data provided by the Federal Employment
Agency of Germany, namely the Integrated Employment Biographies (IEB).6 The latter
con-tain information on all individuals in Germany who received a voucher between 2003 and
2004, along with subsequent participation in vocational training programmes. That is, the
pre-cise award and redemption dates for each voucher as well as the start and end dates of
voca-tional trainings are observed. Furthermore, the data include detailed daily information on
em-ployment subject to social security contributions, the receipt of transfer payments during
5
If there is no comparison observation within the radius, then the nearest neighbour is matched.
6
The IEB is a rich administrative database and the source of the sub-samples of data used in all recent studies that evaluate German ALMP programmes (e.g., Biewen, Fitzenberger, Osikominu, and Paul, 2014, Lechner, Miquel, and Wunsch, 2011, Lechner and Wunsch, 2013, Rinne, Uhlendorff, and Zhao, 2013). The IEB is a merged data file containing individual records collected in four different administrative processes: The IAB Employment History (Beschäftigten-Historik), the IAB Benefit Recipient History (Leistungsempfänger-(Beschäftigten-Historik), the Data on Job Search originating from the Applicants Pool Database (Bewerberangebot), and the Participants-in-Measures Data (Massnahme-Teilnehmer-Gesamtdatenbank). IAB (Institut für Arbeitsmarkt- und Berufsforschung) is the abbreviation for the research department of the German Federal Employment Agency.
employment, job search, and participation in various active labour market programmes (type,
duration), rich individual information (among others education, age, gender, marital status,
profession, and nationality), and regional (labour market) characteristics. Thus, we are able to
control for a wealth of personal characteristics and detailed labour market histories (e.g., type
of employment, industry, occupational status, earnings) for all individuals receiving a voucher
and thus capture the key confounders in such settings as identified by Lechner and Wunsch
(2013). Furthermore, we also make use of a control sample of unemployed individuals
with-out voucher award (and redemption) during the years 2003 and 2004. It also originates from
the IEB and is constructed as a three per cent random sample of individuals who experience at
least one transition from employment to non-employment (of at least one month) in 2003.7
4.2 Sample definition
The evaluation sample is constructed as an inflow sample into unemployment. It
con-sists of individuals who became unemployed in 2003 after having been continuously
em-ployed for at least three months and were awarded a voucher before 2005. Entering unployment is defined as the transition from (non-subsidised, non-marginal, non-seasonal) em-ployment to registered non-emem-ployment of at least one month. We focus on individuals who are eligible for unemployment benefits at the time of inflow into unemployment. Thus, this sample focuses on the main target groups of these programmes. To exclude individuals eligi-ble for specific labour market programmes targeting youths and individuals eligieligi-ble for early retirement schemes, we only consider persons aged between 25 and 54 years at the beginning
of their unemployment spell under consideration.
The treatment is defined as the first voucher award in the years 2003 and 2004, the
me-diator as voucher redemption for participation in some vocational training course.
7 We account for the different sampling probabilities whenever necessary by using sampling weights. Note that these
probabilities differ for unemployed obtaining a voucher versus not obtaining a voucher, while they are identical within each of the two groups.
tion needs to take place within 3 months after award, otherwise the voucher expires. One
con-cern regarding the treatment and mediator definitions is the timing with respect to the elapsed
unemployment duration prior to award and redemption. Frederiksson and Johansson (2008)
argue that in countries such as Germany, nearly all unemployed persons would receive ALMPs if their unemployment spells were sufficiently long. Individuals who find jobs quickly are less likely to be assigned to and receive training, because the treatment definition is
re-stricted to unemployment periods. Accordingly, ignorance of the elapsed unemployment
du-ration at treatment start could lead to a higher share of individuals with better labour market
characteristics among non-treated than among treated. To address this problem, we randomly
assign pseudo treatment start dates to each individual in the control group. Thereby, we
re-cover the distribution of the elapsed unemployment duration at voucher award from the
treat-ment group (similar to, e.g., Lechner and Smith, 2007). For comparability of the treattreat-ment definitions of the treated and non-treated groups, we only consider individuals who are unem-ployed at their (pseudo) voucher award. Following similar arguments, the same approach is
applied to the (pseudo) voucher redemption time.8 This makes to groups of individuals with
redeemed and expired vouchers comparable with respect to their duration of unemployment.
4.3 Descriptive statistics
The baseline sample includes 93,016 (or 600,842 weighted) observations.9 41,138
observations are awarded a voucher in 2003 or 2004, whereas 51,878 are not. Of the former
8
592 individuals with expired vouchers are dropped because of the definition of the pseudo voucher redemption time.
9
The IAB provided a data set that contains 230,842 (or 3,638,851 weighted) observations. This sample is representative for the inflow of unemployed in the years 2003 and 2004 subject to the following sample restrictions: previous employment of at least 3 months, some contact with the employment agency within the first three months of unemployment, unemployment durations of at least one month, eligible for unemployment benefits, and aged between 25 and 54 years. We do not consider treatments after 2004, because in January 2005 a large labour market reform took place in Germany (Hartz IV reform). Thus, we restrict our sample to individuals who become unemployed in the year 2003. This enables us to consider for all unemployed a potential treatment within the first twelve months of their unemployment spell. Further, we drop individuals with marginal, seasonal, or subsidised employment before their last unemployment spell. This leaves 124,696 observations. Another 31,680 observations are dropped because of the definition of the pseudo voucher award and redemption times. See the descriptive means of the initial and final sample in Table A.2 in Appendix A.
group, 33,077 individuals redeem their voucher, whereas 8,061 do not redeem it. Table 4.1
reports the means of selected observed characteristics across groups defined in terms of
treat-ment and mediator states (see Table A.1 for a more extensive set of variables): voucher
awarded, no voucher awarded, voucher redeemed, voucher expired (note that the last two
groups are subsamples of the first group). Pairwise standardized mean differences (see
Ros-enbaum and Rubin, 1985) are also shown as measures of covariate balance. Information on
individual characteristics refers to the time of inflow into unemployment. Only for the elapsed
unemployment duration and the remaining eligibility for unemployment benefits, we consider
the measurement at the time of the (pseudo) voucher award.
The descriptive statistics in Table 4.1 reveal that voucher recipients (1) and
non-recipi-ents (2) differ importantly in several socio-economic characteristics such as age, health,
edu-cation, and profession. In particular, those awarded a voucher are younger, healthier, better
educated, and have higher paying jobs. However, elapsed time in unemployment duration is
higher for recipients and accordingly the remaining eligibility for unemployment benefits is
lower. Regional differences appear to be limited. The regional differences are also more
pronounced.
When comparing the samples of unemployed with redeemed (3) to those with expired
vouchers (4), differences in socio-economic variables are often small, with the important
ex-ception that the latter group more likely suffers from incapacities (and health problems in
general), which may to an important extent drive non-redemption. Furthermore, while the
employment histories are quite comparable, non-redeemers have higher elapsed
unemploy-ment durations and thus a lower eligibility to unemployunemploy-ment benefits at voucher award than
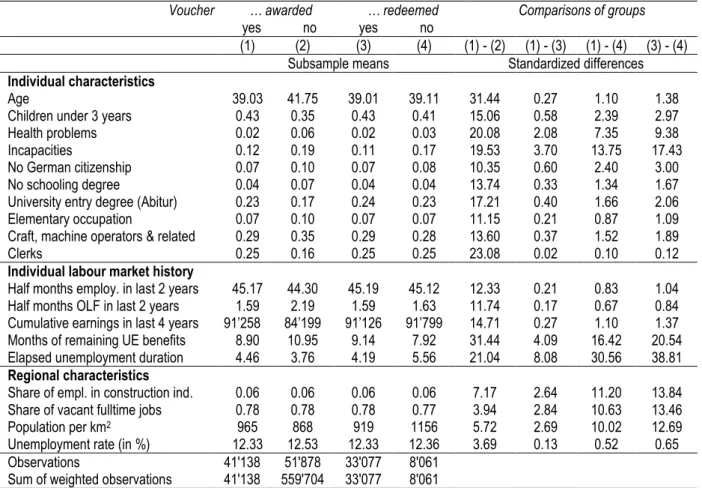
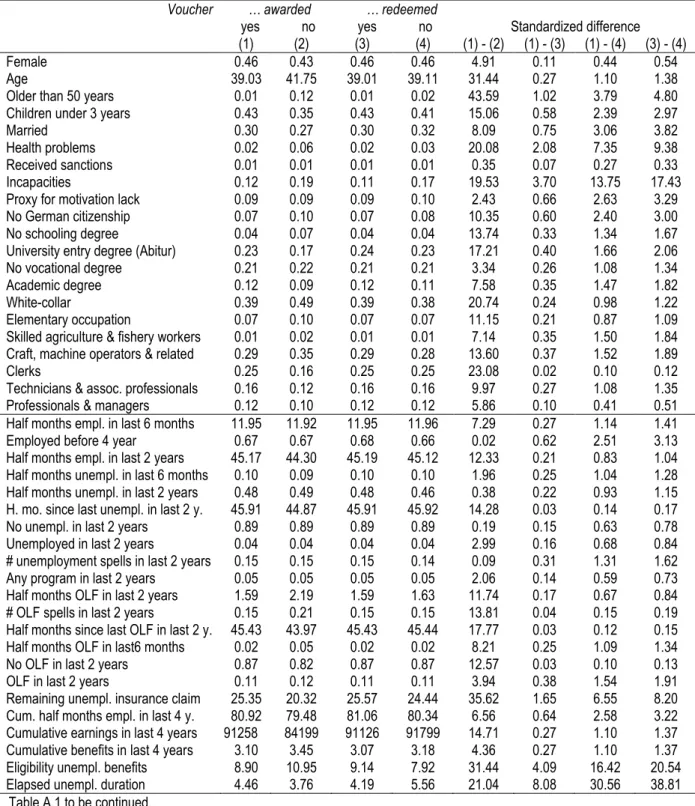
Table 4.1: Means and standardized biases of selected variables
Voucher … awarded … redeemed Comparisons of groups
yes no yes no
(1) (2) (3) (4) (1) - (2) (1) - (3) (1) - (4) (3) - (4) Subsample means Standardized differences
Individual characteristics
Age 39.03 41.75 39.01 39.11 31.44 0.27 1.10 1.38 Children under 3 years 0.43 0.35 0.43 0.41 15.06 0.58 2.39 2.97 Health problems 0.02 0.06 0.02 0.03 20.08 2.08 7.35 9.38 Incapacities 0.12 0.19 0.11 0.17 19.53 3.70 13.75 17.43 No German citizenship 0.07 0.10 0.07 0.08 10.35 0.60 2.40 3.00 No schooling degree 0.04 0.07 0.04 0.04 13.74 0.33 1.34 1.67 University entry degree (Abitur) 0.23 0.17 0.24 0.23 17.21 0.40 1.66 2.06 Elementary occupation 0.07 0.10 0.07 0.07 11.15 0.21 0.87 1.09 Craft, machine operators & related 0.29 0.35 0.29 0.28 13.60 0.37 1.52 1.89 Clerks 0.25 0.16 0.25 0.25 23.08 0.02 0.10 0.12
Individual labour market history
Half months employ. in last 2 years 45.17 44.30 45.19 45.12 12.33 0.21 0.83 1.04 Half months OLF in last 2 years 1.59 2.19 1.59 1.63 11.74 0.17 0.67 0.84 Cumulative earnings in last 4 years 91’258 84’199 91’126 91’799 14.71 0.27 1.10 1.37 Months of remaining UE benefits 8.90 10.95 9.14 7.92 31.44 4.09 16.42 20.54 Elapsed unemployment duration 4.46 3.76 4.19 5.56 21.04 8.08 30.56 38.81
Regional characteristics
Share of empl. in construction ind. 0.06 0.06 0.06 0.06 7.17 2.64 11.20 13.84 Share of vacant fulltime jobs 0.78 0.78 0.78 0.77 3.94 2.84 10.63 13.46 Population per km2 965 868 919 1156 5.72 2.69 10.02 12.69
Unemployment rate (in %) 12.33 12.53 12.33 12.36 3.69 0.13 0.52 0.65 Observations 41'138 51'878 33'077 8'061
Sum of weighted observations 41'138 559'704 33'077 8'061
Note: See Rosenbaum and Rubin (1985) for a definition of the standardized difference. They consider an absolute standardized difference of more than 20 as being “large”. The full set of results is contained in Table A.1 in Appendix A.
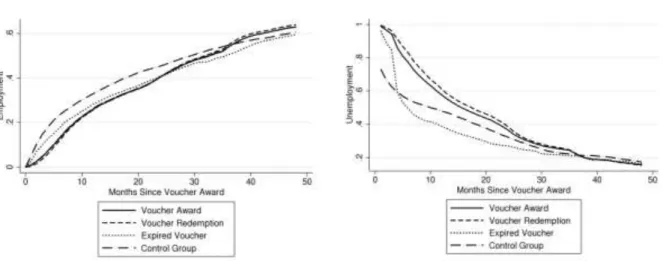
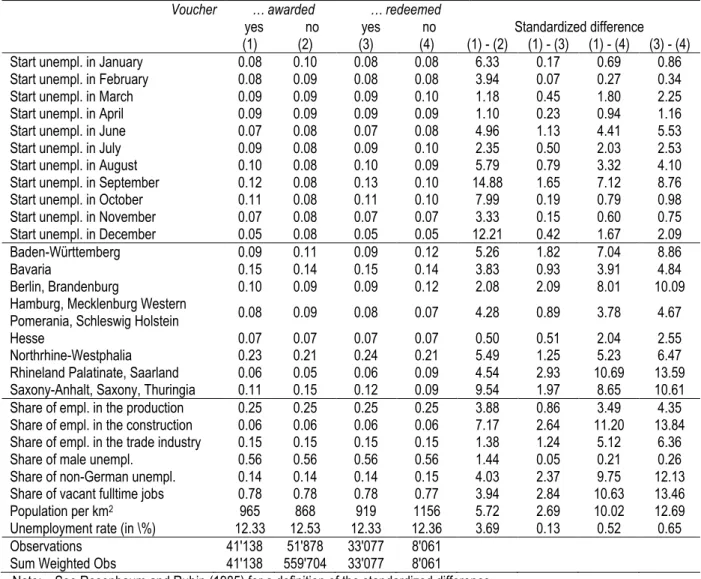
Figures 4.1 and 4.2 show the evolvement of two key outcome variables over time,
namely employment and registered unemployment (further outcome variable are presented in
Appendix A). Not surprisingly, over a horizon of 4 years (48 months) after voucher award,
employment rates reach about 60% and registered unemployed falls below 20% for all
groups.
Comparing the development within the different groups, there is an obvious difference
depending on the time horizon. In the short-run, the groups participating at least partly in a
training programme appear to experience so-called lock-in effects, i.e. they take up fewer jobs
than the two other groups. In the longer run, this effect disappear and the groups subject to the
programmes experience higher employment rates (and similar unemployment rates) than the
differences can be attributed to the effects of the treatment (obtaining a voucher) and the
mediator (redeeming it).
Figure 4.1: Mean employment Figure 4.2: Mean unemployment
Note: Group means adjusted to the population of individuals awarded with a voucher.
5 The selection processes
5.1 Variables
Our identification strategy requires observing all variables that jointly affect (i.e.
con-found) voucher award and the outcome and/or voucher redemption and the outcome in a
rele-vant way. It is therefore essential to understand which factors affect both voucher award and
redemption.
Concerning voucher award, the analyses of Biewen, Fitzenberger, Osikominu, and Paul
(2014) and Lechner and Wunsch (2013) based on German labour market data suggest that
so-called pre-treatment outcomes (e.g. lagged employment and wages measured prior to the in-tervention or treatment of interest), the prior benefit receipt history, socio-economic factors, and local labour market characteristics are important confounders that need to be controlled
for when evaluating ALMPs. This information is available in our data. In particular, the indi-viduals’ labour market histories are observed up to four years prior to unemployment and re-gional factors can also be controlled for at the level of the local employment agency districts.
While Doerr, Fitzenberger, Kruppe, Paul, and Strittmatter (2014) argue voucher award
in-volves a similar selection process as assignment of ALMPs in general, they also point out that
it is left to the discretion of the caseworker. An advantage of our data is that it also contains
information collected by the caseworker as base for counselling and assignment decisions,
namely: information on the job-seeker’s current and previous health status (physical and
mental), proxy variables indicating whether an unemployed person lacks motivation (e.g.
whether she/he dropped out of a past program or benefits were withdrawn), and former
sanc-tions.
Concerning actual redemption, Kruppe’s (2009) analysis of redemption behaviour
points to the fact that individuals with bad labour market prospects are less likely to redeem
their vouchers. On top of this limited evidence in the literature, we suspect that the latter is
affected by similar factors (although perhaps in different way) as voucher assignment. In
par-ticular, the previous labour market history, socio-economic characteristics like education and
age, and local labour market conditions should importantly influence an unemployed individ-ual’s decision to participate in a vocational training, as a function of the (personal assessment of the) expected benefits. Furthermore, (physical and mental) health and personality traits
associated with motivation and compliance in the counselling process (approximated by
bene-fit withdrawal and programme drop out) are likely to affect participation.
Given that vouchers have to be redeemed within three months, time-varying (or
dy-namic) confounding of redemption due to important changes in control variables after
voucher award but prior to voucher redemptions should not be an issue. To verify this
argu-ment, we estimated the effects of voucher assignment on a range of covariates measured at
redemption time, which were all close to and not statistically different from zero. We
there-fore control for the same set of covariates measured at the same point in time to tackle
and incapacities, nationality, school and vocational education, occupation, complete
employ-ment and welfare history of the last four years, past programme and sanction experience,
timing and region of unemployment, economic indicators at the level of the local employment
agency (see Table B.1 in Appendix B for the full set of control variables used).
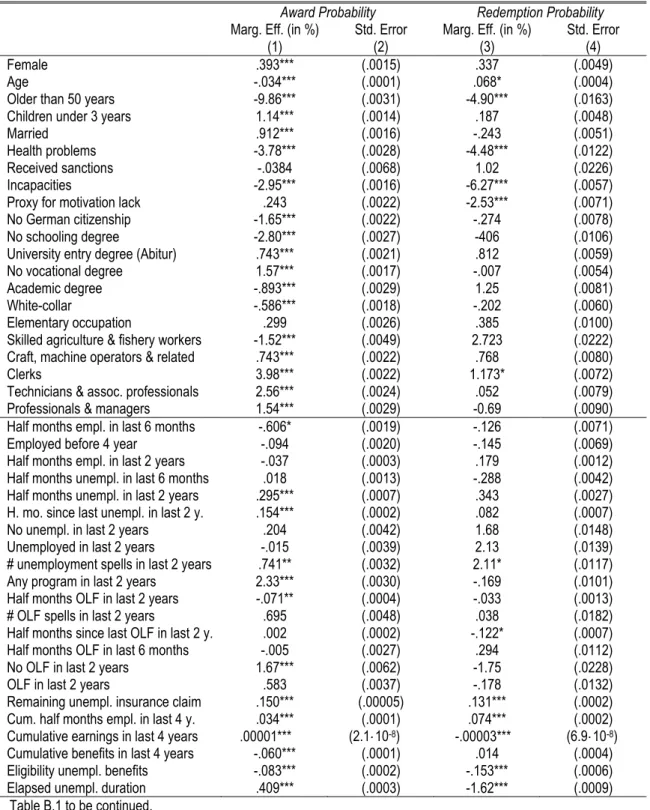
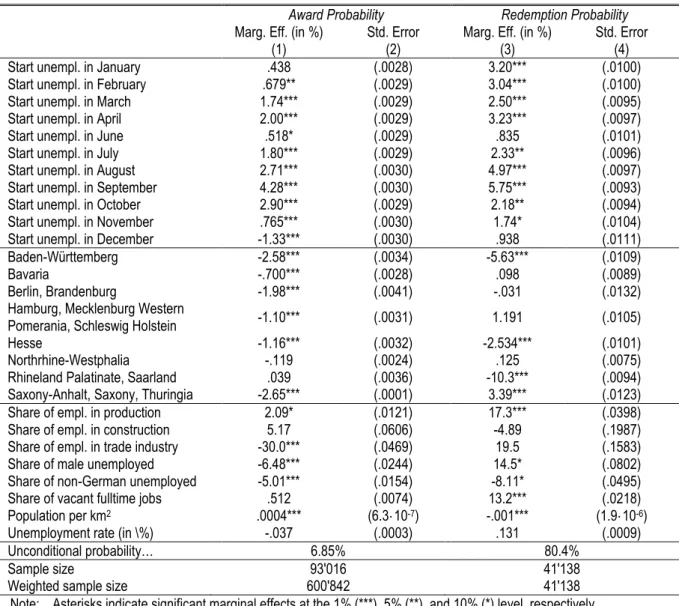
5.2 Empirical results
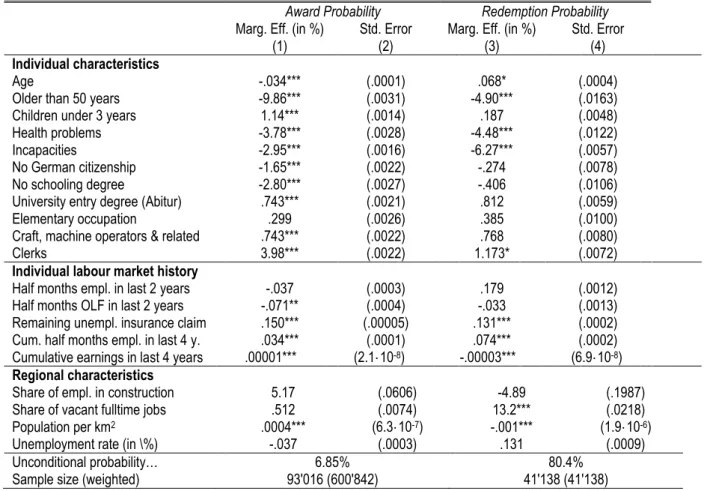
Table 5.1 shows the results of two propensity score estimations that relate to the
selec-tion into treatment and mediator states for selected variables (see Table B.1 in Appendix B for
a full set of results). They are based on a probit model.
Table 5.1: Selected average marginal effects from propensity score estimation
Award Probability Redemption Probability
Marg. Eff. (in %) Std. Error Marg. Eff. (in %) Std. Error
(1) (2) (3) (4)
Individual characteristics
Age -.034*** (.0001) .068* (.0004) Older than 50 years -9.86*** (.0031) -4.90*** (.0163) Children under 3 years 1.14*** (.0014) .187 (.0048) Health problems -3.78*** (.0028) -4.48*** (.0122) Incapacities -2.95*** (.0016) -6.27*** (.0057) No German citizenship -1.65*** (.0022) -.274 (.0078) No schooling degree -2.80*** (.0027) -.406 (.0106) University entry degree (Abitur) .743*** (.0021) .812 (.0059) Elementary occupation .299 (.0026) .385 (.0100) Craft, machine operators & related .743*** (.0022) .768 (.0080) Clerks 3.98*** (.0022) 1.173* (.0072)
Individual labour market history
Half months empl. in last 2 years -.037 (.0003) .179 (.0012) Half months OLF in last 2 years -.071** (.0004) -.033 (.0013) Remaining unempl. insurance claim .150*** (.00005) .131*** (.0002) Cum. half months empl. in last 4 y. .034*** (.0001) .074*** (.0002) Cumulative earnings in last 4 years .00001*** (2.1·10-8) -.00003*** (6.9·10-8)
Regional characteristics
Share of empl. in construction 5.17 (.0606) -4.89 (.1987) Share of vacant fulltime jobs .512 (.0074) 13.2*** (.0218) Population per km2 .0004*** (6.3·10-7) -.001*** (1.9·10-6)
Unemployment rate (in \%) -.037 (.0003) .131 (.0009)
Unconditional probability… 6.85% 80.4%
Sample size (weighted) 93'016 (600'842) 41'138 (41'138)
Note: Asterisks indicate significant marginal effects at the 1% (***), 5% (**), and 10% (*) level, respectively. Probit model used. Heteroscedasticity robust standard errors are in parentheses. The complete set of variables is contained in Table B.1 in Appendix B.
By and large these results confirm the impression obtained by the univariate
compari-sons of Table 4.1. Again, it appears that the group receiving a voucher has overall better
limited role. For the second comparisons, such regional characteristics seem to play a larger
role, while individual differences exist, but are far less pronounced than for the first
compari-son. The clear exemption to this general finding is the state of health which appears to be a
key factor related to voucher redemption in the sense that bad health substantially reduces the
probability to redeem a voucher.
6 Results
The propensity score estimates outlined Table 5.1 serve as inputs into the matching
pro-cedures. When performing matching, three potential concerns should be addressed: i)
insuffi-cient support in the propensity scores across treatment states; ii) large weights (in the
estima-tion) of observations with extreme propensity scores (which should entail some form of
trim-ming); and iii) the failure of matching to remove differences in the covariates that are relevant
in the propensity score estimation. In our application, insufficient support and extreme
obser-vations are not an issue problem, as can be seen from the distributions of the propensity scores
in the different groups (details in Figures B.1 and B.2 in the Appendix B). Furthermore, all
important covariates are well balanced such that no substantial differences remain after
matching (for details see Table B.2 in Appendix B).10
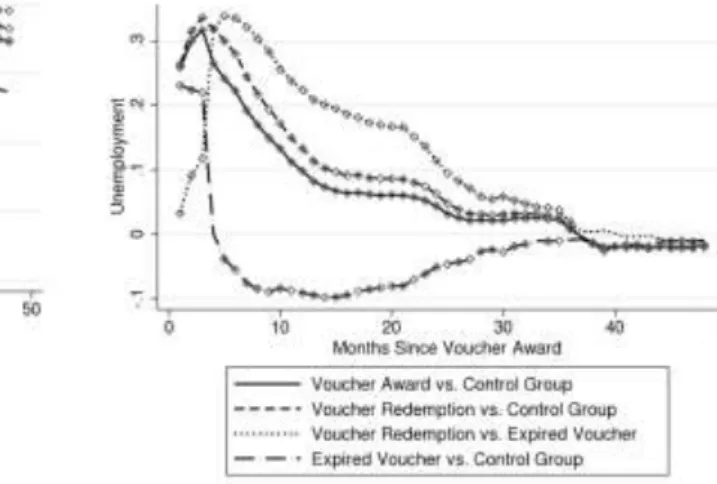
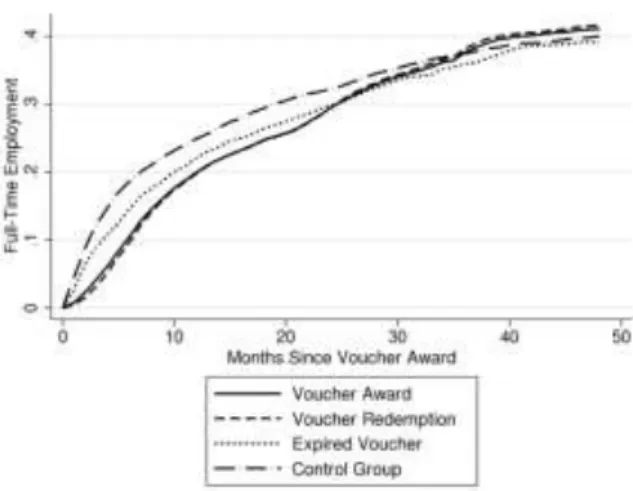
Figures 6.1 and 6.2 provide the estimates of the average employment and
unemploy-ment effects for voucher recipients, namely the (total) impacts of voucher award vs.
non-award (), and the effects of voucher award and redemption vs. non-award ( ), voucher award without redemption vs. non-award (
), and voucher award with redemption vs. voucher award without redemption ( ). Concerning employment, we consider only (non-marginal, non-subsidised) employment of at least one month. The lines reflect the effectmag-nitudes on the probability to be employed or unemployed in a particular month after voucher
10
Note that the balancing property of propensity score matching is automatic if the propensity score is correctly specified. Thus, these statistics essentially serve as tool to check the specifications of the two probit models estimated.
assignment over 4 years (48 months). Superimposed symbols on the lines (diamonds) indicate
effects that are (pointwise) statistically significantly different from zero.
The results in Figure 6.1 suggest that awarding a voucher has a negative (total)
em-ployment impact among voucher recipients in the first three years, in particular in the initial
months where the employment probability decreases by as much as 10 percentage points. This
dip points to the so-called lock-in effect likely due to reduced job search in response to
(an-ticipated) participation in a vocational training. However, after a gradual fade-out of the
neg-ative impact over roughly three years, the employment probability is statistically significantly
increased by approximately 2 to 3 percentage points in the fourth year. The positive
employ-ment effect appears quite stable and may therefore even last in the longer run. This suggests
that the voucher award system successfully compensates the initial lock in effect by a higher
placement success in later periods.
Figure 6.1: Employment Figure 6.2: Registered unemployment
Figure 6.2 shows that the time patterns for unemployed are (as expected) reversed, but
initially larger in magnitude. This is due to the fact that in the short run the award of a
voucher reduces also the drop-out from the labour market as shown by the effect on the labour
mag-nitude (but with opposite sign) to the employment effect, in the long-run registered
unem-ployment is reduced somewhat.
Investigating the causal mechanisms underlying the total employment effect (with
es-sentially symmetric results for registered unemployment), it becomes apparent that it is
pre-dominantly redemption (e.g. participation in/start of a vocational training) which drives the
results. In fact, the estimated effect of voucher award and redemption vs. no award ( ) closely follows the overall impact of voucher award, albeit it is somewhat more negative in
earlier and more positive in later periods. In contrast, the direct effect of voucher award
with-out redemption (
) is insignificant and close to zero in most of the fourth year. This suggests that in the long run, mere voucher assignment does not affect for instance the preferences forhuman capital investments in a way that they influence employment success.
We nevertheless find a negative direct effect in the short run: Even without actual
re-demption, voucher award decreases the employment probability in the first three to 3.5 years
and therefore appears to reduce job search activities. This may be rooted in the learning and
decision process about the supply of vocational training. Individuals may initially reduce job
search intensity in response to voucher award and consider the programmes available. Some
of them may then not be satisfied with the programmes available and therefore decide not to
redeem the voucher. Rather, they try to find employment again.
We would expect this initial direct lock-in effect to be less severe than for the total
ef-fect (which also includes the impact of actual redemption leading to training participation), as
individuals should be sooner available for intensive job search when foregoing redemption.
Indeed, we find that in the initial periods, the estimated
is considerably less negative than the estimates of and in particular of (redemption vs. non-award). Accordingly, the esti-mate of (redemption vs. award without redemption) is initially negative (as ) and significantly so. However, with regard to later periods, redemption pays off for the populationof all voucher recipients: After roughly two years, the estimates of and dominate those of
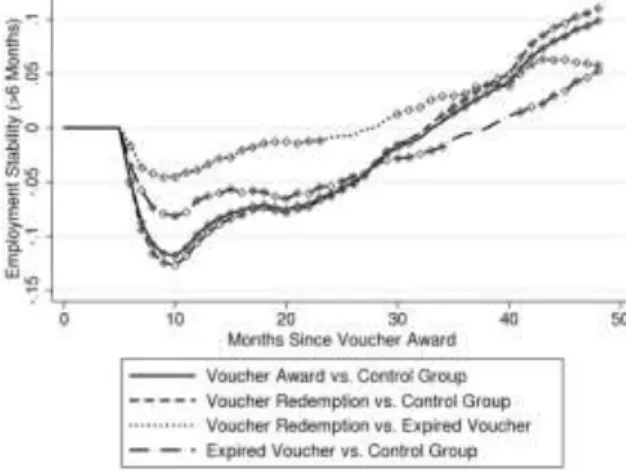
and the estimates of are significant and non-negligible (up to 5 percentage points) in later periods.Besides employment and unemployment, we considered several other outcome
varia-bles (presented in Appendix C). One of these additional variavaria-bles is a measure for
employ-ment stability, i.e. being employed for at least 6 months. For the latter variable, the outcome
evaluation window only starts in month 7 after voucher award. The estimates of the (total)
impact of voucher award vs. non-award () and voucher award and redemption vs. non-award ( ) on stable employment are qualitatively similar to those on employment, albeit the former become significantly positive at a later point in time and are of a somewhat smaller
magnitude. In contrast to Figure 6.1, the estimate of the direct effect (
) now remains statisti-cally significantly negative until the end of the evaluation window (implying that the adverseeffect of not redeeming a voucher vs. not getting one is more severe for stable employment),
even though it shows an upward tendency.
Furthermore, we investigated the effects on full time employment, defined as an
indi-cator for working on a position with 100% fulltime equivalent. Again, the results are
qualita-tively similar to the employment effects of Figure 6.1, including an insignificant direct effect
in the fourth year after voucher award. Similar conclusions apply to the effects on monthly
earnings: After an initial lock in phase, the estimates of , , and are moderately posi-tive (between 30 and 70 EUR) and statistically significantly so in the fourth year, while that of
approaches zero.7 Conclusion
Using rich administrative labour market data from Germany, we evaluated the
We found an overall negative short term but positive longer run effect on the employment of
voucher recipients. As a key contribution, we also investigated alternative causal mechanisms
through which the overall effect materializes, using a sequential conditional independence
assumption. In particular, we considered the direct employment effect of voucher assignment
(net of actual redemption), which may for instance be driven by decreased job search intensity
during the assessment of training options, or increased awareness about (and a changed
pref-erence for) human capital investments in general.
The direct effect turned out to be insignificant in the longer run, but negative in the
short run (albeit less so than the overall impact), pointing to a decreased search intensity
shortly after voucher assignment (despite non-redemption). In contrast, the effect of actual
voucher redemption (vs. non-award and non-redemption) closely follows the overall effect,
albeit it is somewhat more negative in earlier and more positive in later periods. Comparing
the latter to the direct effect suggests that conditional on voucher assignment, redemption (and
thus, actual programme participation) entails a more severe negative (or lock in) effect on
voucher recipients than under non-redemption, which is intuitive because individuals not
re-deeming are sooner available for the labour market. In the longer run, however, redemption
pays off and significantly increases the employment probability by roughly two to three
per-centage points when compared to non-award in the fourth (and last observed) year after
voucher assignment.
From a policy perspective, our results suggest that the introduction of a voucher award
system, which was embraced for promoting the self-responsibility of training participants and
competition among training providers, may come with an efficiency loss in the case that
indi-viduals do not make use of the awards: non-redemption entails lower employment chances
be the least attractive option. This needs to be taken into account when designing the
provi-sion of active labour market policies through a voucher award system.
References
Abadie, A., and Imbens, G.W. (2008): On the Failure of the Bootstrap for Matching Estimators. Econometrica, 76, 1537–1557.
Abadie, A., and Imbens, G.W. (2011): Bias-Corrected Matching Estimators for Average Treatment Effects, 29,
Journal of Business & Economic Statistics, 1–11.
Baron, R.M., and Kenny, D.A. (1986): The Moderator-Mediator Variable Distinction in Social Psychological Research: Conceptual, Strategic, and Statistical Considerations. Journal of Personality and Social
Psychol-ogy, 51, 1173–1182.
Biewen, M., Fitzenberger, B., Osikominu, A., and Paul, M. (2014): The Effectiveness of Public Sponsored Training Revisited: The Importance of Data and Methodological Choices. Journal of Labor Economics, 32, 837–897.
Dehejia, R.H., and Wahba, S. (2002): Propensity-score-matching methods for nonexperimental causal studies.
The Review of Economics and Statistics, 84, 151–161.
Doerr, A., Fitzenberger, B., Kruppe, T., Paul, M., and Strittmatter, A. (2014): Employment and Earnings Effects of Awarding Training Vouchers in Germany. IZA Discussion Paper, 8454.
Doerr, A., and Strittmatter, A. (2014): Assignment Mechanisms, Selection Criteria, and the Effectiveness of Training Programmes. Working paper, University of Freiburg i.Br.
Flores, C.A., and Flores-Lagunes, A. (2009): Identification and Estimation of Causal Mechanisms and Net Ef-fects of a Treatment under Unconfoundedness. IZA Discussion Paper No. 4237.
Heckman, J., Ichimura, H., and Todd, P. (1998): Matching as an Econometric Evaluation Estimator. The Review
of Economic Studies, 65, 261-294.
Heckman, J., Pinto, R., and Savelyev, P. (2013): Understanding the Mechanisms through Which an Influential Early Childhood Program Boosted Adult Outcomes. American Economic Review, 103, 2052–2086.
Heinrich, C., Mueser, P., Troske, K., Jeon, K., and Kahvecioglu, D. (2010): New Estimates of Public Employ-ment and Training Program Net Impacts: A NonexperiEmploy-mental Evaluation of the Workforce InvestEmploy-ment Act Program,” Working Paper No. 1003, Department of Economics, University of Missouri.
Huber, M. (2014): Identifying causal mechanisms (primarily) based on inverse probability weighting. Journal of
Applied Econometrics, 29, 920-943.
Huber, M., M. Lechner, M., and Mellace, G. (2014): Why do tougher caseworkers increase employment? The role of programme assignment as a causal mechanism. University of St. Gallen, Dept. of Economics Discussion Paper no. 2014-14.
Huber, M., Lechner, M., and Wunsch, C. (2013): The performance of estimators based on the propensity score.
Imai, K., Keele, L., and Yamamoto, T. (2010): Identification, Inference and Sensitivity Analysis for Causal Me-diation Effects. Statistical Science, 25, 51–71.
Imbens, G. W. (2000): The Role of the Propensity Score in Estimating Dose-response Functions. Biometrika, 87, 706 – 710.
Joffe, M.M., Ten Have, T.R., Feldman, H., and Kimmel, S.E. (2004): Model Selection, Confounder Control, and Marginal Structural Models: Review and New Applications. The American Statistician, 58, 272–279.
Kruppe, T. (2009): Bildungsgutscheine in der aktiven Arbeitsmarktpolitik. Sozialer Fortschritt, 58 (1), 9-19.
Lechner, M. (2001): Identification and Estimation of Causal Effects of Multiple Treatments under the Condi-tional Independence Assumption. In: Lechner, M., and Pfeiffer, F., (eds.) Econometric Evaluation of Labour
Market Policies, 43–58, Heidelberg, Physica/Springer.
Lechner, M. (2009): Sequential Causal Models for the Evaluation of Labor Market Program. Journal of Business
& Economic Statistics, 27, 71–83.
Lechner, M., and Miquel, R. (2010): Identification of the effects of dynamic treatments by sequential conditional independence assumptions. Empirical Economics, 39, 111–137.
Lechner, M., Miquel, R., and Wunsch, C. (2011): Long-Run Effects of Public Sector Sponsored Training In West Germany. Journal of the European Economic Association, 9, 742–784.
Lechner, M., and Wunsch, C. (2013): Sensitivity of Matching-Based Program Evaluations to the Availability of Control Variables. Labour Economics, 21, 111–121.
Pearl, J. (2001): Direct and indirect effects. In Proceedings of the Seventeenth Conference on Uncertainty in
Ar-tificial Intelligence, San Francisco: Morgan Kaufman, 411–420.
Petersen, M.L., Sinisi, S.E., and van der Laan, M.J. (2006): Estimation of Direct Causal Effects. Epidemiology, 17, 276–284.
Rinne, U., Uhlendorff, A., and Zhao, Z. (2013): Vouchers and Caseworkers in Training Programs for the Unem-ployed, Empirical Economics, 45, 1089–1127.
Robins, J.M. (1986): A new approach to causal inference in mortality studies with sustained exposure periods— application to control of the healthy worker survivor effect. Mathematical Modelling, 7, 1393–1512, with 1987 Errata to “A new approach to causal inference in mortality studies with sustained exposure periods— application to control of the healthy worker survivor effect”. Computers & Mathematics with Applications, 14, 917–921; 1987 Addendum to “A new approach to causal inference in mortality studies with sustained ex-posure periods—application to control of the healthy worker survivor effect”, Computers & Mathematics
with Applications, 14, 923–945; and 1987 Errata to “Addendum to ‘A new approach to causal inference in
mortality studies with sustained exposure periods—application to control of the healthy worker survivor ef-fect”’, Computers & Mathematics with Applications, 18, 477.
Robins, J.M. (1989): The analysis of randomized and nonrandomized aids treatment trials using a new approach to causal inference in longitudinal studies. In: Sechrest, L., Freeman, H., and Mulley, A. (eds.) Health service research methodology: a focus on AIDS, 113–159, Washington, D.C., Public Health Service, National Center for Health Services Research.
Robins, J.M., Hernan, M.A., and Brumback, B. (2000): Marginal structural models and causal inference in epi-demiology. Epidemiology, 11, 550–560.
Robins, J.M. (2003): Semantics of causal DAG models and the identification of direct and indirect effects. In
Highly Structured Stochastic Systems, P.J. Green, N.L. Hjort, and S. Richardson (eds.), Oxford: Oxford
Uni-versity Press, 70–81.
Robins, J.M., and Greenland, S. (1992): Identifiability and Exchangeability for Direct and Indirect Effects.
Epi-demiology, 3, 143–155.
Rosenbaum, P., and Rubin, D.B. (1983): The Central Role of the Propensity Score in Observational Studies for Causal Effects. Biometrika, 70, 41–55.
Rosenbaum, P., and Rubin, D.B. (1985): Constructing a Control Group Using Multivariate Matched Sampling Methods that Incorporate the Propensity Score. The American Statistician, 39, 33 – 38.
Rubin, D. B. (1974): Estimating Causal Effects of Treatments in Randomized and Nonrandomized studies.
Jour-nal of EducatioJour-nal Psychology, 66, 688 – 701.
Rubin, D.B. (1979): Using Multivariate Matched Sampling and Regression Adjustment to Control Bias in Ob-servational Studies. Journal of the American Statistical Association, 74, 318–328.
Rubin, D. B. (1980): Discussion of ‘Randomization Analysis of Experimental Data in the Fisher Randomization Test’ by D. Basu. Journal American Statistical Association, 75, 591–593.
VanderWeele, T.J. (2009): Marginal Structural Models for the Estimation of Direct and Indirect Effects.
Appendix A: Descriptive statistics
Table A.1 contains the descriptive statistics for the full set of variables used in the
esti-mation of the propensity scores.
Table A.1: Means and standardized biases for all control variables
Voucher … awarded … redeemed
yes no yes no Standardized difference (1) (2) (3) (4) (1) - (2) (1) - (3) (1) - (4) (3) - (4) Female 0.46 0.43 0.46 0.46 4.91 0.11 0.44 0.54 Age 39.03 41.75 39.01 39.11 31.44 0.27 1.10 1.38 Older than 50 years 0.01 0.12 0.01 0.02 43.59 1.02 3.79 4.80 Children under 3 years 0.43 0.35 0.43 0.41 15.06 0.58 2.39 2.97 Married 0.30 0.27 0.30 0.32 8.09 0.75 3.06 3.82 Health problems 0.02 0.06 0.02 0.03 20.08 2.08 7.35 9.38 Received sanctions 0.01 0.01 0.01 0.01 0.35 0.07 0.27 0.33 Incapacities 0.12 0.19 0.11 0.17 19.53 3.70 13.75 17.43 Proxy for motivation lack 0.09 0.09 0.09 0.10 2.43 0.66 2.63 3.29 No German citizenship 0.07 0.10 0.07 0.08 10.35 0.60 2.40 3.00 No schooling degree 0.04 0.07 0.04 0.04 13.74 0.33 1.34 1.67 University entry degree (Abitur) 0.23 0.17 0.24 0.23 17.21 0.40 1.66 2.06 No vocational degree 0.21 0.22 0.21 0.21 3.34 0.26 1.08 1.34 Academic degree 0.12 0.09 0.12 0.11 7.58 0.35 1.47 1.82 White-collar 0.39 0.49 0.39 0.38 20.74 0.24 0.98 1.22 Elementary occupation 0.07 0.10 0.07 0.07 11.15 0.21 0.87 1.09 Skilled agriculture & fishery workers 0.01 0.02 0.01 0.01 7.14 0.35 1.50 1.84 Craft, machine operators & related 0.29 0.35 0.29 0.28 13.60 0.37 1.52 1.89 Clerks 0.25 0.16 0.25 0.25 23.08 0.02 0.10 0.12 Technicians & assoc. professionals 0.16 0.12 0.16 0.16 9.97 0.27 1.08 1.35 Professionals & managers 0.12 0.10 0.12 0.12 5.86 0.10 0.41 0.51 Half months empl. in last 6 months 11.95 11.92 11.95 11.96 7.29 0.27 1.14 1.41 Employed before 4 year 0.67 0.67 0.68 0.66 0.02 0.62 2.51 3.13 Half months empl. in last 2 years 45.17 44.30 45.19 45.12 12.33 0.21 0.83 1.04 Half months unempl. in last 6 months 0.10 0.09 0.10 0.10 1.96 0.25 1.04 1.28 Half months unempl. in last 2 years 0.48 0.49 0.48 0.46 0.38 0.22 0.93 1.15 H. mo. since last unempl. in last 2 y. 45.91 44.87 45.91 45.92 14.28 0.03 0.14 0.17 No unempl. in last 2 years 0.89 0.89 0.89 0.89 0.19 0.15 0.63 0.78 Unemployed in last 2 years 0.04 0.04 0.04 0.04 2.99 0.16 0.68 0.84 # unemployment spells in last 2 years 0.15 0.15 0.15 0.14 0.09 0.31 1.31 1.62 Any program in last 2 years 0.05 0.05 0.05 0.05 2.06 0.14 0.59 0.73 Half months OLF in last 2 years 1.59 2.19 1.59 1.63 11.74 0.17 0.67 0.84 # OLF spells in last 2 years 0.15 0.21 0.15 0.15 13.81 0.04 0.15 0.19 Half months since last OLF in last 2 y. 45.43 43.97 45.43 45.44 17.77 0.03 0.12 0.15 Half months OLF in last6 months 0.02 0.05 0.02 0.02 8.21 0.25 1.09 1.34 No OLF in last 2 years 0.87 0.82 0.87 0.87 12.57 0.03 0.10 0.13 OLF in last 2 years 0.11 0.12 0.11 0.11 3.94 0.38 1.54 1.91 Remaining unempl. insurance claim 25.35 20.32 25.57 24.44 35.62 1.65 6.55 8.20 Cum. half months empl. in last 4 y. 80.92 79.48 81.06 80.34 6.56 0.64 2.58 3.22 Cumulative earnings in last 4 years 91258 84199 91126 91799 14.71 0.27 1.10 1.37 Cumulative benefits in last 4 years 3.10 3.45 3.07 3.18 4.36 0.27 1.10 1.37 Eligibility unempl. benefits 8.90 10.95 9.14 7.92 31.44 4.09 16.42 20.54 Elapsed unempl. duration 4.46 3.76 4.19 5.56 21.04 8.08 30.56 38.81
Table A.1 continued …
Voucher … awarded … redeemed
yes no yes no Standardized difference (1) (2) (3) (4) (1) - (2) (1) - (3) (1) - (4) (3) - (4) Start unempl. in January 0.08 0.10 0.08 0.08 6.33 0.17 0.69 0.86 Start unempl. in February 0.08 0.09 0.08 0.08 3.94 0.07 0.27 0.34 Start unempl. in March 0.09 0.09 0.09 0.10 1.18 0.45 1.80 2.25 Start unempl. in April 0.09 0.09 0.09 0.09 1.10 0.23 0.94 1.16 Start unempl. in June 0.07 0.08 0.07 0.08 4.96 1.13 4.41 5.53 Start unempl. in July 0.09 0.08 0.09 0.10 2.35 0.50 2.03 2.53 Start unempl. in August 0.10 0.08 0.10 0.09 5.79 0.79 3.32 4.10 Start unempl. in September 0.12 0.08 0.13 0.10 14.88 1.65 7.12 8.76 Start unempl. in October 0.11 0.08 0.11 0.10 7.99 0.19 0.79 0.98 Start unempl. in November 0.07 0.08 0.07 0.07 3.33 0.15 0.60 0.75 Start unempl. in December 0.05 0.08 0.05 0.05 12.21 0.42 1.67 2.09 Baden-Württemberg 0.09 0.11 0.09 0.12 5.26 1.82 7.04 8.86 Bavaria 0.15 0.14 0.15 0.14 3.83 0.93 3.91 4.84 Berlin, Brandenburg 0.10 0.09 0.09 0.12 2.08 2.09 8.01 10.09 Hamburg, Mecklenburg Western
Pomerania, Schleswig Holstein 0.08 0.09 0.08 0.07 4.28 0.89 3.78 4.67 Hesse 0.07 0.07 0.07 0.07 0.50 0.51 2.04 2.55 Northrhine-Westphalia 0.23 0.21 0.24 0.21 5.49 1.25 5.23 6.47 Rhineland Palatinate, Saarland 0.06 0.05 0.06 0.09 4.54 2.93 10.69 13.59 Saxony-Anhalt, Saxony, Thuringia 0.11 0.15 0.12 0.09 9.54 1.97 8.65 10.61 Share of empl. in the production 0.25 0.25 0.25 0.25 3.88 0.86 3.49 4.35 Share of empl. in the construction 0.06 0.06 0.06 0.06 7.17 2.64 11.20 13.84 Share of empl. in the trade industry 0.15 0.15 0.15 0.15 1.38 1.24 5.12 6.36 Share of male unempl. 0.56 0.56 0.56 0.56 1.44 0.05 0.21 0.26 Share of non-German unempl. 0.14 0.14 0.14 0.15 4.03 2.37 9.75 12.13 Share of vacant fulltime jobs 0.78 0.78 0.78 0.77 3.94 2.84 10.63 13.46 Population per km2 965 868 919 1156 5.72 2.69 10.02 12.69
Unemployment rate (in \%) 12.33 12.53 12.33 12.36 3.69 0.13 0.52 0.65 Observations 41'138 51'878 33'077 8'061
Sum Weighted Obs 41'138 559'704 33'077 8'061
Note: See Rosenbaum and Rubin (1985) for a definition of the standardized difference.
Table A.2: Difference in means of some important control variables in the initial and final sample.
Means in the Difference …initial sample …final sample
(1) (2) (3)
Female 0.42 0.43 -0.01 Age 38.77 41.56 -2.79 Children under 3 years 0.41 0.36 0.05
Married 0.48 0.27 0.21
Received sanctions 0.03 0.01 0.02
Incapacities 0.21 0.19 0.03
Proxy for motivation lack 0.14 0.09 0.05 University entry degree (Abitur) 0.17 0.17 -0.01 Vocational degree 0.67 0.69 -0.02 Academic degree 0.08 0.09 -0.01
Note: The descripitive statistics for the initial sample are based on the 230,842 observations initially provided by the IAB. The descriptive of the final sample are calculated after the sample selection (see discussion Section 4.3).
Figures A.1 to A.3 contain the evolvement of the matched levels of the outcome
varia-bles considered, while Figures A.4 to A.8 show the respective (unadjusted) differences.
Figure A.1: Mean of stable employment Figure A.2: Mean of full time employment