HAL Id: hal-01361942
https://hal.archives-ouvertes.fr/hal-01361942
Submitted on 7 Sep 2016HAL is a multi-disciplinary open access archive for the deposit and dissemination of sci-entific research documents, whether they are pub-lished or not. The documents may come from teaching and research institutions in France or abroad, or from public or private research centers.
L’archive ouverte pluridisciplinaire HAL, est destinée au dépôt et à la diffusion de documents scientifiques de niveau recherche, publiés ou non, émanant des établissements d’enseignement et de recherche français ou étrangers, des laboratoires publics ou privés.
to Polymer Behavior in Side-Chain Liquid Crystal
Polymers
Laurence Noirez, A Lapp
To cite this version:
Laurence Noirez, A Lapp. Shear Flow Induced Transition from Liquid-Crystalline to Polymer Behavior in Side-Chain Liquid Crystal Polymers. Physical Review Letters, American Physical Society, 1997, �10.1103/PhysRevLett.78.70�. �hal-01361942�
Shear Flow Induced Transition from Liquid-Crystalline to Polymer Behavior
in Side-Chain Liquid Crystal Polymers
L. Noirez and A. Lapp
Laboratoire Léon Brillouin (CEA-CNRS), Ce-Saclay 91191, Gif-sur-Yvette, France
(Received 9 September 1996)
We determine the structure and conformation of side-chain liquid-crystalline polymers subjected to shear flow in the vicinity of the smectic phase by neutron scattering on the velocity gradient plane. Below the nematic-smectic transition we observe a typical liquid-crystal behavior; the smectic layers slide, leading to a main-chain elongation parallel to the velocity direction. In contrast, a shear applied above the transition induces a tilted main-chain conformation which is typical for polymer behavior. [S0031-9007(96)01984-9]
PACS numbers: 61.41. + e, 47.50. + d, 64.70.Md, 83.50.Ax
The effect of shear constraint on the behavior of liq-uid crystals or on the behavior of “ordinary” polymers has been studied for more than two decades both experi-mentally and theoretically [1]. In contrast, the investiga-tion of liquid crystal polymer behavior under shear flow has only recently begun [2]. Very interesting behavior can be expected for liquid crystal polymers owing to the competition between the internal strain produced by the side-chain mesogens on the main chain and the external strain brought by the shear process. Recently, we have studied the evolution of the main-chain conformation in the shear plane of a liquid crystal polymethacrylate as a function of the shear rate [3]. It is shown that macro-scopic shear is transmitted at a micromacro-scopic level by the smectic layers, ensuring an efficient shear of the poly-mer main chains. The outcome is a macroscopic orienta-tion of the smectic monodomains whose smectic planes are established parallel to the shear plane. The poly-mer main chains already confined by the mesogenic lay-ers become more elongated along the velocity direction with increasing shear (Fig. 1). These results were ob-tained from measurements carried out in situ in the shear plane, whereas other planes were observed on a quenched sample after shearing. In this article we consider mea-surements made in situ in the plane of the velocity gradient (vorticity plane). This plane is particularly in-teresting since it allows the simultaneous observation of the formation of the smectic phase and of the conforma-tion of the polymer main chain versus shear rate. Such a direct study has never been carried out in bulk, even for nonliquid crystalline polymers. This last experiment [4] confirmed the theory that bulk polymer conformation un-der shear flow is a tilted elongated shape resulting from a combination of rotational and translational motions. We obtained the same result using our cell with a polysty-rene melt.
The liquid-crystalline polymer PMA-OC4H9 used here is the same as described in Ref. [2] and corresponds to the structural formula
with either X H or X D (we used a 1:1 isotopic mixture in order to obtain the central scattering associated with the main-chain conformation).
The sample has the following mesophases and tran-sition temperatures: Tg 35±C –SA1 (smectic)–99±C –N
(nematic) –104±C– I (isotropic) (values determined by differential scanning calorimetry with a cooling rate of
25±Cymin).
Before and after the shear experiment, gel permeation chromatography provided the same weight average mo-lecular weight Mw 140 000 with polydispersity I ø
2.8. In contrast with Ref. [2], no significant change of
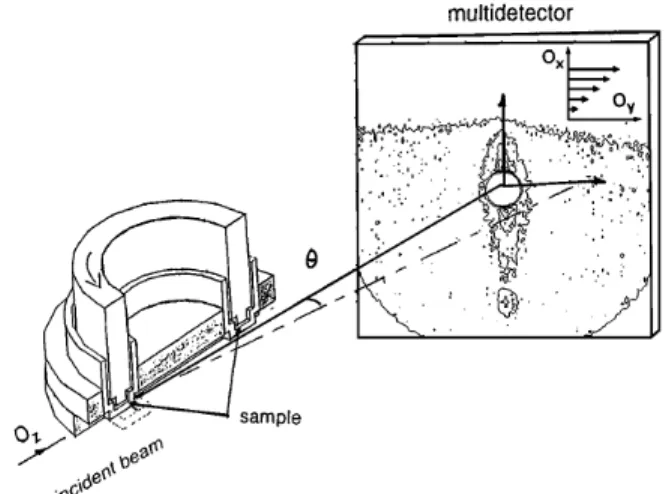
molecular weight was observed. The device is illustrated in Fig. 2. The cell takes advantage of the extremely long mean free path specific of cold neutrons (consequently, such a cell cannot be used for observing the vorticity plane in x-ray measurements). It consists of a thin hollow open aluminum ring (3.5 mm wide, 1 mm deep) in which the polymer is deposed. This part is static. Above this ring a filled ring of the same width and diameter is placed in contact with the polymer and shear is enabled by a steady-state rotation around the same axis. The cell is tilted at 2±–3± (to the horizontal) in order to place only one side of the ring on the beam trajectory. Small resistors are used as heating devices. The scattered beam is collected on a plane of an xy multidetector (PAXY of
FIG. 1. Main-chain/mesogen organization at rest in the tic phase. ( b) Shear flow resulting conformation in the smec-tic phase.
FIG. 2. Schematic of the neutron scattering cell used for the observation of the vorticity plane with a typical neutron scattering pattern sl 3.5 Å, d 2 md obtained with the HyD mixture in the smectic phase sT 93±Cd under a shear flow of 6 s21. The upper part of the pattern corresponds to a shadow due to the upper rotating ring.
the Laboratoire Léon Brillouin) of 128 3 128 cells. The data are normalized and the background noise removed. We have used two configurations, depending on the neutron wavelength l 3.5 Å for the observation of the 001 smectic reflection and l 10 Å for the observation of the small-angle region (SANS). In both cases, the multidetector-sample distance is 2 m.
The small-angle scattering obeys the Guinier ap-proximation for which the scattered intensity Is !q d is
proportional to the form factor Ps !q d associated with the
main-chain part of the polymer: 1yIs !q da1yPs !q d Nk1 1 sqx2Rx2 1 q2yRy21 qz2Rz2dl, where !q is the scat-tering vector sj !q j 4pl sinu2d with u the scattering angle. x, y, or z are the Ox axis (parallel to the velocity gradient), the Oy axis (parallel to the velocity direction), and the Oz axis (perpendicular to the velocity direction), respectively, and N is the degree of polymerization.
In the smectic phase, the polymer main chains preferen-tially occupy the space available between the mesogenic layers [5] [Fig. 1(a)]. The main chains can be consid-ered as already subjected to the internal constraint from the mesogen layers. By applying a mechanical shear, the viscoelastic properties of the polymer, as well as those of the liquid crystalline phase sSAd, can be exacerbated. It
is necessary to work close to the N-SA transition because
the viscous properties of the liquid crystalline phase are rapidly reduced at low temperature.
The first series of measurements were carried out at a temperature of 93±C, slightly below the N-SA
transition, whereas in the second series, the polymer behavior is examined during this transition. Structural information is drawn from a two-dimensional Gaussian fit of the 001 smectic reflection, whereas the conformational information is provided by a two-dimensional Lorentzian fit of the central scattering.
FIG. 3. Evolution of the 001 smectic reflection versus shear rate at 93±C. The points s≤d correspond to the intensity maximum, whereas 1 and ± are the correlation lengths of the smectic order following Ox and Oy directions, respectively (without correction of the spectrometer resolution function).
Figure 3 presents the evolution of the intensity maxi-mum of the 001 reflection as a function of the shear rate as well as the smectic correlation lengths in both Ox and
Oy directions. The increase of both 001 intensity and
correlation lengths is evidence of a shear induced align-ment which drives the smectic layers parallel to the shear plane. The comparison of the correlation lengths in both directions indicates that the smectic range is higher along the velocity direction Ox than in the velocity gradient di-rection Oy. The position of the peak is the same within
60.3 Å and is independent of the shear rate, indicating
that the mesogens are nearly perpendicular to the smectic plane and, on average, at the maximum possible elonga-tion [layer thicknesssdd mesogen length ø 29 Å].
Two regimes can be distinguished in Fig. 3.
(i) A first regime of shear flow s0 , Ùg # 10 s21d, corresponding to the alignment process of the smectic layers parallel to the shear plane. In this regime, the 001 intensity increases rapidly and reaches a maximum for Ùg ø 6 7 s21.
(ii) A second regime corresponding to a decrease of the maximum of the 001 intensity when Ùg . 10 s21(without a change of correlation lengths associated with the peak). In this regime, the shear introduces instabilities which destroy the orientation of the layers. This phenomenon is reversible (the intensity increases again once the shear is reduced) and cannot be attributed to an internal craze inside the sample since no relaxation phenomenon is observed. We conclude therefore that high shear rates act on the scale of the layers, causing them to spread randomly in the shear field [6].
Figure 4 shows the evolution of main-chain anisotropy in the vorticity plane against shear rate. SANS measure-ments have been alternated with diffraction measuremeasure-ments. The extension of the polymer main chain in the direc-tion of velocity Ry becomes clearly larger when the shear increases, whereas Rx gets smaller and almost constant at the smallest shear rate. As we showed in our earlier paper [3], here are two simultaneous processes, a reori-71
FIG. 4. Evolution of the components Rxs≤d and Ry s±d of the radius of gyration of the polymer main chain along Ox and
Oyversus the shear rate at 93±C.
entation of the smectic monodomains which takes place very early and also a progressive elongation of the main chain confined between mesogen layers, along the veloc-ity direction Ox. As can be ascertained from Fig. 2, the central scattering (associated to the form factor of the poly-mer main chain) presents no tilt but a shape elongated along Oy. This is the signature of liquid-crystalline be-havior. The difference observed for the values at rest
sRx 27 Å, Ry 36 6 5 Åd corresponds to a partial
orientation during the filling of the device. The reorienta-tion process takes place very early since Rx has reached a relatively stable value when Ùg ø 1 s21. In another experi-ment, the polymer was previously aligned (with a magnetic field) with the smectic layers perpendicular to the shear plane. The application of a shear of 0.5 s21was sufficient to destroy the initial orientation and to recover the usual orientation afterø100 s. This experiment illustrates the intensity of the forces driving the smectic layers parallel to the y0z shear plane. The value of Rx is smaller than the layer thickness (Rx ø 20 25 Å compared to d ø 29 Å) which means that the main chains do not cross the lay-ers. This is necessary for layers to slide and could explain
the decrease of molecular weight observed during the ear-lier shear experiment [3]. The main-chain extension in the direction parallel to the velocity (Ry) increases progres-sively and corresponds largely to the elongation process. Indeed, the sample becomes transparent as soon as a very small shear rate is applied and the polymer main chain elongates in the velocity direction with increasing shear [3]. The smaller values of Ry, obtained at high shear rates
s Ùg . 10 s21d, corroborate the observation carried out on the 001 reflection. The decrease of Ry (and probably the increase of Rx) results from the disorientation of the smec-tic layers since the main chains are confined between the mesogen layers.
As the N-SA transition is approached, the relaxation
time associated to the density wave of the smectic fluc-tuations becomes the control parameter of the dynamics of the whole system. Since polymer and liquid crystal are coupled, the polymer motion is also reduced and two criti-cal shear rates are expected to result corresponding to both aspects. The situation described in the preceding para-graph corresponds to the case where smectic forces domi-nate. In order to instigate a real competition between the two behaviors, it is necessary to decrease the smectic force and hence to start the shear process 5– 6±C above the ex-pected N-SA transition to be sure to weaken the smectic
forces (the nematic phase presents smectic fluctuation). It is also necessary to apply a relatively high shear since no main-chain deformation was observed in the isotropic and nematic phases [3]. We slowly decrease the temperature using the approach to the transition to induce a slowing down of the polymer motion.
The sample is heated at rest in the shear device until it reaches the isotropic phase. The shear is then progres-sively increased to 15 s21, and the temperature is slowly decreased until the first diffuse intensity associated with the smectic fluctuations (98±C) appears. This process is carried out on the 100% H sample of PMA-OC4H9since a stronger smectic intensity compared to the HyD mixture
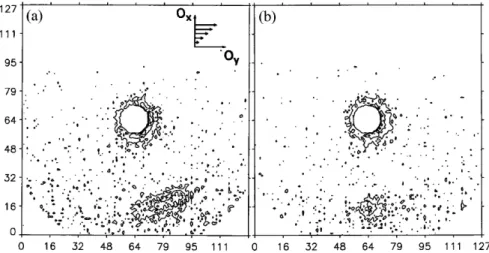
FIG. 5. Evolution of the scattering pattern obtained in the vorticity plane with the fully hydrogenated polymer submitted to a shear rate of 15 s21 at 98±C. The time interval between the appearance of the diffuse scattering (a) and the appearance of the 001 reflection ( b) isø1800 s.
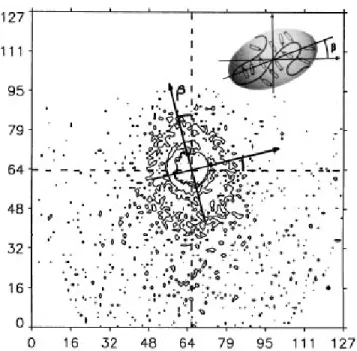
FIG. 6. Small-angle neutron scattering sl 3.5 Å, d 2 md obtained with the HyD mixture under the same experi-mental conditions as for Fig. 5.
and the absence of central scattering makes the measure-ments easier.
As can be seen in Fig. 5(a), a scattering of short correlation lengths70 Åd corresponding to the previous smectic distance s28 Åd first appears tilted at 20±to the normal to the shear plane. Keeping the same temperature (98 6 1±C) and shear rate (15 s21), we observe the migration of this scattering from 20±to the usual stable position normal to the shear plane [Figs. 5(a) and 5( b)]. The two figures represent a 30 min interval.
These conditions are reproduced as faithfully as pos-sible for the HyD mixture in order to determine the corresponding main-chain conformation. In the isotropic phase, we observe an isotropic main-chain conformation. The temperature is then slowly decreased under shear, and a slightly elongated tilted scattering (Fig. 6) appears for temperatures close to 98±C before reaching the stable smectic phase. It corresponds to main chains tilted from
ø15±
compared to Oy of average dimensions Rxp 56 6
5 Å and Ryp 36 6 5 Å along the major axis. This
sit-uation recalls the “tank tread” rotation adopted by ordi-nary polymers under shear flow [4], indicating that the viscoelastic properties of the main chains are exacerbated. However, such a rheological behavior is not compatible with an oriented phase. This implies that the increase of the shear had induced a transition from a liquid-crystalline to a polymer-type behavior. It is very probable that the appearance of the tilted shape just above the appearance of a stable smectic phase is not by chance but is due to a slowing down of polymer motion at the outskirts of the smectic phase. Therefore, higher shear flow or higher molecular weight should produce a shear induced tran-sition from liquid crystal to polymer behavior inside the
nematic or in a weak smectic phase. The absence of main-chain deformation revealed in previous experiments [3] could be interpreted by relaxation times too short com-pared to the shear applied (a Deborah number ø 1). Fig-ures 5(a) and 5(b) indicate a return back to the ordered smectic state. This shows that the force of the smectic or-der increases (with time, if it is a transitional process and/ or temperature since it is controlled to within 61±C). A rheological behavior implying the rotation of the macro-molecule is no longer possible, and the sliding of smec-tic layers becomes favored. This gives rise to the result shown in Fig. 5(b). The liquid-crystalline (smectic) be-havior becomes predominant again.
We have demonstrated that shear can favor either a polymer or a liquid-crystalline rheological behavior; by applying the shear into the smectic phase, we observe the smectic layer alignment. This is a liquid-crystalline behavior [1]. In contrast, the application of sufficient shear above the nematic-smectic transition, with decreas-ing temperature, produces a tilted elongated main-chain shape. This suggests a typical polymer rheological be-havior [4] and implies a transition from liquid crystalline (nematic) at rest to polymer behavior under shear flow. Then, as the smectic forces become stronger, the poly-mer rotation is replaced by the sliding layers which is the inverse transition, i.e., polymer to liquid crystal (smec-tic) behavior. Finally, our accuracy did not allow us to determine any temperature shift due to the shear. Here the rotational motion of the polymer may have an oppo-site influence compared to the smectic fluctuations which should increase the transition temperature under shear [7]. A cell with an improved temperature resolution would be expected to shed further light on this behavior and the pa-rameters which control it.
We thank S. Lecommandoux and G. Kirsch for the polymer synthesis and G. Pépy for the conception of a two-dimensional data treatment.
[1] C. R. Safinya, E. B. Sirota, and R. J. Plano, Phys. Rev. Lett. 66, 1986 (1991); edited by M. Doi and S. F. Edwards (Oxford University Press, New York, 1986).
[2] R. H. Kannan, J. A. Kornfield, N. Schwenk, and C. Boeffel, Macromolecules 26, 2050 (1993).
[3] L. Noirez and A. Lapp, Phys. Rev. E 53, 1115 (1996). [4] R. Muller, C. Picot, Y. H. Zang, and D. Froelich,
Macro-molecules 23, 2577 (1990).
[5] P. Davidson and A. M. Levelut, Liq. Cryst. 11, 469 (1992); H. G. Ohm, R. G. Kirste, and R. C. Oberthür, Makro-mol. Chem. Theory Simul. 116, 1387 (1988)L. Noirez, P. Davidson, W. Schwarz, and G. Pépy, Liq. Cryst. 16, 1081 (1994).
[6] L. Noirez and A. Lapp, Physica B (Amsterdam) (to be published).
[7] P. C. Hohenberg and B. I. Halperin, Rev. Mod. Phys. 49, 435 (1977); R. F. Bruinsna and C. R. Safinya, Mater. Res. Soc. Symp. Proc. 177, 153 (1990).