HAL Id: hal-03197634
https://hal.archives-ouvertes.fr/hal-03197634
Submitted on 14 Apr 2021
HAL is a multi-disciplinary open access
archive for the deposit and dissemination of
sci-entific research documents, whether they are
pub-lished or not. The documents may come from
teaching and research institutions in France or
abroad, or from public or private research centers.
L’archive ouverte pluridisciplinaire HAL, est
destinée au dépôt et à la diffusion de documents
scientifiques de niveau recherche, publiés ou non,
émanant des établissements d’enseignement et de
recherche français ou étrangers, des laboratoires
publics ou privés.
variation in Mediterranean forest canopy CO2 and water
fluxes through combined in situ measurements and
ecosystem modelling
T. Keenan, R. García, A. Friend, S. Zaehle, C. Gracia, S. Sabate
To cite this version:
T. Keenan, R. García, A. Friend, S. Zaehle, C. Gracia, et al.. Improved understanding of drought
controls on seasonal variation in Mediterranean forest canopy CO2 and water fluxes through combined
in situ measurements and ecosystem modelling. Biogeosciences, European Geosciences Union, 2009,
6 (8), pp.1423-1444. �10.5194/bg-6-1423-2009�. �hal-03197634�
www.biogeosciences.net/6/1423/2009/
© Author(s) 2009. This work is distributed under the Creative Commons Attribution 3.0 License.
Biogeosciences
Improved understanding of drought controls on seasonal variation
in Mediterranean forest canopy CO
2
and water fluxes through
combined in situ measurements and ecosystem modelling
T. Keenan1, R. Garc´ıa2, A. D. Friend3, S. Zaehle2, C. Gracia1,4, and S. Sabate1,4
1CREAF, Autonomous University of Barcelona (UAB), 08139, Bellaterra, Barcelona, Spain 2LSCE, Orme des Merisiers, Gif sur Yvette, Paris, France
3Department of Geography, University of Cambridge, Cambridge CB2 3EN, UK 4Department of Ecology, University of Barcelona (UB), Diagonal 645, 08028, Spain
Received: 6 January 2009 – Published in Biogeosciences Discuss.: 24 February 2009 Revised: 17 July 2009 – Accepted: 22 July 2009 – Published: 5 August 2009
Abstract. Water stress is a defining characteristic of Mediterranean ecosystems, and is likely to become more se-vere in the coming decades. Simulation models are key tools for making predictions, but our current understanding of how soil moisture controls ecosystem functioning is not sufficient to adequately constrain parameterisations.
Canopy-scale flux data from four forest ecosystems with Mediterranean-type climates were used in order to analyse the physiological controls on carbon and water flues through the year. Significant non-stomatal limitations on photo-synthesis were detected, along with lesser changes in the conductance-assimilation relationship. New model parame-terisations were derived and implemented in two contrasting modelling approaches.
The effectiveness of two models, one a dynamic global vegetation model (“ORCHIDEE”), and the other a forest growth model particularly developed for Mediterranean sim-ulations (“GOTILWA+”), was assessed and modelled canopy responses to seasonal changes in soil moisture were analysed in comparison with in situ flux measurements.
In contrast to commonly held assumptions, we find that changing the ratio of conductance to assimilation under nat-ural, seasonally-developing, soil moisture stress is not suffi-cient to reproduce forest canopy CO2and water fluxes.
How-ever, accurate predictions of both CO2and water fluxes under
all soil moisture levels encountered in the field are obtained if photosynthetic capacity is assumed to vary with soil
mois-Correspondence to: T. Keenan
(t.keenan@creaf.uab.es)
ture. This new parameterisation has important consequences for simulated responses of carbon and water fluxes to sea-sonal soil moisture stress, and should greatly improve our ability to anticipate future impacts of climate changes on the functioning of ecosystems in Mediterranean-type climates.
1 Introduction
The Mediterranean region contains a distinctive endemic flora and is characterised by warm wet winters and hot dry summers, with ecosystem functioning dominated by the sea-sonal cycle of water availability (Allen, 2001). Soil water availability is believed to be the main factor limiting vegeta-tion growth in the Mediterranean region, and secular regional changes in temperatures and precipitation are believed to be already inducing changes in these ecosystems (e.g. Jump et al., 2006; Peuelas and Boada, 2003). Climate models predict further increases in temperature in the future, with changes in rainfall patterns (Giorgi et al., 2004; Giorgi, 2006), lead-ing to a decrease in water resources and negative impacts on ecosystem integrity (IPCC 2007, Summary for Policymak-ers).
However, our ability to predict with confidence the im-pacts of changing climate on these ecosystems is poor due to low understanding concerning ecophysiological responses to soil moisture stress, and consequent effects on primary production and the cycling of carbon and water (Loreto and Centritto, 2008). Correctly understanding current, and thus anticipating future land-atmosphere exchanges of water and carbon in the Mediterranean region is essential for predicting
water resource availability and the future functioning of these key ecosystems, which provide services such as the produc-tion of raw materials, sequestraproduc-tion of carbon, and numerous recreational benefits (Schr¨oter et al., 2005).
A thorough assessment of the vulnerability and likely fu-ture status of Mediterranean ecosystems requires the appli-cation of climate-driven, process-based models. Such mod-els must incorporate the relevant ecosystem processes to suc-cessfully simulate the sensitivity of ecosystem functioning to soil moisture stress at all time scales of interest. However, existing models tend to have systematic difficulties in sim-ulating processes in Mediterranean ecosystems. This prob-lem is exemplified by difficulties in reproducing the effects of seasonal droughts on CO2and water fluxes (Krinner et al.,
2005; Morales et al., 2005; Reichstein et al., 2007; Jung et al., 2007), and it seems likely that these deficiencies are at least in part due to the temperate bias in model development activities. This paper directly addresses this situation.
Stomata are key organs in determining the ability of plants to thrive in drought-prone regions. A very large number of approaches to modelling stomatal responses to environ-mental signals has emerged since the seminal work of Jarvis (1976). Perhaps the most widely used approach in modern times is to assume a linear relationship between (leaf- or bulk canopy-level) stomatal conductance, photosynthesis, the leaf surface concentration of CO2, and the relative humidity or
vapour pressure at the leaf surface. This empirical framework is typified by the so-called Ball-Berry (BB) and
Ball-Berry-Leuning (BBL) parameterisations (Ball et al., 1987; Ball-Berry-Leuning
et al., 1995). It has been reported, however, that this empiri-cal model relationship does not hold under conditions of soil moisture stress (Reichstein et al., 2003; Misson et al., 2006). Indeed, stomatal conductance is known to decrease with soil moisture (e.g., Kramer, 1983), where the classical BB-type model does not include this forcing. The effect of water stress on plant photosynthesis and stomatal conductance has been widely studied (e.g., Wilson et al., 2000; Chaves et al., 2002), but there is little consensus as to those processes gov-erning responses over seasonal time-scales (Warren, 2008). The most widely accepted hypothesis for the control on pho-tosynthesis during water-stressed periods is a reduction in the supply of CO2to the carboxylation sites through
stom-atal closure (e.g. Chaves et al., 2002), although studies also indicate a direct water stress effect on photosynthesis (e.g. Colello et al., 1998; Medrano et al., 2002; Reichstien et al., 2002; Rambal et al., 2003; Xu and Baldocchi, 2003).
Studies suggest that stomatal conductance responses to short-term water stress can be effectively included in the BB and BBL (BB-type) models by reducing the ratio of conduc-tance to photosynthesis (Tenhunen et al., 1990; Harley and Tenhunen, 1991; Sala and Tenhunen, 1994). Both models include a conductance level under conditions of zero net pho-tosynthesis, and this level has also been reported to change under water stress (Misson et al., 2004). However, there is substantial evidence that photosynthetic capacity is directly
affected by soil moisture (e.g. Medrano et al., 1997; Parry et al., 2002). Stomatal conductance and photosynthetic activ-ity tend to be closely correlated (e.g., Cowan, 1977; Wong et al., 1979; Hetherington and Woodward, 2003), leading to the suggestion that it is in fact variations in photosyn-thetic activity which determines stomatal aperture in order to maintain biochemically optimal rates of CO2supply (e.g.,
Cowan, 1977; Wong et al., 1979; Flexas and Medrano, 2002; Medrano et al., 2002; Galmes et al., 2005). This has lead to much discussion concerning the relative roles of stomatal and non-stomatal limitations during drought periods (e.g. Jones, 1985; Ni and Pallardy, 1992; Kubiske and Adams, 1993; Wilson et al., 2000), in particular concerning responses at different time scales (e.g., Lawlor, 1995; Tezara et al., 1999; Cornic, 2000; Lawlor and Cornic 2002; Flexas and Medrano 2002).
Changes in non-stomatal limitations to photosynthesis un-der soil moisture stress have been detected (e.g. Wilson et al., 2000; Grassi and Magnani, 2005), which have been hypoth-esised to relate to either changes in photosynthetic capacity (Medrano et al. 1997; Parry et al., 2002), or the conduc-tivity of the mesophyll cell walls to CO2 (e.g., Evans and
von Caemmerer, 1996; Evans and Loreto, 2000; Evans et al., 2004; Terashima et al., 2005, 2006; Warren, 2008). These studies give weight to a number of studies which show that non-stomatal limitations come into play during seasonal soil water stress (e.g., Colello et al., 1998; Xu and Baldocchi, 2003), with many photosynthetic parameters shown to be closely correlated with stomatal conductance (Medrano et al., 2002). However, conflicting results, often depending on the strength and duration of the water stress, have resulted in great uncertainty as to which limitation dominates under natural water-stressed conditions (e.g. Lawlor, 1995; Tezara et al., 1999; Lawlor and Cornic, 2002; Flexas and Medrano, 2002; Grassi and Magnani, 2005; Breda et al., 2006; Galmes et al., 2007; Keenan et al., 2009).
Such limitations in our knowledge of leaf-level responses to seasonal drought, and how to model them, is potentially a large source of error when modelling Mediterranean-type forest ecosystems due to the strength of the seasonal droughts encountered annually in such ecosystems. The canopy re-sponse to drought is important in governing whole-plant abil-ities to thrive under given conditions. Thus the model de-scription of drought responses must be accurate in order to get the inter-species competitive potential right, and hence be able to better predict vegetation change, in particular in dynamic global vegetation models like ORCHIDEE.
In this paper, we address the problem of modelling canopy responses to drought from the pragmatic perspective of de-termining the most straightforward additional parameteri-sation that can accurately reproduce observed seasonal cy-cles of carbon and water fluxes across a range of differ-ent forest ecosystem types. Using observations of CO2and
water fluxes over four different forest ecosystems growing in Mediterranean climates, we investigate the relationships
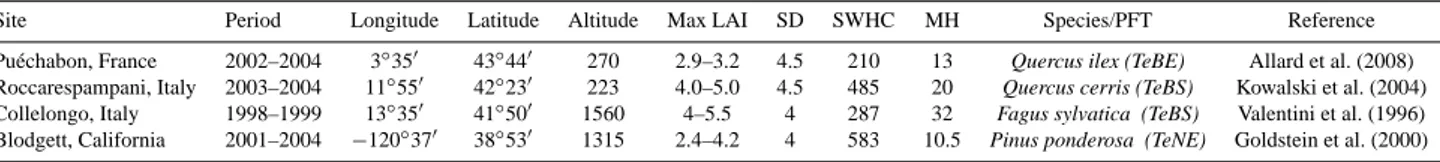
Table 1. Characteristics of the FLUXNET sites chosen. Plant functional types (PFTs) considered are temperate broadleaved evergreen
(TeBE), needleleaved evergreen (TeNE) and broadleaved-summergreen (TeBS). Max LAI – Maximum Leaf Area Index (m2/m2); SD – Soil Depth (m); SWHC – Soil Water Holding Capacity (kg/m2); MH – Measurement Height (m).
Site Period Longitude Latitude Altitude Max LAI SD SWHC MH Species/PFT Reference Pu´echabon, France 2002–2004 3◦350 43◦440 270 2.9–3.2 4.5 210 13 Quercus ilex (TeBE) Allard et al. (2008)
Roccarespampani, Italy 2003–2004 11◦550 42◦230 223 4.0–5.0 4.5 485 20 Quercus cerris (TeBS) Kowalski et al. (2004) Collelongo, Italy 1998–1999 13◦350 41◦500 1560 4–5.5 4 287 32 Fagus sylvatica (TeBS) Valentini et al. (1996) Blodgett, California 2001–2004 −120◦370 38◦530 1315 2.4–4.2 4 583 10.5 Pinus ponderosa (TeNE) Goldstein et al. (2000)
between the observed fluxes and estimated seasonal varia-tions in soil moisture. These data are further analysed to de-termine the relative roles of stomatal and non-stomatal limi-tations to photosynthesis.
The understanding derived from this analysis is then used to adjust two contrasting process-based ecosystem mod-els: GOTILWA+ (Growth Of Trees Is Limited by WA-ter), a detailed biogeochemical forest growth model (Gra-cia et al., 1999; Keenan et al., 2008; http://www.creaf. uab.es/GOTILWA+) developed in the Mediterranean region and therefore expected to adequately account for regional-specific system behaviour, and ORCHIDEE (ORganizing Carbon and Hydrology In Dynamic EcosystEms), a dy-namic global vegetation model (Krinner et al., 2005; http: //ORCHIDEE.ipsl.jussieu.fr), which has been found to per-form poorest in drought-stressed regions (e.g. Jung et al., 2007). Simulations are performed with both models at each of the four sites in order to test the understanding provided by the data analysis.
2 Materials and methods
2.1 FLUXNET site data and data manipulation Measurements of forest ecosystem carbon and water fluxes were obtained from the FLUXNET database (http://www. fluxnet.ornl.gov) for three sites in Mediterranean Europe [Puechabon, in France (Allard et al., 2008); Roccarespam-pani, in Italy (Kowalski et al., 2004); and Collelongo, also in Italy (Valentini et al., 1996)]. The measurement systems in place at these sites were maintained under the CarboEurope-EUROFLUX project. A fourth site at a location with a mediterranean-type climate in California (Blodgett; Gold-stein et al., 2000) was also chosen. The instrumentation at this site was maintained under the AMERIFLUX project. Together, the data used from the four sites amount to a to-tal of eleven measurement years (Table 1), and cover a broad range of phenological types: temperate broadleaf deciduous, temperate needleleaf evergreen, and temperate broadleaf ev-ergreen types, with varying levels of summer drought stress between the different sites. These monospecific forest stands include the species Quercus ilex, Quercus cerris, Fagus
syl-vatica, and Pinus ponderosa. FLUXNET datasets include
measurements of CO2 and water fluxes integrated to
half-hourly time steps (Baldocchi et al., 2001; Friend et al., 2007). We used the level-4 datasets, in which flux separation tech-niques for splitting the observed net carbon fluxes into as-similation and respiration have been employed (Reichstein et al., 2005). The flux-partitioning algorithm used first es-timates the temperature sensitivity from short-term periods, and then applies this short-term temperature sensitivity to ex-trapolate the ecosystem respiration from night- to daytime. This should reduce seasonal bias in partitioning. Gap-filled data were excluded from the analyses.
2.1.1 Interpreting FLUXNET data
In the following sections we describe how we derive soil wa-ter content, bulk canopy conductance, and leaf inwa-ternal car-bon concentrations for the parameterisation of the models and for use in the separation of non-stomatal limitations to photosynthesis during periods of low soil water availability.
Soil moisture. Analysing responses of observed CO2and
wa-ter fluxes to natural changes in soil moisture requires the sea-sonal evolution of soil water content to be known. Surface soil water measurements are often available, but measure-ments of soil water content over the total soil column are either limited, or not made at most sites, and can show a very different inter-seasonal variation than that of the surface soil water content. In the absence of direct continuous measure-ments of total soil water content of the soil column, daily soil moisture content (for the entire soil column up to a site specific soil depth, Table 1) at each site was reconstructed through inverting the evapotranspiration rate (taken to be equivalent to the measured latent heat flux, LHF) and ap-plying this flux to a simple water balance model. This model calculates the balance of the input (precipitation) and out-puts (evapotranspiration (LHF), run-off and below-ground drainage) on a daily basis. The main components of the soil water balance, precipitation and LHF were measured, whilst run-off and sub-surface drainage were estimated as follows. Daily run-off, r, was calculated as a function of the rate of precipitation and soil properties as:
r =0.0001 H G(1 − P or/100)P (1)
where HG is the site specific hydraulic gradient (m m−1), Por (%)is the water porosity of the upper 25cm of soil (estimated
based on a soil organic carbon basis as in Honeysett and Ratkowsky, 1989), and P (mm) is daily precipitation. Daily sub-surface drainage is set to be a constant proportion (1%) of soil water content (calculated as in Gracia et al., 1999, and Honeysett and Ratkowsky, 1989). Deep soil water content profile measurements during the studied periods were avail-able for Puechabon and Collelongo site. Soil water content measurements at Puechabon correspond to the total 4.5m soil depth, whilst measurements at Collelongo correspond to the total soil water content of the first 1m of soil.
Canopy conductance. In order to assess responses of bulk
canopy conductance to water to changes in soil water con-tent, we estimate canopy conductance directly from the mea-sured latent heat flux when conditions are suitable. We as-sume that the bulk canopy stomatal conductance to water vapour (expressed on a ground-area basis) can be estimated from the observed latent heat flux under conditions of a dry canopy surface conditions and negligible evaporation from the soil surface (such conditions are common in a Mediter-ranean climate; Daikoku et al., 2008). Bulk canopy stom-atal conductance to water vapour, Gc, was then estimated
from the measured moisture flux, using simplified form of the Penman-Monteith equation assuming that stomatal and atmospheric transfer occur in series, as:
1/Gc=1/G − 1/Ga (2)
where Gais the aerodynamic conductance from the canopy
to the measurement point. G, the total conductance was esti-mated from the measured latent heat flux as:
1/G = (ρ × Cp/γ ) × ([e∗(Tc) − ezR]/(λ × ε × LH )) (3)
where e∗(TC) is the saturation vapour pressure at canopy
temperature (TC), ezRis the ambient vapour pressure at flux
measurement reference height z, γ is the psychometric con-stant, λ is the latent heat of vaporization, ρ is the density of moist air at ambient temperature, CP is the volumetric heat
capacity of moist air at constant pressure, ε is the coefficient for the conversion of latent heat to its water equivalent (giv-ing actual evapotranspiration, Ea). Canopy temperature, TC
was solved from the measured sensible heat flux using the drag law parameterization and the Monin-Obukhov similar-ity relations for the dependence of the heat flux on the bulk Richardson number (Deardoff, 1967; Hansen et al., 1983). See Friend and Kiang (2005) for more details of the calcula-tions used.
Boundary conductance between the canopy and the point of measurement was calculated as:
1/Ga= (4)
1/Ge+1/Gb = k2×u(z)/ ln2[(z − d)/z0] +B−1/u∗
where Geis the aerodynamic conductance between the
mea-surement height and the canopy surface. z is the height at
which the energy balance measurements were made (see Ta-ble 1), z0 is the surface roughness length, assumed
propor-tional to the stand height, h, d is the zero plane displacement (estimated as d = z − z0∗exp(U × k/u∗)), and k is von
Karman’s constant. U (z) is the measured wind speed at mea-surement height z. Gb is the excess leaf boundary layer con-ductance, B−1is the dimensionless Stanton number (Owen and Thompson, 1963; but see Qualls and Hopson, 1998). u∗ is the friction velocity.
2.1.2 Deriving relationships between bulk canopy con-ductance, canopy photosynthesis, and soil mois-ture stress
Bulk canopy conductance models and soil moisture stress.
Ball et al. (1987) proposed an empirical stomatal model (BB model) in which stomatal conductance was expressed as a linear function of the leaf photosynthetic rate, relative hu-midity at the leaf surface, and the leaf surface CO2
concen-tration, under conditions of ample water supply (Ball et al., 1987). This model was later modified by Ray Leuning (BBL model) to use the photorespiratory compensation point and vapour pressure deficit in place of relative humidity (Leun-ing, 1995). This BB-type leaf level model has been applied at the canopy scale through the use of bulk canopy level vari-ables (Leuning et al., 1995):
Gc=Gs0+(m × An)/((Ca−0∗) × (1 + (vpd/D0))) (5)
where Gs0 is the value of Gc at the light compensation
point (µmol m−2s−1), An is the rate of net photosynthesis
(µmol m−2s−1), C
ais the atmospheric concentration of CO2
at the canopy surface (µmol mol−1), 0∗is the
photorespira-tory compensation point (µmol mol−1), D
0(1.5, unitless) is
an empirical coefficient that describes the sensitivity of con-ductance to vpd, and m is an empirical parameter (unitless).
Soil moisture stress has been added to BB-type conduc-tance models through changes in m, and Gs0. We looked for
possible changes in these parameters using diurnal cycles of net photosynthesis, Ca, vpd, and canopy temperature which
were derived from the data under wet and dry conditions. Given Gc, (from Eq. 2) for each cycle, An/((Ca−0∗)×(1 +
(vpd/D0)))was calculated and regressed against estimated
Gcusing Eq. (5). The resulting linear regression allowed for
the estimation of the m and Gs0parameters for each diurnal
cycle. This was performed for each site using data selected as outlined in Sect. 2.1.3. These values were calculated at different soil water levels to assess possible responses to soil water availability.
Non-stomatal conductance-related limitations of photosyn-thesis due to soil water stress. Non-stomatal limitations can
be identified by simply comparing rates of photosynthesis under similar leaf Ci concentrations, over a soil water
gra-dient. Data relating to a restricted range of leaf Ci
temperature (<25◦C) was used. Any differences in rates of
assimilation under these otherwise non-limiting conditions could then be attributed to non-stomatal soil water effects, rather than changes in the rate of supply of CO2to the
in-tercellular spaces, light limitation, or any high temperature effects.
We further analysed the canopy physiological response to soil moisture deficit by estimating the relationship between mesophyll CO2 concentrations and net photosynthsis. Ci
was calculated assuming equilibrium flux of CO2. Ci,
cal-culated in this way, allows a first-order canopy-level assess-ment of the contribution of stomatal vs. non-stomatal lim-itatins to photosynthesis under soil moisture stress. Radi-ation and temperature are available from FLUXNET mea-surements. Canopy bulk leaf intercellular CO2concentration
(Ci) can be calculated using the estimated bulk canopy
con-ductance to carbon, GcCO2(=Gc/1.6), rates of net
photosyn-thesis derived from the eddy-covariance measurements, and atmospheric CO2 concentrations using a simple supply and
demand function:
Ci =Ca−(An/GcCO2) (6)
2.1.3 Data selection
All analysed FLUXNET data were first screened to remove night-time values. Only daytime values were considered by selecting data corresponding to half-hours with mean short-wave radiation of 200 W m−2 or greater, and assimilation
rates of 2 µmol CO2mground−2s−1. Screening was also
per-formed to remove data points measured during, or within 2 days following, precipitation events, and extreme tempera-tures (below 5◦or above 35◦). Gap filled data was not con-sidered. This reduced the variability in the calculated vari-ables and allowed for a clearer identification of responses due to soil water stress.
Golden days. For model-data comparisons, we focus on days with “good” and stable climatic conditions during the growing period at each site, contrasting both wet and dry periods. Theoretically, for Golden days, the variability in model performance should not be confounded by daily vari-ability in environmental conditions, and the statistical analy-sis of model performance made easier. Such “Golden days” are defined as days with no precipitation, midday radiation greater than 400 W m−2, frictional velocity of greater than
0.15 m s−1, and fully developed canopy leaf area index. Days
with gaps in any data were excluded. 2.2 Ecosystem models
2.2.1 GOTILWA+
GOTILWA+ (Growth Of Trees Is Limited by WAter), (Gra-cia et al., 1999; Keenan et al., 2008; www.creaf.uab.es/ GOTILWA+) is a process-based forest growth model that
has been developed in the Mediterranean region to simu-late tree growth and to explore how it is influenced by wa-ter stress, climate, tree stand structure, management tech-niques, soil properties, and climate (including CO2) change.
GOTILWA+ simulates carbon and water fluxes within forests in different environments, for different tree species, and un-der changing environmental conditions, either due to climate or to management regimes.
The model treats monospecific stands which can be even-or uneven-aged. Individual trees are aggregated into 50 DBH (Diameter at Breast Height) classes and calculations are per-formed for each class. Hourly ecosystem carbon and water fluxes are estimated using meteorological forcing.
GOTILWA+ includes a two-layer canopy photosynthetic model (Wang and Leuning, 1998), coupled to a carbon allo-cation and growth model and a soil respiration and hydrol-ogy model. Each canopy layer is divided into fractions of sunlit (when direct radiation is present) and shaded leaves, with intercepted radiation depending on the time of the day, and the area of leaf exposed to the sun based on leaf an-gle and the canopy’s ellipsoidal leaf distribution. Assimi-lation rates for sunlight and shaded leaves are calculated us-ing the approach of von Caemmerer and Farquhar (1981), with dependencies on intercepted direct and diffuse radia-tion, species-specific photosynthetic capacities, leaf temper-ature, and the concentration of CO2within the leaf air spaces.
Stomatal conductance is calculated using the BBL model, on a leaf temperature basis. Rates of photosynthesis are de-pendent on the rate of carboxylation and the proportional rate of electron transport. The canopy average (over space and time) maximum RuBP (ribulose-1,5-bisphosphate) sat-urated rate of carboxylation, V cmax, and the maximum rate
of electron transport, Jmax, were calculated following
Far-quhar et al. (1980) and de Pury and FarFar-quhar (1997). Due to model specific differences in light and temperature distri-bution within the canopy, V cmaxand Jmaxneed to be
cali-brated for site specific applications. Here we they were cal-ibrated using the diurnal cycles of observed canopy carbon fluxes for the wet Golden day periods (see below for a de-scription of Golden days) at each site (V cmax: 35, 50, 55,
and 40 µmol, m−2,s−1, Jmax= V cmax/2 for Puchabon,
Blod-gett, Collelongo and Roccarespampani respectively). Other photosynthetic parameters were taken from Bernacchi et al. (2001). Other model parameters were set to either site specific (when available) or species specific parameters, as in Gracia et al. (1999).
Each tree cohort is represented by three carbon com-partments, leaf, sapwood, and fine roots. Available mo-bile carbon is allocated to each, and maintenance respira-tion of each compartment is calculated as a funcrespira-tion of tem-perature. Fine litter fall (i.e. leaves), gross litter fall (i.e. bark, branches) and the mortality of fine roots add to the soil organic carbon content. The soil in GOTILWA+ is di-vided vertically into two layers, an upper organic layer, and a lower mineral layer, with a fixed rate of transfer of soil
organic carbon between them. Soil water processes are de-scribed in Sect. 2.1.1.
2.2.2 ORCHIDEE
ORCHIDEE is a process-based terrestrial biosphere model that simulates terrestrial vegetation and soil energy, water, and carbon fluxes (Krinner et al., 2005). Changes in vegeta-tion structure and distribuvegeta-tion in response to environmental forcings are also simulated.
ORCHIDEE consists of three major components: (a) SECHIBA, which calculates the exchanges of energy and water between the atmosphere and the land surface; (b) STOMATE, which simulates photosynthesis, carbon alloca-tion, litter decomposialloca-tion, soil carbon dynamics, and mainte-nance and growth respiration and (c) the LPJ dynamic vege-tation model (Sitch et al., 2003), which simulates long-term changes in the composition and structure of vegetation result-ing from saplresult-ing establishment, competition for light, and tree mortality. Energy, water, and carbon fluxes resulting from photosynthesis and autotrophic and heterotrophic res-piration are calculated on a half-hourly basis, whereas plant growth, phenology, and vegetation structure occur on a daily timestep.
Plants in ORCHIDEE used in this study are divided into the following functional types, each with different phenolog-ical, physiologphenolog-ical, and morphological characteristics: tem-perate needleleaved evergreen, temtem-perate broadleaved ever-green, temperate broadleaved deciduous, and C3herbaceous
types. In contrast to GOTILWA+, vegetation is represented as an average individual plant, with no accounting for size-distribution.
ORCHIDEE simulates photosynthesis for both C3
(us-ing the method of Farquhar et al., 1980) and C4 (using
the method of Collatz et al., 1992) photosynthetic path-ways, with stomatal conductance calculated using the BB model. For model parameterisations, plant functional types (PFT) (Table 1) parameters were used, taken from Krinner et al. (2005). Prior studies of model optimization against eddy covariance data have shown that the maximum rate of car-boxylation in the ORCHIDEE model potentially was under-estimated for some PFTs (Santaren et al., 2007). The canopy average maximum rate of carboxylation was increased be-tween 25–40% (to 70, 75, 50, and 40 µmol, m−2,s−1 for
Pu´echabon, Blodgett, Collelongo and Roccarespampani re-spectively) from the original parameter values (Krinner et al., 2005) to calibrate ORCHIDEE to meet the observed canopy average fluxes during the selected Golden days (see descrip-tion of Golden days below). Soil water content is treated within two layers, with inputs from precipitation less canopy interception loss, and outputs to sub-surface drainage, run-off, soil evaporation, and transpiration. Further model pa-rameters were taken from Krinner et al. (2005).
2.2.3 Accounting for soil water stress in coupled photosynthesis-conductance models
Two different approaches are frequently used to incorporate the effect of drought stress on the (Farquhar – BB-type) cou-pled conductance-assimilation model. Tenhunen et al. (1990) originally proposed the application of stomatal limitations under soil moisture stress through applying changes in the slope m of the coupled Farquhar – BB-type model during water stressed periods. This method decreases the empir-ical scaling coefficient m, with moisture stress, leading to reduced conductance and therefore reduced internal CO2
available for assimilation. Changing the slope during wa-ter stressed periods has since been commonly adopted, and was the methodology for water stress response applied in the GOTILWA+ model. In GOTILWA+, stomata responded to drought stress through the application of a linear scalar of soil moisture, as:
Gs =Gs0+((Wf acstoma×m) × (An−Rd))/ (7)
((Ca−0∗) × (1 + (vpd/D0)))
where Wfacstomais a soil moisture-dependent scalar with
val-ues between 0 and 1.
The effect of drought stress on the coupled photosynthesis-conductance model (of Farquhar – BB-type) can be im-plemented through changes in non-stomatal limitations, by reducing photosynthetic potential through the application of a scalar to both the maximum RuBP (ribulose-1,5-bisphosphate) saturated rate of carboxylation, V cmax, and the
maximum rate of electron transport, Jmax, as follows:
V cmax0 =V cmax × Wf acphoto,
Jmax0 =Jmax × Wf acphoto (8)
Where Wfacphotois a soil moisture-dependent scalar with
values between 0 and 1. This causes stomatal closure as An
is reduced in Eqn. (5). The ORCHIDEE model applied a linear scalar in this manner to directly reduce photosynthesis during water stress.
The two approaches were tested in both models, thus avoiding the potential for any model specific biases in results. We used the flux data analysis outlined above to test three hypotheses concerning the responses of canopy net photo-synthesis and evapotranspiration to seasonally varying soil moisture supply: 1) directly reducing stomatal conductance by modifying the slope, m, within the BB or BBL model is sufficient to explain observed responses, 2) directly reducing
Jmaxand V cmaxand hence net photosynthesis within the BB
or BBL models is sufficient to explain observed responses, and 3) the simultaneous application of both stomatal and non-stomatal limitations is necessary to capture the timing and extent of the water stress induced decrease in CO2and
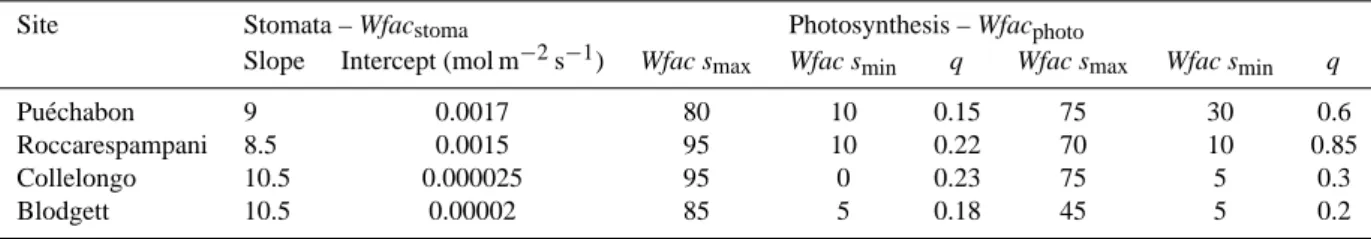
Table 2. Parameters for the calculation of stomatal conductance, and water stress parameters applied to stomatal conductance (Fig. 3) and
photosynthetic potential (Fig. 4) for each site. Wfac smax, and Wfac sminare given in % of maximum soil water holding capacity.
Site Stomata – Wfacstoma Photosynthesis – Wfacphoto
Slope Intercept (mol m−2s−1) Wfac smax Wfac smin q Wfac smax Wfac smin q
Pu´echabon 9 0.0017 80 10 0.15 75 30 0.6 Roccarespampani 8.5 0.0015 95 10 0.22 70 10 0.85 Collelongo 10.5 0.000025 95 0 0.23 75 5 0.3 Blodgett 10.5 0.00002 85 5 0.18 45 5 0.2
To test the different hypothesis, we parameterised the re-duction scalars already in use in both GOTILWA+ and OR-CHIDEE from the data for both changes in the slope param-eter, m, Wfacstomaand non-stomatal related changes in
pho-tosynthesis Wfacphoto. These scalars have the form:
Wfac = ( 1, if S(t) ≥ Smax h s(t )−smin smax−smin iq , if S(t) < Smax (9)
where q is a measure of the non-linearity of the effects of soil water stress on physiological processes, smaxthe soil water
content at which reductions are first evident, and sminis the
wilting point, expressed as percentages of maximum soil wa-ter holding capacity. These two scalars were paramewa-terised independently for each site and were then applied separately in both GOTILWA+ and ORCHIDEE.
2.2.4 Modelling protocol, hypothesis testing, and model evaluation
Simulations of CO2and water fluxes with each model were
run separately for the time periods outlined in Table 1 at each of the four sites to evaluate the models and test the outlined hypothesis. For each model and site, 4 runs were made with: 1) with the model’s original water stress response parame-terisations, 2) the application of the modified stomatal limi-tations (Wfacstoma, Table 2), 3) the application of the modi-fied non-stomatal limitation (Wfacphoto, Table 2), and 4) the application of both the modified stomatal and non-stomatal limitations together.
To assess the different hypothesis for modeling soil wa-ter stress responses using Golden days, we ran simulations with the soil water content at each time step set to the re-constructed soil water content for the corresponding day. This enabled the evaluation of the canopy physiological pro-cess descriptions independent of potential inaccuracies in the modelled latent heat fluxes, which would confound any model-data comparison. This decoupling of the simula-tion of soil and canopy processes was achieved by remov-ing the water volume equivalent of the observed latent heat flux at each time step instead of the simulated evapotranspi-ration Thus, in simulations with forced soil water content
the modelled photosynthesis and conductance were calcu-lated as functions of the reconstructed soil water, and any under- or over-estimations of evapotranspiration did not af-fect the soil water content and thus did not propagate into the next time step. In simulations comparing the two models, GOTILWA+ and ORCHIDEE (presented in Figs. 6, 7), the constraint of a forced soil water content was removed, and a full bi-directional feedback between the soil and the canopy was considered.
Both models were forced with the same half-hourly mete-orological variables (temperature, precipitation, vapour pres-sure deficit, wind speed, global radiation, and atmospheric CO2 concentration), which were taken from site
observa-tions, and site conditions including soil characteristics and hydrological parameters (Table 1). The site specific con-ductance parameters, m and Gs0 were calculated from the
data (m and Gs0 were the same for both GOTILWA+ and
ORCHIDEE) for each site (Table 2). In addition to the above site-level parameters required by the two models, GOTILWA+ used descriptions of stand characteristics (in-cluding the structure of the canopy and the DBH class distri-bution), and also a number of tree physiological parameters (biomass allocations and compartment specific growth and maintenance respiration rates).
GOTILWA+ simulations of CO2and water fluxes at each
site were initialised by specifying forest structure variables specific to the first year of simulation at each site, with data obtained from the literature. ORCHIDEE simulations were initialised by prescribing the fractional cover of each plant functional type for each site.
Statistics. The hypotheses were evaluated using the
correla-tion coefficient r2, the Root Mean Squared Error (RMSE), and the statistic Model Efficiency (MEF). The modelling efficiency statistic (MEF) is similar to r2, which is inter-preted as the proportion of variation explained by the fit-ted line whereas the MEF statistic is the proportion of variation explained by the line Y = f(X1, ..., Xp). This statis-tic has been extensively used in hydrology models (Byers et al., 1989, Loague and Green, 1991 and Zacharias et al., 1996), but has also been used in biological models. It is re-lated to the RMSE according to: MEF = 1-RMSE2/s2where s2is the variance of the observations. A value near one (the
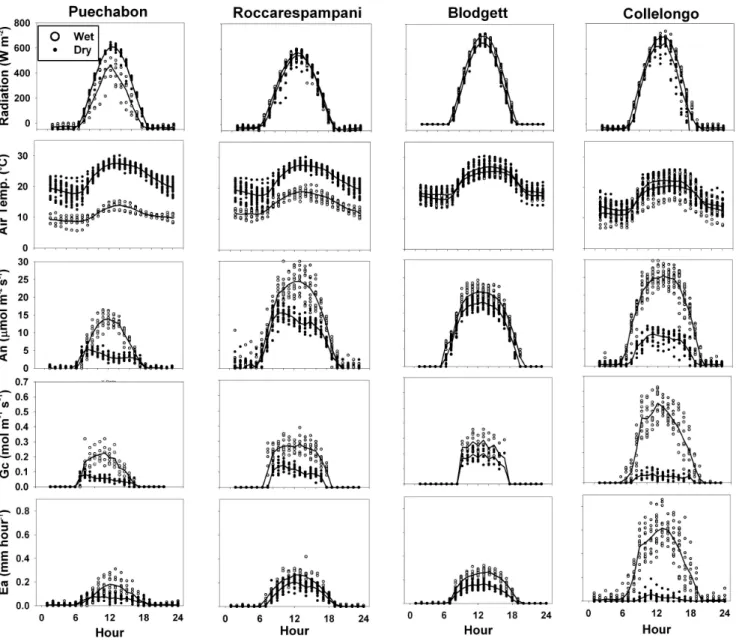
Fig. 1. Hourly meteorological conditions (Radiation, air temperature), flux data (Assimilation – An, actual evapotranspiration – Ea), and estimated Canopy bulk conductance (Gc) at each site day for the well-watered (Wet) and drought (Dry) Golden day periods. Solid lines represent the average diurnal cycle for each period.
upper bound) indicates a close match between observations and model predictions. A value of zero indicates that the model predicts individual observations no better than if it al-ways predicted the average of the observations. Values less than zero indicate that the observation average would be a better predictor than the model results. The MEF statistic is more sensitive than r2to systematic deviations and is a use-ful additional tool in the assessment of goodness of fit (Mayer and Butler, 1993).
3 Results
3.1 Primary fluxes
All sites showed typical Mediterranean-type climate evolu-tion during the studied years, including an extended sum-mer drought. Strong seasonal patterns were observed with reduced photosynthesis and evapotranspiration during peak summer periods (Fig. 1), in contrast to higher fluxes during late spring. This seasonality was particularly noticeable at Puechabon, Collelongo, and Roccarespampani, and less so at the Blodgett site.
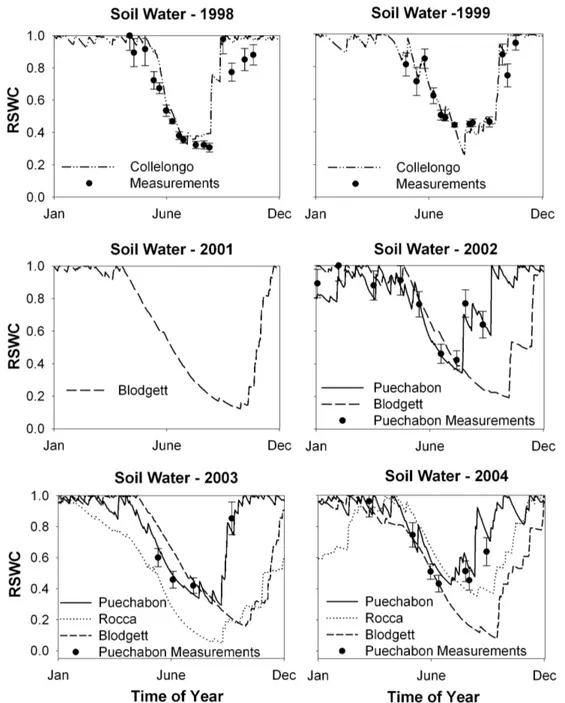
Fig. 2. Reconstructed daily relative soil water content (RSWC – total soil water in the soil column relative to the maximum soil water holding
capacity) for the simulated periods at each of the studied sites, separated by year. Data represent soil water measurements at Puechabon (over the total 4.5 m soil profile) and Collelongo (for the top 1 m of soil).
3.2 Data analysis results
Soil Water Content. Figure 2 shows the evolution of
esti-mated relative soil water content (RSWC – total soil water in the soil column divided by the soil water holding capac-ity) for each simulated site and year, derived by inverting the observed latent heat fluxes as described in Sect. 2.1.1. At each site, the soil water content stays high throughout spring, being regularly recharged by precipitation events to compen-sate for any losses from evapotranspiration. The effect of the
dry summers can be seen through strong decreases in the soil water content. Soil water levels generally return to maximum values during autumn, and remain relatively stable through winter. The Blodgett soil water content shows little inter-annual variability due to the lack of inter-inter-annual variability in its climate during the studied period. In contrast, at Puech-abon annual summer soil water varies over a large range, with levels reaching a prolonged low during 2003 due to the strong drought experienced in that year. This dry summer period is also reflected at the Roccarespampani site, with soil water
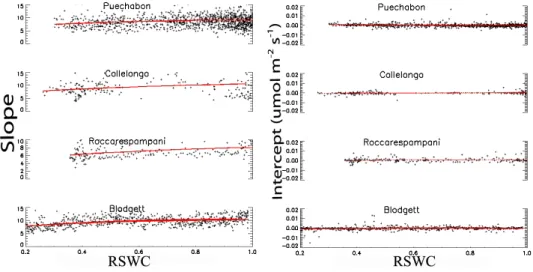
Fig. 3. (Left): Changes in the slope parameter, m, of Eq. 5, (the empirical species specific factor that specifies the baseline ratio between
conductance and net photosynthesis) with relative daily soil water content (RSWC – total soil water in the soil column relative to the maximum soil water holding capacity) for each site, calculated using mid-day values. Regression lines represent the functions (Wfacstoma)
applied in the models; (Right): Intercept parameter (Residual of Eq. 5), at each site, as a function of the RSWC.
levels in 2003 falling below 50% of those in 2004. Soil water measurements are available for Puechabon and Collelongo, and compare well to the reconstructed values (Fig. 1). Both the timing and extent of the soil water drop in summer were accurately captured at each site and year. At Collelongo, the reconstruction slightly overestimated the autumn soil water content in 1998. We are not aware of similar data for the other sites.
Reductions of photosynthesis and conductance due to soil water stress. The estimates of soil water content shown in
Fig. 2 are used with the observed flux data to determine whether the m parameter in the BB-type models of canopy conductance, non-stomatal limitations, or both vary signifi-cantly with soil moisture. Values for the slope and intercept of the BBL conductance model at high soil water content for each site are given in Table 2. These values were calcu-lated separately for both the BB and BBL canopy conduc-tance model formulations, and were found to be independent of the choice of conductance model.
The fitted empirical parameter in the BB-type model, m, did not change notably during the slow onset of soil water stress at the beginning of each summer, and then declined only slightly at very low soil water levels (<30% relative soil water) (Fig. 3a). The fitted intercept in Eq. 5 did not change with decreases in available soil water at any of the sites (Fig. 3b).
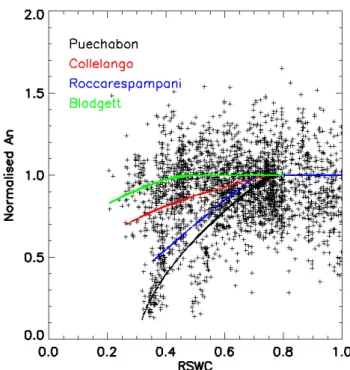
In contrast to the lack of major changes in the BB and BBL model parameters, strong non-stomatal limitations to photosynthesis were found under conditions of soil mois-ture stress at all sites (Fig. 4). The point at which limita-tions were first encountered was site dependent and between 50% and 80% RSWC Although inferred soil water in our
re-construction falls quite low in Blodgett, this did not lead to decreases of the extent observed at the other sites in either CO2or water fluxes during the summer period (only slight
water stress), suggesting either root access to deep ground water not simulated by our reconstruction, or an underesti-mation of soil water capacity. At the other three sites, fluxes declined with site-dependent intensities. Roccarespampani showed the strongest decline in fluxes, followed by Puech-abon and then Collelongo. The fitted Wfacphoto functions
shown in Eq. 8 are given in Fig. 4, with parameters given in Table 2.
3.3 Modelled diurnal cycle and hypothesis testing
Evaluation of the stomatal vs. non-stomatal limitation hy-potheses using process-based models and flux data. The
abil-ity of the alternative hypotheses outlined above to simulate canopy responses to soil moisture stress is tested by incorpo-rating the fitted empirical relationships shown in Figs. 3 and 4 into the framework of the two process-based models. The simulation of the Golden day diurnal courses of CO2and
wa-ter fluxes during periods of high wawa-ter availability was very accurate for all model combinations (three hypotheses im-plemented separately in two models) (Fig. 5a1, a2, b1, b2).
As expected, simulated fluxes during high water availability were relatively unaffected by the modelling approach cho-sen, due to the fact that the approaches only differ in their treatment of responses to water stress. Conversely, responses to water stress were highly dependent on the chosen response description.
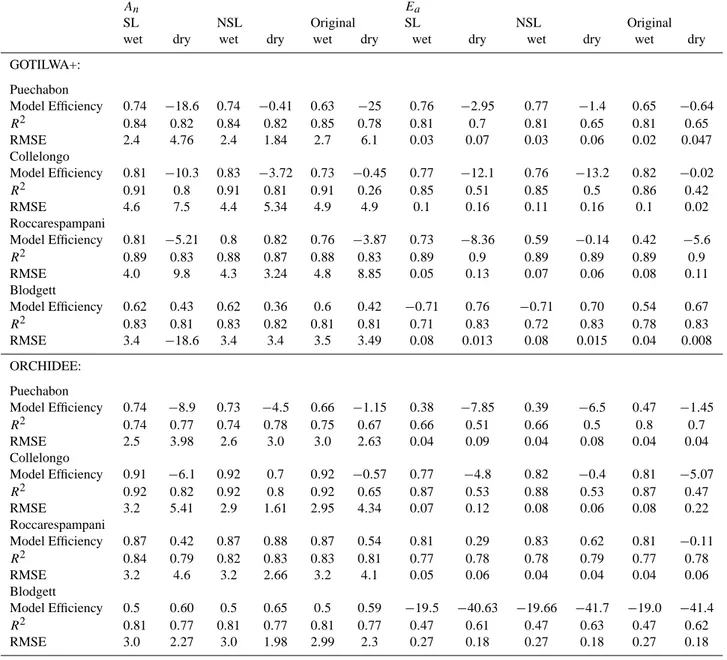
Table 3. Statistics for the comparison of each model (GOTILWA+ and ORCHIDEE) and approach (Stomatal vs. Non-Stomatal restrictions)
with FLUXNET data at each site, for assimilation (An) and actual evapotranspiration (Ea) during wet and dry period Golden days, with soil water in both models prescribed (SL – Applying stomatal limitations only, NSL – Applying Non-stomatal restrictions, Original – Original models).
An Ea
SL NSL Original SL NSL Original
wet dry wet dry wet dry wet dry wet dry wet dry GOTILWA+: Puechabon Model Efficiency 0.74 −18.6 0.74 −0.41 0.63 −25 0.76 −2.95 0.77 −1.4 0.65 −0.64 R2 0.84 0.82 0.84 0.82 0.85 0.78 0.81 0.7 0.81 0.65 0.81 0.65 RMSE 2.4 4.76 2.4 1.84 2.7 6.1 0.03 0.07 0.03 0.06 0.02 0.047 Collelongo Model Efficiency 0.81 −10.3 0.83 −3.72 0.73 −0.45 0.77 −12.1 0.76 −13.2 0.82 −0.02 R2 0.91 0.8 0.91 0.81 0.91 0.26 0.85 0.51 0.85 0.5 0.86 0.42 RMSE 4.6 7.5 4.4 5.34 4.9 4.9 0.1 0.16 0.11 0.16 0.1 0.02 Roccarespampani Model Efficiency 0.81 −5.21 0.8 0.82 0.76 −3.87 0.73 −8.36 0.59 −0.14 0.42 −5.6 R2 0.89 0.83 0.88 0.87 0.88 0.83 0.89 0.9 0.89 0.89 0.89 0.9 RMSE 4.0 9.8 4.3 3.24 4.8 8.85 0.05 0.13 0.07 0.06 0.08 0.11 Blodgett Model Efficiency 0.62 0.43 0.62 0.36 0.6 0.42 −0.71 0.76 −0.71 0.70 0.54 0.67 R2 0.83 0.81 0.83 0.82 0.81 0.81 0.71 0.83 0.72 0.83 0.78 0.83 RMSE 3.4 −18.6 3.4 3.4 3.5 3.49 0.08 0.013 0.08 0.015 0.04 0.008 ORCHIDEE: Puechabon Model Efficiency 0.74 −8.9 0.73 −4.5 0.66 −1.15 0.38 −7.85 0.39 −6.5 0.47 −1.45 R2 0.74 0.77 0.74 0.78 0.75 0.67 0.66 0.51 0.66 0.5 0.8 0.7 RMSE 2.5 3.98 2.6 3.0 3.0 2.63 0.04 0.09 0.04 0.08 0.04 0.04 Collelongo Model Efficiency 0.91 −6.1 0.92 0.7 0.92 −0.57 0.77 −4.8 0.82 −0.4 0.81 −5.07 R2 0.92 0.82 0.92 0.8 0.92 0.65 0.87 0.53 0.88 0.53 0.87 0.47 RMSE 3.2 5.41 2.9 1.61 2.95 4.34 0.07 0.12 0.08 0.06 0.08 0.22 Roccarespampani Model Efficiency 0.87 0.42 0.87 0.88 0.87 0.54 0.81 0.29 0.83 0.62 0.81 −0.11 R2 0.84 0.79 0.82 0.83 0.83 0.81 0.77 0.78 0.78 0.79 0.77 0.78 RMSE 3.2 4.6 3.2 2.66 3.2 4.1 0.05 0.06 0.04 0.04 0.04 0.06 Blodgett Model Efficiency 0.5 0.60 0.5 0.65 0.5 0.59 −19.5 −40.63 −19.66 −41.7 −19.0 −41.4 R2 0.81 0.77 0.81 0.77 0.81 0.77 0.47 0.61 0.47 0.63 0.47 0.62 RMSE 3.0 2.27 3.0 1.98 2.99 2.3 0.27 0.18 0.27 0.18 0.27 0.18
The shape of the diurnal cycle during dry periods, shown for the Roccarespampani site (Fig. 5), is relatively insen-sitive to the chosen soil moisture limitation approach for each process-based model system, demonstrated by a com-parable r2. However, the different approaches gave marked differences in the root mean squared error (RMSE) and in the model efficiency (MEF). Applying the calculated water stress functions presented in Table 2, to V cmax, and Jmax
led to an 80% reduction in the RMSE for assimilated carbon using the GOTILWA+ model, and 47% in the case of
OR-CHIDEE, when compared to the original model parameteri-sations. Applying the water stress functions solely to stom-atal control produced a marked increase (13% GOTILWA+; 9%, ORCHIDEE, Table 3) in the RMSE, compared to the original model parameterisations, and was the only approach to give a negative average MEF.
The same relative performance of the different hypothe-ses was observed at all sites, with marked improvements in the accuracy of simulations of the diurnal cycle of both net photosynthesis and evapotranspiration under drought stress
Fig. 4. Non-stomatal limitations to normalised net assimilation, An, as a function of relative soil water content (total soil water in the soil column relative to the maximum soil water holding capacity), calculated at each site individually (Using Anover restricted ranges of leaf Ciconcentrations (220<Ci<300), radiation (>250 W m−2), and temperature (<25◦C)), (Parameters of the adjusted functions in Table 2). Anwas normalized to the observed average assimilation rate under well watered conditions (>0.8 Relative soil water hold-ing capacity).
when photosynthetic capacity was reduced using Eq. (8). Remarkably, no direct effect of soil moisture on stomatal conductance was necessary to successfully reproduce the re-sponse of evapotranspiration to water stress, i.e. both the BBL and BB models were sufficient for this purpose. Con-versely, the application of restrictions to only stomatal con-ductance led to photosynthesis being overestimated under drought stress (by an average of 47% in Puechabon, 55% in Roccarespampani, 34% in Collelongo, and 8% in Blodgett, of monthly net photosynthesis values during water stressed months) (Table 3). Applying a stronger stomatal conduc-tance restriction than that calculated from the data allowed for the effective simulation of stomatal conductance, but the lowered conductance was not sufficient to decrease assimila-tion rates.
We also tested the effects of applying the calibrated func-tions to both conductance and assimilation (Eqs. 4 and 5), thus applying stomatal and non-stomatal limitations together. This gave no improvement in the modelled carbon and wa-ter fluxes when compared to simulations applying just non-stomatal limitations to photosynthesis, suggesting that hy-pothesis two is correct.
3.4 Simulation of diurnal and seasonal fluxes with GOTILWA+ and ORCHIDEE
To evaluate the capacity of the two models to reproduce the Observed diurnal and seasonal fluxes following updat-ing with the best fittupdat-ing empirical model of soil moisture effects (i.e. non-stomatal limitations only), we repeated the hourly simulations of CO2and water fluxes for all years
(Ta-ble 1) for each site with soil water content calculated from the model simulation itself (Figs. 6, 7).
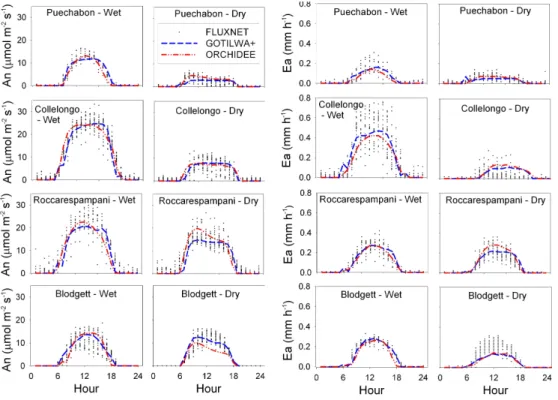
Simulation of diurnal fluxes.
For well-watered Golden days at Puechabon, both mod-els accurately reproduced the shape of the diurnal time courses of CO2and water fluxes, with ORCHIDEE
perform-ing slightly better (Fig. 6, Table 4). Under dry conditions at Puechabon, both models responded accurately to drought (Table 4).
CO2and water fluxes were accurately modelled by both
models in Collelongo (Table 4). Both models were capa-ble of simulating net photosynthesis to a very high degree of accuracy in both wet and dry conditions (Table 4). Water fluxes proved more difficult, with both models encountering the same problems, underestimating actual evapotranspira-tion during wet periods and overestimating in dry periods.
At Roccarespampani (Fig. 6), both models accurately re-produced CO2and moisture fluxes (Table 4). The diurnal
cy-cle of CO2fluxes at Blodgett was well captured by both
mod-els (Table 4, Fig. 6). ORCHIDEE correctly calculated the rate of photosynthesis and conductance in wet conditions, as did GOTILWA+. In dry conditions GOTILWA+ accurately modelled assimilation rates, but both models had difficulties in calculating the quantity of water transpired, giving much lower evapotranspiration rates than those observed.
It is worth noting that, statistically (Table 4), both models simulate the diurnal cycle of assimilated carbon as well under water stressed conditions as they do in wet conditions when including the new water stress functions.
Seasonal cycles and inter-annual variations
Finally, the ORCHIDEE and GOTILWA+ simulations (the same diurnal simulations shown in Fig. 6) for each site and the entire time series are compared to the observations in Fig. 7. The eleven site-years cover a wide range of inter-annual and inter-site variability in climatic forcings, and thus varying levels of drought. The effect of drought on simu-lated photosynthesis and conductance, which is characterised by a sharp decline in fluxes in otherwise optimal conditions, is most obvious at Puechabon in all years, at Collelongo in 1998, and at Roccarespampani in 2003.
For Puechabon, both models were capable of accurately predicting photosynthesis in non-water stressed conditions. The timing of the onset of summer reductions in both CO2
and water fluxes was also well captured in each year. The magnitude of summer reductions in CO2 and water fluxes
Fig. 5. Golden day diurnal courses for the observed hourly photosynthesis (An, in umol m−2s−1) and actual evapotranspiration (Ea, in mm h−1), and average modelled (a: GOTILWA+, b: ORCHIDEE) values for the same Golden days, for the Roccarespampani site, using 3 different modelling approaches, with the soil water content prescribed in each: 1) Applying the factors to stomatal conductance only. 2) Applying the factors to Photosynthetic potential only, and 3) Applying the original parameterisations. Wet and dry Golden day periods are compared. Error bars represent the standard deviation from the mean. Golden day periods for Roccarespampani: 2004, 17 May–1 June (wet), 19 August–8th September (dry)
Fig. 6. Diurnal cycles of observed photosynthesis (An, in µmol m−2s−1) and actual evapotranspiration (Ea in mm h−1), and average modelled values for the same Golden days for both GOTILWA+ and ORCHIDEE at all sites for both wet and dry Golden day periods (with dynamic soil water). Golden day periods for each site: Puechabon 2002, 22 May to 4 June (wet), 19 August–17 September (dry); Collelongo 1998, 16 June–4 July (wet), 11–29 August (dry); Roccarespampani 2004, 17 May–1 June (wet), 19 August–8 September (dry); Blodgett 2002, 13 April–1st May (wet), 4–17 July (dry).
Fig. 7. Measured (black solid line) and modelled (both GOTILWA+ (red long dash) and ORCHIDEE (blue short dash)) seasonal cycles of
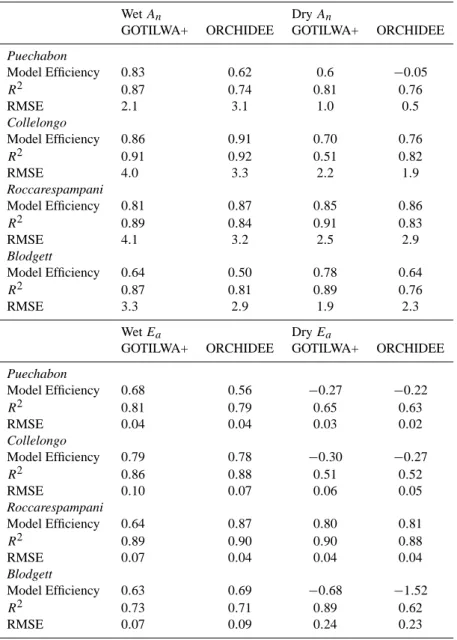
Table 4. Statistics for the comparison of GOTILWA+ and ORCHIDEE diurnal cycles of assimilation (An) and actual evapotranspiration (Ea) with FLUXNET data at each site, for wet and dry period Golden days, with free simulated soil water content, based on hourly data.
Wet An Dry An
GOTILWA+ ORCHIDEE GOTILWA+ ORCHIDEE
Puechabon Model Efficiency 0.83 0.62 0.6 −0.05 R2 0.87 0.74 0.81 0.76 RMSE 2.1 3.1 1.0 0.5 Collelongo Model Efficiency 0.86 0.91 0.70 0.76 R2 0.91 0.92 0.51 0.82 RMSE 4.0 3.3 2.2 1.9 Roccarespampani Model Efficiency 0.81 0.87 0.85 0.86 R2 0.89 0.84 0.91 0.83 RMSE 4.1 3.2 2.5 2.9 Blodgett Model Efficiency 0.64 0.50 0.78 0.64 R2 0.87 0.81 0.89 0.76 RMSE 3.3 2.9 1.9 2.3 Wet Ea Dry Ea
GOTILWA+ ORCHIDEE GOTILWA+ ORCHIDEE
Puechabon Model Efficiency 0.68 0.56 −0.27 −0.22 R2 0.81 0.79 0.65 0.63 RMSE 0.04 0.04 0.03 0.02 Collelongo Model Efficiency 0.79 0.78 −0.30 −0.27 R2 0.86 0.88 0.51 0.52 RMSE 0.10 0.07 0.06 0.05 Roccarespampani Model Efficiency 0.64 0.87 0.80 0.81 R2 0.89 0.90 0.90 0.88 RMSE 0.07 0.04 0.04 0.04 Blodgett Model Efficiency 0.63 0.69 −0.68 −1.52 R2 0.73 0.71 0.89 0.62 RMSE 0.07 0.09 0.24 0.23
encountered was accurately simulated in 2002, but overes-timated in 2003 and 2004 when simulating with a full bi-directional feedback between soil water and canopy fluxes. Although with GOTILWA+, evapotranspiration was slightly overestimated in the period of high production before wa-ter stress was encounwa-tered, GOTILWA+ outperformed OR-CHIDEE at Puechabon, giving a better correlation to the EU-ROFLUX data, a higher model efficiency and a lower stan-dard error (Table 5). GOTILWA+ also performed better at the Blodgett site, where ORCHIDEE accurately captured CO2
and water flux dynamics during spring, but largely overesti-mated the effect of drought on assimilation and conductance during summer periods.
Comparisons of simulations with measurements at the two deciduous sites were complicated by an active under-storey. Phenology also proved difficult to model, with neither model capable of accurately predicting the timing of bud-burst or leaf-fall, particularly in 2003. In Roccarespampani, both models produced an equal match to the data, but were prone to higher levels of standard error (Table 5). Roccares-pampani had vegetative growth beneath the canopy, which was not taken into account in GOTILWA+, but was simu-lated by ORCHIDEE. Relatively high latent heat fluxes were observed outside of the growing season of the deciduous oak, Quercus cerris. These were not reproduced by either model, leading to difficulties when simulating the evolution
Table 5. Assimilation and actual evapotranspiration statistics for the comparison of GOTILWA+ and ORCHIDEE with FLUXNET data
at each site, for seasonal daily simulation values. For Collelongo and Roccarespampani, which are deciduous sites, data from outside the growing period was omitted. New and original model formulations are compared.
GOTILWA+ ORCHIDEE
An Ea An Ea
New Original New Original New Original New Original Puechabon Model Efficiency 0.76 −0.09 0.46 0.42 0.64 0.69 0.18 −0.82 R2 0.90 0.83 0.92 0.91 0.88 0.68 0.48 0.39 RMSE 1.23 1.96 0.61 0.36 1.32 1.36 0.63 0.92 Collelongo Model Efficiency 0.82 0.69 0.5 0.45 0.77 0.74 0.6 0.55 R2 0.93 0.93 0.79 0.79 0.91 0.90 0.68 0.7 RMSE 1.68 1.78 0.93 0.92 1.88 1.91 0.74 0.83 Roccarespampani Model Efficiency 0.68 0.31 0.16 −0.11 0.67 0.58 0.64 −0.46 R2 0.88 0.85 0.87 0.86 0.84 0.85 0.82 0.66 RMSE 2.36 3.11 1.08 1.23 2.34 2.44 0.64 1.32 Blodgett Model Efficiency 0.69 0.006 0.53 0.36 0.37 −0.1 0.18 0.23 R2 0.89 0.79 0.71 0.70 0.71 0.47 0.49 0.50 RMSE 1.47 1.74 0.65 0.62 1.95 2.21 0.93 1.03
of available soil water at the Roccarespampani site. In Col-lelongo, ORCHIDEE preformed better than GOTILWA+. GOTILWA+ accurately reproduced the strength and duration of the drought in 1998 and its effect on photosynthesis, but due to inaccuracies in the prediction of budburst and leaf-fall dates, total photosynthesis over the growing season was overestimated (Table 5, Fig. 7).
Overall, both models accurately capture the observed CO2
and moisture fluxes at all sites. GOTILWA+ gave an aver-age site r2of 0.90 for An and 0.82 for Ea, and an average
MEF of 0.74 for An and 0.41 for Ea, over all sites.
OR-CHIDEE gave an average site r2 of 0.84 for An and 0.59
for Ea, and an average MEF of 0.61 for An and 0.34 for
Ea (Table 5). These values represent a marked increase in
model accuracy when compared with the original models. For GOTILWA+ the new implementation led to an average decrease of 22% in the RMSE over all sites for simulated An
and a decrease of 9% in the RMSE of simulated Eaover all
sites when compared against the original model formulation. For ORCHIDEE the RMSE for Anwas relatively unchanged
(though the r2increased by 15%) and the RMSE for Ea
de-creased by an average of 21% over all sites. These statis-tics suggest signficantly better model performance than that found in recent published model comparisons including wa-ter stressed sites (Morales et al., 2005; a study including the original versions of the ORCHIDEE and GOTILWA+ mod-els).
4 Discussion
A number of recent studies have brought into question the ability of process-based models to accurately simulated sea-sonal changes in CO2and water fluxes in Mediterranean-type
forest ecosystems (e.g., Krinner et al., 2005; Morales et al., 2005; Jung et al., 2007). The use of equations in which the photosynthetic response to drought solely depends on stom-atal control fails to capture both the timing and extent of the response of the coupled photosynthesis-conductance system to water stress. From our analysis of half-hourly FLUXNET data at four Mediterranean-type sites, this appears not to be due to a fundamental inaccuracy in the description of stom-atal conductance (e.g. using a BB-type approach), but rather an incomplete description of the mechanisms controlling the seasonal response of the photosynthetic capacity of Mediter-ranean trees to gradually occurring water stress.
Despite the widespread use of BB-type canopy conduc-tance models, detailed studies that would allow incorporation of the effects of water stress are lacking, and reported results are inconsistent. Several studies reported that the reductions in stomatal conductance with soil water stress is sufficient (e.g. Harley and Tenhunen, 1991; Sala and Tenhunen, 1996), whilst others maintain that it remains constant (e.g. Sellers et al., 1996; Colello et al., 1998). We found that the relation-ship between Gs and An changed only slightly under soil
water stress, resulting in an almost constant slope parame-ter, m. This suggests that stomatal conductance changes in parallel with photosynthesis, as originally reported by Wong
et al. (1979). Further, our finding that the residual conduc-tance does not change under soil water stress is contrary to results previously reported at the Blodgett site by Misson et al. (2004).
It is well known that the stomata react to changes in soil water availability (e.g. Kramer, 1983). The water reserves in leaves and stems are very small when compared to the amount of water transpired, and thus these organs could be quickly dehydrated in the absence of fast mechanisms, such as stomatal closure, to limit water loss (Slatyer, 1967). The effect of such stomatal closure is most commonly observed in the mid-day decline in stomatal conductance due to decreas-ing leaf water potential. This limits photosynthetic activity through reductions in Ci. Such short-term responses are
es-sential to conserving the plant hydraulic balance. However, with the slow onset of water stress, as experienced season-ally by all Mediterranean ecosystems, the picture becomes less clear. Other processes have been identified (e.g. Flexas and Medrano, 2002; Galmes et al., 2007), and can be di-vided into two categories: mesophyll conductance responses and metabolic adjustments. Changes in mesophyll conduc-tance can reduce the concentration of CO2 in the
chloro-plast with reference to leaf Ci. Whilst stomatal conductance
rapidly changes to maintain the leaf hydraulic status, mes-ophyll conductance has been related to anatomical features and thus subject to slower responses, with large changes re-ported during the onset of slowly developing drought (e.g. Flexas and Medrano, 2002; Flexas et al., 2004). Metabolic adjustments can take many forms, and may include the re-duction of enzyme activity necessary for RuBP regenera-tion (Maroco et al., 2002), reduced nitrate reductase activity (as an indicator of nitrate utilisation) (Smirnoff and Stew-art, 1985), and the reduction of sucrose phosphate synthase (Vassey and Sharkey, 1989). It has been suggested that all of these responses can play some role in the control of photo-synthesis (Loreto and Centritto, 2008), depending on the de-gree of water stress encountered and the relevant time scales involved. None of these processes, however, are taken into account by current large-scale ecosystem models.
The non-stomatal limitations found in this study differ in strength between sites. The two sites with Quercus species, Puechabon and Roccarespampani, showed similar responses, likely reflecting similarities in their leaf physiologies and overall anatomy. Quercus ilex (present in Puechabon) is
an evergreen sclerophyllous species, commonly found in Mediterranean regions, and well adapted to drought stress with tough coarse leaves. Quercus cerris (in Roccarespam-pani), although deciduous, also has a high sclerophyll in-dex (Kutbay and Kilinc, 1994). Highly sclerophyllous leaves have been reported to have relatively high mesophyll conduc-tance limitations (Loreto et al., 1992; Syvertsen et al., 1995). The Pinus ponderosa species studied at Blodgett encountered very little water stress, with only a minimal reduction in pho-tosynthetic activity during periods of low soil water content. This could hypotheticaly be explained by access to ground
water and mild air temperatures during summer due to high altitude. Fagus sylvatica, found at Collelongo, is not a typical Mediterranean species, and is therefore not moisture-stress adapted. The low water stress encountered at this site could also be explained by the possibility of ground water access at this site as suggested by Hickler et al. (2006). The large role of non-stomatal limitations found at each site suggests that the observed reduction in canopy conductance during slowly progressing natural water-stressed periods is larger than can be accounted for by stomatal closure.
The work presented here makes several assumptions re-garding possible influencing factors which could not be quantified from the available data. It was first necessary to assume that stomatal patchiness does not have a signifi-cant effect when making calculations which average over the whole canopy. It has been reported that, in leaf-level exper-iments, stomatal patchiness may invalidate leaf Ci
calcula-tions, in particular under drought conditions (Buckley et al., 1997; Mott and Buckley, 2000). However, more recent stud-ies have shown that the influence of stomatal patchiness on calculations of leaf Ci is less than once thought (e.g. Lawlor
and Cornic, 2002). Also, it has been reported that the effect of stomatal patchiness is not as large in the field as it is in laboratory experiments, (Gunasekera and Berkowitz, 1992; Kubiske and Abrams, 1993).
The nature of the data analysed here, gathered at the canopy scale under field conditions, leads to large variabil-ity in some of the variables necessary to calculate the pa-rameter response functions. The derivation of model param-eters using canopy level eddy-covariance data is also sub-ject to a number of uncertainties. For example, we assume all latent heat and CO2 flux measurements result from the
fluxes of water and CO2 across the canopy sufaces of the
dominant species at each site. We recognise that this may not always be true. Other tree species on a site, or an ac-tive understorey, could potentially make large contributions to the total measured fluxes. Hence, we tried to minimise this problem by focusing on highly monospecific stands, and ex-cluded sites at which strong contributions from understorey activity had been reported. These measures, however, can-not guarantee that the results are unaffected by the presence of non-dominant species, but we assume that any bias intro-duced is minimal. Soil evaporation is another potential con-tributor to the total fluxes. We assume that soil evaporation is minimal in a closed Mediterranean forest with a dry floor. We exclude data related to periods during or soon after rain events to reduce the potential impact of soil evaporation on our calculations.
The usefulness of our analyses depends directly on the accuracy of the flux measurements and calculations for the partitioning of fluxes. Unfortunately, information on obser-vational errors are difficult to obtain for flux measurements (Dore et al., 2003). Error estimates for CO2 fluxes across
different sites range between 30 and 180 gCm2yr1. This