HAL Id: hal-02870595
https://hal.archives-ouvertes.fr/hal-02870595
Submitted on 16 Jun 2020
HAL is a multi-disciplinary open access
archive for the deposit and dissemination of
sci-entific research documents, whether they are
pub-lished or not. The documents may come from
teaching and research institutions in France or
abroad, or from public or private research centers.
L’archive ouverte pluridisciplinaire HAL, est
destinée au dépôt et à la diffusion de documents
scientifiques de niveau recherche, publiés ou non,
émanant des établissements d’enseignement et de
recherche français ou étrangers, des laboratoires
publics ou privés.
Role of aerosol size distribution and source location in a
three- dimensional simulation of a Saharan dust episode
tested against satellite-derived optical thickness
Michael Schulz, Yves Balkanski, Walter Guelle, François Dulac
To cite this version:
Michael Schulz, Yves Balkanski, Walter Guelle, François Dulac. Role of aerosol size distribution and
source location in a three- dimensional simulation of a Saharan dust episode tested against
satellite-derived optical thickness. Journal of Geophysical Research: Atmospheres, American Geophysical
Union, 1998, 103 (D9), pp.579 - 589. �10.1029/97JD02779�. �hal-02870595�
JOURNAL OF GEOPHYSICAL RESEARCH, VOL. 103, NO. D9, PAGES 10,579-10,592, MAY 20, 1998
Role of aerosol size distribution and source location in a three-
dimensional simulation of a Saharan dust episode tested against
satellite-derived optical thickness
Michael Schulz
1
Centre des Faibles Radioactivit6s, CNRS-CEA, Gif-sur-Yvette, France
Yves J. Balkanski and Walter Guelle
Laboratoire de Mod61isation du Climat et de l'Environnement, CEA, CE Saclay, France
Francois Dulac
Centre des Faibles Radioactivit6s, CNRS-CEA. Gif-sur-Yvette, France
Abstract. An off-line global three-dimensional tracer model based on analyzed wind fields was augmented to simulate the atmospheric transport of mineral dust. The model describes the evolution of the aerosol size distribution and hence allows to compute aerosol number and mass concentrations. In this study we describe the parameterization of the sedimentation process and include a preliminary source formulation but exclude wet deposition. Validation of the model is done during a 16-day period in June-July 1988 with very scarce precipitation. It is based on a comparison of every model grid box with daily satellite-derived optical thickness observations of Saharan dust plumes over the North Atlantic and the Mediterranean. The model reproduces accurately the daily position of the dust plumes over the ocean, with the exception of Atlantic regions remote from the African coast. By systematic analysis of transport and aerosol components we show that the largest uncertainty in reproducing the position of the dust clouds is the correct localization of the source regions. The model simulation is also very sensitive to the inclusion of convection and to an accurate treatment of the sedimentation process. Only the combination of source activation, rapid transport of dust to higher altitudes by convective updraft and long-range transport allows the simulation of thc dust plumes position. This study shows that a mineral dust transport model is only constrained if both the sourcc strength and the aerosol size distribution are known. The satellite
observation of optical thic •kness over the Mediterranean and assumptions about the size
distribution
indicate
that
the
dust
emission
flux was
of the
order
of 17x
106
t for the 16-day
period under invcstigation. The simulations suggest that a major aerosol mode initially around 2.5 [tm with a standard deviation of 2.0 plays the dominant role in long-range transport of
mineral dust.
1. Introduction
A renewed interest in dust comes from the role played by the large quantity of mineral aerosols in the Earth radiative budget [Houghton et al., 1994] which might be significantly disturbed by anthropogenic activities [,zlndreae, 1996' Tegen et al., 1996]. Furthermore, the surface of desert dust particles provides a substrate for heterogeneous chemist• [Dentenet et al., 1996]. Mineral aerosols transported at far distances also play a role in providing micronutrients to remote ecosystems and may stimulate marine and terrestrial productivity [Martin and Fitzwater, 1988; Swap et al., 1992; Martin et al., 1994].
Also at Institut fiir Anorgani_sche und Angewandte Chemie,
Universitat Hamburg, Hamburg, Germany.
Copyright 1998 by the American Geophysical Union.
Paper number 97JD02779.
0148-0227/98/97JD-02779509.00
in order to apprehend these effects on a global and possibly historical scale, one has to show that the present atmospheric dust transport can be described accurately in a model. Such a description of the dust transport has been up to now a challenge,
because of the difficulty in representing the following processes: the source potential of certain regions depending on fnmr specific soil type and vegetation resulting in localized dust storms of brief duration; the long-range transport over
thousands of kilometers and the removal and transformation
processes that affect the aerosol size distribution.
With regard to experimental access to the problem, satellite observations provide an invaluable way to assess the extension and frequency of appearance of dust clouds over the oceans [dankowiak and Tanr•, 1992; Swap et al., 1996; 3/[oulin et al., 1997a; Husar et al., 1997]. These observations
offer a remarkable coverage in time and space that was not previously available. The Meteosat platform performs wide spectral band imaging of the Sahara and the adjacent oceanic regions in the solar spectrum (visible light spectrometer (VIS)
10,580 SCHULZ ET AL.: ROLE OF AEROSOL SIZE DISTRIBUTION AND SOURCE LOCATION plus near infrared channel) and in the thermal infrared useful
for detailed dust observations. The dust optical thickness can be retrieved sufficiently quantitatively over oceans from the VIS observations since ocean albedo is low and fairly constant [Dulac et al., 1992a]. The good accuracy obtained allows us to compare in detail modeled dust optical thickness distributions. However, quantitative mass budgets of the dust transport from such images are a challenge. For example, the derivation of aerosol mass from optical thickness requires assumptions on the aerosol particle size distribution, which can hardly be justified for specific events. In addition, dust loads cannot be estimated directly in cloud-covered areas. Attempts to interpolate aerosol mass in cloud-covered regions are prone to large uncertainty [Dulac et al., 1992a; Moulin et al., 1997a].
Since major dust events happen sporadically, any modeling of the dust transport needs to resolve hourly changes in dust fluxes and to simulate several months to cover extreme events and seasonal changes [d541meida, 1986; doussaume, 1990; Gentton, 1992; Tegen and Fung, 1994]. The computational limitations have, however, led to simplified treatments, particularly of the aerosol size distribution. Since large particles are removed much faster, a significant change in size distribution is to be expected as the distance from the source increases. Some more explicit work was done incorporating a large number of size bins in two-dimensional (2-D) and mesoscale models [Schatz, 1980, Westphal et al., 1988]. The retrieval of geochemical information on dust fluxes and the optical properties of the dust aerosol suffers from model shortcomings which concem the treatment of the size distribution.
Although the models mentioned above were able to capture the general features of dust appearance, their validation is done at best by comparison with very few point measurements. A dynamic system like dust mobilization and transport is not adequately constrained with such few observations. Nickovic and Dobrivic [1996] have made an early attempt to validate a dust transport model through comparison with daily satellite pictures. The work presented here tries to close the gap in investigating the dust transport both on the computational and the validation part of the problem. The primary aim was that the numerical code representing the model was efficient enough to simulate the evolution of global mineral dust fields for several years with present-day supercomputers. This goal implied a description
of the aerosol size distribution evolution, and the simulations
had be validated with daily synoptic data related to the occurrence of aerosol.
We have excluded from this study the incorporation of the wet deposition process. We are aware that wet deposition is the most important process in removing long-range transported mineral dust particles. However, we believe that our simulations, as is shown by the comparison with satellite observations, justify the constrained analysis of dust model components as presented here for a case study.
2. Model Description
2.1. Representation of the Aerosol Size Distribution One specific problem of a mineral dust transport model is the fact that particles having the same composition differ in size over a range of several magnitudes. Observations of
mineral aerosol size distribution show that it is composed of several lognormal distributions [Shettle, 1984, dMlmeida, 1986; Jaenicke, 1987]. To account correctly for the size distribution effect, the model should: (1) allow for the partitioning of mass among several distribution modes; (2) reproduce the gradual change in size distribution during transport; (3) utilize the actual size distribution for calculating fluxes and optical properties and (4) be computationally efficient."
Two different representations of the aerosol distribution have been developed in parallel. One is a computationally efficient spectral scheme, the second one is a bins scheme; discretizing the size distribution, which is more accurate given
a sufficient number of size classes. In both schemes,
lognormal distributions are used, and it is assumed that a superposition of up to three aerosol modes provides sufficient information on the size distribution [d541meida, 1986; Jaenicke, 1987].
2.1.1. Spectral scheme. In the spectral scheme these three aerosol modes of the mineral dust distribution are described by three independent constant-width lognormal distributions. It is useful to recall at this point that one lognormal distribution is fully described by any three of the four parameters: mass median diameter (MMD), geometric. standard deviation (c r), mass (m), and number (N). It is important to note here, that the number median diameter (NMD) could also be used as one of the four parameters, replacing the mass median diameter where needed. With a constant standard deviation, any two of the remaining three parameters, for example MMD, m and N are sufficient to infer the value of the other unknown parameters of the distribution. This results in considerable savings in computing the aerosol distribution evolution in a transport model, because one can use the number and the mass concentration to represent any aerosol mode n. These two parameters constitute two tracers which can be handled independently in the transport routines. The number and mass median diameter are computed at any grid point from the local concentrations of number and mass, considering particle density, assuming a spherical particle shape. For the mineral aerosol we have used a value of pp --
2.65
gm'3:
NMD.
=
1
N,- to.
pp - exp(4.5.
m..6
In 2 or,
)
(1)
MMD. = NMD.. exp(3- In 2 or) (2) The assumption of a constant standard deviation implies that the width of an aerosol mode does not vary, but the total mass can take any value for a given median diameter.
2.1.2. Bins scheme. In the bins scheme aerosol mass is
handled in independent classes. We have used a variable number of size classes (5-100) with logarithmically spaced intervals covering a particle range from 0.01 to 500 !,tm. Each bin is characterized by its geometric mean diameter. Size dependent processes are calculated as a function of this diameter. With a large number of size classes this procedure allows us to reproduce the change in size distribution accurately. Our sensitivity tests indicated that 20 bins are sufficient to avoid numerical inaccuracies, for example when distributing mass at the source from a continuous distribution into a limited number of size classes.
SCHULZ ET AL.: ROLE OF AEROSOL SIZE DISTRIBUTION AND SOURCE LOCATION 10,581
In contrast to the spectral scheme an irregular size distribution will evolve with the bins scheme as a consequence of transport and mixing. However, to summarize information we have computed size distribution parameters for diagnostic purposes in a simplified manner:
log(MMD) = E m• log d•/Z m, (3)
log(o'g)
= •/Zrn,
(logMMD-
log
d•
)2
/Z (m,
)
(4)
To derive averages of the size distribution parameters in the diagnostic process for air mass columns, a mass weighting was applied to exclude inaccurate values from essentially dust free layers.
2.2. Source Term
The inspection of infrared satellite images shows that dust rise can be a localized phenomenon [Legrand, 1990]. We have studied the IR images for our case study and searched for supplementa.ry information on potential source regions. Infrared images are also sensitive to the presence of dense transported dust clouds and cannot give information on source location for areas that are covered with water clouds. In our case, IR images are not as unambiguous as one would like them to be, because of a varying cloud cover in the time period under study. However, the origin of the dust clouds moving toward the Mediterranean seemed to be located in the center of west Africa. There the Taoudeni basin has been identified earlier as an important dust rise region [Legrand, 1990,
Bergametti,
1992].
Surprisingly,
one
•,rid
box
alone
centred
at
23øN and 2.5øW (about 300x300 km ) proved throughout our different simulations to be a good assumption of the active source, being responsible for a good portion of the dust cloud observed over the Mediterranean and also over the Atlantic.
A source formulation needs not only to include a choice of the spatial distribution of the source but also of the source strength, an initial aerosol size distribution, and a modulation by surface wind and diurnal changes. Since we are not intending to derive a mechanistic model of the source function, we resort to simplified assumptions. The good results obtained with our simple source model justify this choice. However, for the sake of completeness, we implemented also a detailed source [Marticorena and Bergametti, 1995] in a sensitivity simulation.
Theoretical studies as well as studies in wind tunnels [e.g., Shao et al., 1993] have shown that the upward dust flux is proportional to the third power of the friction velocity. We have assumed as a simplification that the friction velocity is directly proportional to the wind speed. The frequency and intensity of the dust flux also depends on a threshold velocity. We noticed that the surface winds in the source region ranged frequently up to but not higher then about 7 m-s in the period studied. Since dust has risen in the region, we initially have used for the reference simulation a relatively low threshold wind velocity of 3 m-s. However, we have given special attention to this problem in two sensitivity simulations to be discussed below.
The source strength was chosen such that the simulated optical thickness was equal to the observed one from Meteosat over the marine cloud-free Mediterranean Sea during the last days of our case study (July 4-10, 1988). All together the dust
flux
Fs was
estimated
to be of the order
of 17x106
during
16
days.
The
source
emission
factor
Xs
was
then
2 [•tg
s
2 m-S].
Fs
= XsU3Xd
(t
)
(5)
A frequent observation of dust storms has shovm that most dust is observed in the early afternoon [B•renger, 1963; Middleton, 1985; Goudie and Middle ton, 1992]. In an attempt to investigate the importance of the diurnal cycle, we amplified this cycle of the source strength by superimposing asinusoidal function Xa(t) with a maximum at !5 hours Ioea! time, suppressing dust emission in the night.
The mass flux is fight away redistfibuted among the aerosol modes and/or bins according to an initial source aerosol size distribution. SheMe [1984] has tried to summarize measurements of size distributions encountered during a dust rise event and after some time of transport.
However, the initial size distribution to be chosen for the
model needs to be representative of source grid boxes. In our model these boxes have a considerable extent in height (400
m) and area
(300x300
km2).
To our knowledge
a profile
of
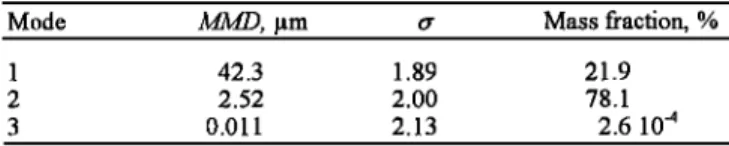
mass and distribution was never thoroughly characterized by measurements for heights up to 400 m. We have even less information on the coarse particles for which a large vertical mass gradient is to be expected, as a consequence of the immediate removal by sedimentation. The coarse aerosol mode is therefore of minor importance when we want to describe the initial size distribution available for long-range transport. We resorted to Shettle's background size distribution. However, Dulac et al. [ 1989] for example as well as our sensitivity studies suggest that the major second mode has a much smaller standard deviation then originally reported by Shettle. The size distribution used for our reference simulation is found in Table 1.
After conversion of the dust emission flux to aerosol mass,
we partition mass as follows: In the bins scheme the aerosol mass m, in any bin i is computed by integration for the size interval from d•,i to di,,, taking into account that n aerosol modes contribute to the mass:
1.
erf
(ln
cl,.,
/ MMD,
lnd•2
/ 3/BtD,
)1
(6)
m,
= •m•
n.•
x/-•-ln<
)-erf( 71n<
With the spectral scheme the aerosol mass injected in any
mode is found from the mass fraction the aerosol mode has in
the source size distribution. However, we do also calculate the
particle number transport_. For initialization we need therefore to calculate the number concentration Nn of any aerosol mode which corresponds to the emitted mass mn of the source size distribution:
m. ß 6. exp(4.5 ß In • o'. )
N = (7)
Table 1. Aerosol Mass Size Distribution at the Source for Reference Simulation
Mode M3/zD, •tm rr Mass fraction, %
1 42.3 1.89 21.9 2 2.52 2.00 78.1
10,582 SCHULZ ET AL.' ROLE OF AEROSOL SIZE DISTRIBUTION AND SOURCE LOCATION
2.3. Transport
The transport model used is an off-line 3-D tracer transport model (TM2) developed by Heimann [1995] and first described by Heimann and Keeling [1989]. It solves the continuity equation for the conservation of mass. The tracer transport is driven by analyzed wind fields of the European Center for Medium-Range Weather Forecasts (ECMWF), ensuring that model results can be compared directly to observations. For the period studied here, winds and convection were obtained for every 6-hour-interval. Advection in the model is computed using the slopes scheme of Russel and Lerner [1981]. Although it is mass-conservative, the scheme may produce negative concentrations when large concentration gradients coincide with small air mass transports. This was avoided by limiting the slopes. Subgrid- scale vertical exchange processes include turbulent diffusion
[Louis, 1979] and mass fluxes associated with convective activity. Both are inferred from ECMWF fields of temperature, humidity, and surface evaporation fluxes [Tiedtke, 1989].
The vertical spacing in the model consists of nine levels following sigma coordinates on which the 15 level ECMWF data have been interpolated. The six bottom levels of the model remain well within the troposphere. Ramonet [1994] incorporated in the model the possibility of using a refined horizontal grid of 2.5øx2.5 ø. In this resolution, advection is calculated with a 1 hour time step.
This higher-resolution version was used for simulating the Saharan dust transport. The model region chosen for this study included only the area where the geochemical fate of Saharan dust would most probably be contained (see area shown in Figure 1). A natural southern boundary is the • Meteosat, July
0 0.25 0.5 0.75 2>I 0 0.2.5 0.5 0.75 2>1
Saha:ra, n dust. opt:ical thickness Saha,ran dust; optical t;hickness
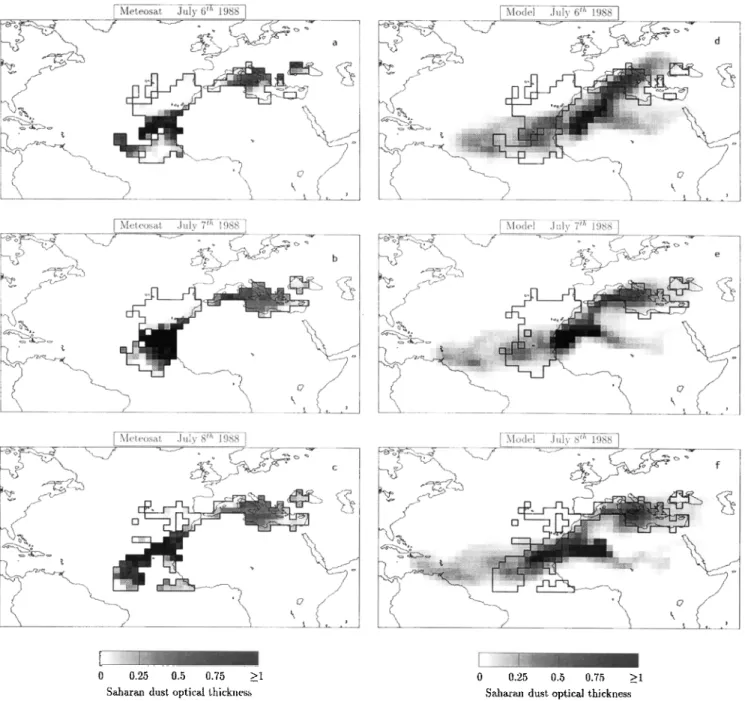
Figure 1. (a-c) Dust optical thickness (at 550 nm) fbr marine cloud-free area from satellite observations averaged within the model grid. Marine cloud-free area with satellite observations is encircled with a bold line (d-f) Dust optical thickness (at 550 nm) as simulated by our tracer model. For comparison, the area with satellite observations is also encircled here with a bold line
SCHULZ ET AL.: ROLE OF AEROSOL SIZE DISTRIBUTION AND SOURCE LOCATION 10,583
intertropical convergence zone where most of the dust is removed by frequent and heavy convective rams. The limited lifetime of the relatively coarse mineral aerosol and the increased precipitation in midlatitude bands suggest further that only limited transport is expected northward of North America, mid-Europe, and mid-Asia.
2.4. Sedimentation
Settling velocities Vr of aerosol particles for a given diameter were calculated according to Stokes relationship, including their dependence on the lower air viscosity at higher altitudes [Seinfeld, 1986]. With the bins scheme the mass transfer due to sedimentation of any aerosol size class is simply the product of settling velocity for the geometric mean diameter and time step.
The spectral scheme requires that we integrate the nonlinear sedimentation process for the whole spectrum to accurately calculate fluxes and the transformation of the size distribution. Slinn and Slinn [1980] have shown that this transformation can be computed taking into account a characteristic particle diameter and the standard deviation of the distribution. The characteristic number and mass size spectrum these diameters are the mass and number median diameter for every aerosol mode, respectively. NA4D and MMD thus have to be calculated with the spectral scheme at every time step in all grid boxes (see (1) and (2)). The mean settling velocity of mass and number of any aerosol mode is then to be found by
V--T,mass
_ VT,A/gdD
. O'n
2
In
tr
n
(8)
-- 21n tr n
PT,number : 1JT,NMD 'On (9) The large range of settling velocities poses computational problems with regard to two effects: First, numerical diffusion can artificially increase the vertical mixing with considerable effects on transport and aerosol residence times. Second, multilayer crossing of large particles may occur for large time steps typically used in large-scale models. We calculate thus the sedimentation fluxes of mass in every size class (in the bins scheme) and mass as well as number of a given mode (in the spectral scheme) in strict analogy to the vertical advection routine. The numerical diffusion is effectively minimized using the slopes scheme of Russel and Lerner [1981]. The fluxes F•,k from any grid box I to a grid box k below are computed by accumulating all dust fluxes arriving at layer k from the layers above to derive new mass ( and number) concentrations. The sum of mineral dust arriving at the surface constitutes the deposition flux.
2.5. Modeled Aerosol Optical Thickness
Relating the aerosol mass to optical thickness requires the aerosol specific extinction cross section, which depends
strongly on particle diameter and refractive index. The
refractive index of mineral dust aerosol has been chosen to be
1.50 -0.01 i, a result obtained independently by Moulin et al. [1997b] and by Ignatov et al. [1995] when comparing Sun photometer and satellite-derived optical thickness. Any possible dependence of the refractive index on particle diameter, particle shape, or other factors such as humidity is beyond the scope of our simulation.
However, the dependence of optical thickness on particle diameter is well described by Mie -theory. We calculated dust optical thickness (raer) at 550-nm wavelength, which corresponds to the Meteosat VIS channel in every model grid column, assuming single scattering and accounting for variations in the dust size distribution in the column:
•'aer
= •r*55ø(MMDn,t,O'n,t)'
mn•
(10)
The aerosol specific extinction cross section
(K'55o
(MMDn,
I, On,
l)) was
precalculated
using
Mie theory
as a
function of aerosol size distribution parameters for a lookup
table
(13x13)
of K*5•o
values
corresponding
to pairs
of the
two
aerosol size distribution parameters in the range of 0.01-50 tam for the MMD and in a range of 1.7-3.5 for the standard deviation and the above mentioned refractive index and a particle density of 2.65. In the diagnostic process of the model output the aerosol specific extinction cross section in any grid box of layer I was derived by a bicubic spline interpolation from this lookup table for the aerosol spectrum of each mode.
3. Model Validation Procedure
3.1. Satellite-Derived Aerosol Optical Thickness over the Ocean
For comparison we have used images in the visible spectrum (VIS, 0.35-1.1 tam) as taken by Meteosat-2 satellite imager. To obtain high signal to noise ratios, images taken at noon (1130-1200 UTC) were considered. The area of possible comparison ranged in longitude from 40øW to 40øE and in latitude from 5øS up to 45øN. Images were processed as described by A4oulin et al. [1997a] on the basis of numeric counts of subsampled International Satellite Cloud Climatology B2 images. Cloud contaminated pixels were identified over the oceans by checking against a local variance and an absolute threshold. Pixels were marked as being cloudy, associated with patchy cloud fields, if the variance of the enclosing 3x3 pixels were greater than four numerical counts. The absolute threshold, associated with a large cloud cover in the cell, was set to be 64. An atmospheric radiative
model was then used to account for the backscatter from the
sea surface, the attenuation by gaseous absorption, and the molecular backscatter from a standard atmosphere to retrieve the leftover, aerosol radiance [Tanrd et al., 1990]. The
absolute calibration of the sensor and seawater reflectance
was taken from •[oulin et al. [1996]. Taking into account aerosol optical properties, we derived the dust optical thickness at 550 nm over the oceans. We used the background desert aerosol model of Shettle [1984] (size distribution as in Table 1, but with ry2 - 3.2). Observations in the Atlantic region indicate some variability in size distribution parameters. However, it should be emphasized that the retrieval of dust optical thickness from the broad spectral band of the Meteosat detector is not very sensitive to variations of the assumed aerosol size distribution [Moulin et al., 1997b], whereas the calculation of optical thickness in the transport model for the wavelength 550 nm is much more sensitive to
the modeled size distribution as discussed below. A smaller standard deviation of ry2 = 2.0 as used in the transport model changes the satellite-derived optical thickness by not more than 2%. The identical refractive index was used for satellite
10,584 SCHULZ ET AL.: ROLE OF AEROSOL SIZE DISTRIBUTION AND SOURCE LOCATION
retrieval and the model simulation of optical thickness. The relative accuracy in estimating the optical thickness for a single pixel was estimated to be on the average +/- 25% by comparison with ground-based measurements [Moulin et al.,
199761.
Whereas the calculation of the aerosol optical thickness is relatively straightforward, any estimate of the aerosol mass
from satellite observation involves further uncertainties. Fine
particles dominate the backscattered signal; relatively larger particles dominate the mass. The change in aerosol radiance is thus less representative for significant changes in the total aerosol mass. Since the model was designed to predict the aerosol distribution at any given point and thus would be able to compute optical thickness, comparison with the transport model was done on the basis of optical thickness.
3.2. Comparison of Satellite / Model Values
For direct comparison with modeled aerosol optical thickness all marine, cloud-free pixels falling into one grid element of the model were averaged. This could be composed of up to 100 individual pixels. Because a potential source of error in satellite-derived optical thickness are undetected clouds, we only use those grid elements where the marine cloud-free area fraction was larger than 20% in our statistical analysis. In the correlation analysis we also included areas where the optical thickness was below the detection limit of the satellite captor (*'aer < 0.1). This improves correlation for example in the Mediterranean region, because the correlation coefficient reflects the quality of the simulation of both dust- free and dusty areas. This contrast is well reproduced by the model, despite the lack of accuracy of low values of optical thickness.
Corresponding to these satellite observations, simulated 3-D fields of mineral dust were processed with a diagnostic tool, which we developed to compute mean aerosol properties
for a region of choice. Some of the information such as
deposition, mass loads, and vertical gravity center of the dust mass needed only simple processing. However, some aerosol properties, like size distribution parameters and optical thickness, need to be explicitly computed for every grid box to aggregate meaningful column values and mean values for any area of interest. Statistical procedures could then in a final step be applied to compare the modeled fields with satellite observations for just the marine cloud-free area.
4. Reference Simulation of Case Study
June-July 1988A 16-day period from June 25 to July 10, 1988 was selected for an intensive study. In this season the satellite sensor is most sensitive to dust, because the scattering angle is close to 180 ø. The last days were essentially cloud-free at least over the Mediterranean, and no rain was observed in this region. Several remarkable dust plumes were observed over the Mediterranean and the Atlantic.
For selected days the distribution of the dust optical thickness retrieved from satellite pictures is shown in Figures la-lc. We would like to draw attention to July 6, when a distinct plume develops and crosses the whole Mediterranean to the northeast, associated with a maximum in optical thickness. This northeastward transport in a narrow plume typically occurs with a cyclone off Portugal and an anticyclone
centered over the central Sahara. ECMWF surface winds in
the source area were highest June 21, 28, and 30, well before the plume arrived over the Mediterranean. Even more prominent is the dust plume over the Atlantic in the trade wind region.
The result of the simulation A is shown for the same days in Figures ld-lf. Especially over the Mediterranean we observe a remarkable similarity of simulation and satellite observation. The good agreement with the satellite at noon implies that the model is capable of simulating the transport reasonably well over a timescale of less than a day. A high correlation based on daily values for all marine and essentially cloud-free grid elements for the period July 4-10 is found between retrieved and simulated optical depths (r=0.86) in the
Mediterranean area; over the Atlantic a somewhat lesser
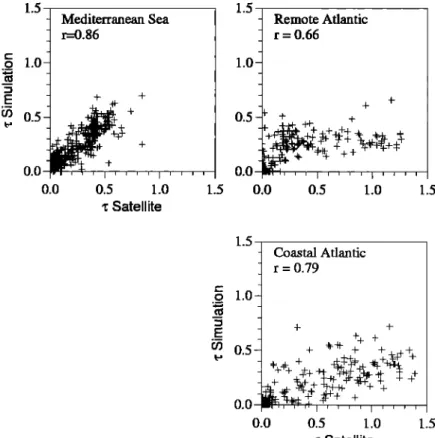
agreement (r=0.78) is found. The comparison between satellite and simulation is presented on a point-by-point basis in Figure 2. For the remote western Atlantic (see Figure 4 for the definition of the area) the correlation is worse. We suggest that the steady trade wind transport pattern is responsible for the correlation over the Atlantic. Any dust which has been simulated to disperse and enter the air masses associated with the trade winds will be transported along with them, leaving areas to the northwest free of dust. This will produce correlation between simulated and observed optical thickness especially over the coastal Atlantic. Shifting winds in the source region have resulted in the transport of dust to western Africa and hence to the trade wind regime and also from our single-grid box source during our 16-day period. Such a shift in major transport direction can also be seen in Figures 1 d-lf where the dust cloud over the Mediterranean gets separated from the one over the Atlantic. The relative smaller values of
simulated optical thickness over the Atlantic indicate that additional dust source regions have been active in the period studied.
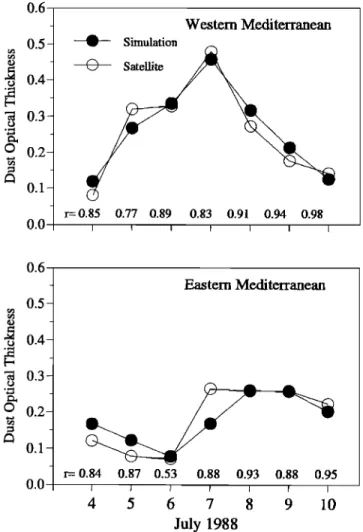
Observation and simulation show the arrival and dispersion of the dust cloud in the Mediterranean area (Figure 3) with a maximum in optical thickness occurring over the western Mediterranean on the July 6, reappearing 2 days later over the eastern basin, a delay readily explained by the required transport time in westerly winds. The observed and simulated slightly lower optical thickness over the eastern basin can be explained by the en route removal and dilution of dust. The coincidence of the day-to-day variation and the correlation coefficients of the daily comparison support strongly the
choices made for the source location.
However, a quantitative agreement about optical thickness requires further assumptions on the source strength and the size distribution. As a starting point, we have chosen in sections 2.2 reasonable values for these parameters. To reproduce the average optical thickness of 0.21 observed by Memosat over the Mediterranean Sea requires a source flux of
17.3
10
6 t in the 16-day
period.
D911rneida
[1986]
estimated
the monthly Saharian dust flux for the 2 months of June and
July
in 1981
and 1982
to range
between
42 and 93x106
t. A
slightly changed combination of the size distribution parameter values would also provide a solution to theproblem.
However
the range
in which
one
can
choose
the
values of or, MMD, and the emission flux of the major mode is limited as will be shown by our sensitivity simulations.
Figure 4 sunmaarizes the mass budget in that part of the
SCHULZ ET AL.' ROLE OF AEROSOL SIZE DISTRIBUTION AND SOURCE LOCATION 10,585 1.5 o 1.0- • _ o9 0.5 0.0 0.0 Mediterranean Sea r=-0.86 + q-
.,,1•
•., , I
+ ....
I
0.5 1.0 z Satellite 1.5 1.0 0.5 0.0Remote
Atlantic
r = 0.66 + + + + ++ q-•. 4 e +. ['" '] ' ] I [ ' [ [ I ] • ' 1.5 0,0 0.5 1.0 1.5 1.5 Coastal Atlantic r = 0.79 o 1.0- -• _o9
0.5- + **• +++
++
+..,+++
• •+ •+ • •• •+ • 0.0 0.5 1.0 1.5 • SatelliteFigure 2: Point-by-point comparison of observed and simulated optical thickness over the whole Mediterranean Sea, and the coastal as well as remote Atlantic as marked in figure 4.
Significantly more dust is transported into the Atlantic region. Only a very small portion of the total emitted dust arrives over
the Mediterranean, It is remarkable that the agreement in dust
plume position between simulation and satellite is based on just this small fraction of the transported dust. The large
deposition flux over Africa points to the importance of the sedimentation process. While almost all of the coarse mode aerosol is removed, 30% of the major mode aerosol mass is also lost over the Sahara.
The change in size distribution is an important new element of our study. The evolution of the mass and number size distribution during transport is shown for three selected areas on the way from the source to the Mediterranean in Figure 5. Column mass loads were computed for 3x3 grid boxes at the source, 500 km northeast on the track to the Mediterranean and around Corsica, on the days with
maximum values of mass loads. Both the numerical and the
spectral schemes predict the vanishing of the coarse mode, a substantial shift to smaller diameters, and the predominance of the major mode. The occurrence of a substantial coarse fraction on July 1 is probably due to rapid transport from the source region and has been simulated with both schemes.
Only very few data are available to validate the predicted vertical distribution in the atmosphere. However, some information on dust transport was gathered on the importance of the so called Saharan air layer aloft transporting dust. This was obtained through careful interpretations of red rains and dust events remote form the source, for example in middle Europe, by looking at temperature and humidity profiles and 3-D backward trajectories [Reiff et al., 1986; Dulac et al.,
1992b]. By this method the dust layer observed over the Mediterranean during the June-July 1988 period was thought to be between 3 and 5 km thick. The comparison between the dust movement as deduced from hourly series of Meteosat images and the vertical wind field as deduced from a rawinsonde profile indicated that the dust layer was at an average altitude of about 2300 m on July 5 over Corsica [Dulac et al., 1996]. The evolution of the measured temperature profiles over the Mediterranean confirms a Saharan air layer and its descent in the course of the passage of a front to the north after July 6. The simulated vertical aerosol profile consists of a dust layer with a gravity center at 3900 m on July 6 over the western Mediterranean, showing a similar descent after July 6 with a minimum on July 9 at 2700 m. This indicates that the vertical redistribution is well simulated and might be one of the key factors which allowed us to reproduce the dust event.
5. Sensitivity Studies and Discussion
Not all components of the model are equally important for the reproduction of the dust plume. We therefore performed
14 sensitivity simulations (named C through O and Z) summarized in Table 2. We compared each of these simulations to the reference case just described in order to study the effect of the numerical scheme, the size distribution, the source location and its diumal cycle, subgrid processes and the averaging of ECMWF fields. Both the experiments with the spectral (A) and the bins scheme 03) were regarded
10,586 SCHULZ ET AL.' ROLE OF AEROSOL SIZE DISTRIBUTION AND SOURCE LOCATION 0.6 0.0 • Simulation (•) Satellite Western Mediterranean r=0.85 0.77 0.89 0.83 0.91 0.94 0.98 0.6 0.5 0.4 0.3 0.2 0.1 0.0 Eastern Mediterranean r= 0.84 0.87 0.53 0.88 0.93 4 5 6 7 8 July 1988 0.88 0.95 9 10
Figure 3. Dust optical thickness and daily correlation coefficients from comparison with satellite observation for the westem Mediterranean (N = 18 grid box elements ) and the eastem Mediterranean (N=24).
comparison with satellite-derived optical thickness mainly over the Mediterranean Sea. The source strength in all experiments was kept constant.
There are two major features of the atmospheric dust transport, which we use to group our sensitivity simulations:
(1) The reproduction of the position of the dust cloud serves to evaluate the model transport and dispersion characteristics. The correlation coefficients of the comparison satellite model for selected regions are a good measure for this feature. As can be seen from Table 2, most significant degradation of the dust plume simulation is found in experiments G, I, L, N, and O. (2) The correct absolute value of simulated optical thickness would indicate a good simulation of both the vertically integrated aerosol mass and the aerosol size distribution. This feature is much more difficult to reproduce and validate since it requires a comprehensive and quantitative understanding of the dust transport. Optical thickness from simulations E, H, I, L, and N are noticeably reduced from the reference simulations, and they are significantly increased in simulation D, but also the rest of the simulations show scatter with regard to this parameter. Relative differences between the simulations allow us to judge the influence of different processes on the overall magnitude of the dust transport.
5.1. Sensitivity to Numerical Treatment of Size Distribution
Both numerical schemes developed here have an explicit treatment of the size distribution. Whereas 1 day of simulation with one major aerosol mode and the spectral scheme requires 21 cpu on a Cray C90 supercomputer, the same simulation with the bins scheme (20 tracers) required 5 times more cpu. This is the motivation to develop a more detailed comparison of the schemes and the numerical procedure to handle sedimentation, which is the important process transforming
the aerosol size distribution in our model.
Comparing the reference simulations A and B, both give
similar correlation coefficients over the Mediterranean and
over the eastem Atlantic. We conclude that the position of the dust cloud is well described by both the spectral and the bins
scheme and thus is not sensitive to the numerical scheme.
The assumption of a constant standard deviation used for the spectral scheme is the most critical one. Owing to the size dependent removal effects any lognormal distribution is transformed during transport to a distorted distribution with a smaller (•. The accurate bins scheme may be used to assess this effect. While the standard deviation of the major mode decreases slightly in simulation B, it drops considerably in
IWestern
•'•CEastern
Mediterranean
•'• Mediterranean
Simulated I '
Mass budget I Aerosol Mass 0.14 0.9 • Aerosol Mass 0.32
25.6.-10.7.88
] Deposition
0.062
106
tons/16
day
period
I
• ,
[ Deposition
0.052
Remote [
I C%?l
S. ara
I
Atla,, I Atla,, I I
J• Aerosol Mass 4 5
Aerosol Mass 0.95 • 2.8,_•] Aerosol Mass 0.52 •;i.•. 3.4•_,J •A .... '. I
Deposition
0.06
i I •e•o•tion
0.018
I•i!i:i
•.•[
•;•i•
n 1•'•
I
-
Figure 4. Overall mass budget of the reference simulation, assuming an initial size distribution as described
in table
I and
an adjustment
of the source
strength
by comparison
with
the satellite
observations
of the 4 th
to
10
th
July
over
the
Mediterranean
Sea.
SCHULZ ET AL.' ROLE OF AEROSOL SIZE DISTRIBUTION AND SOURCE LOCATION 10,587 1.E+02 '• 1.E+00 • 1.E-02 "• 1.E-04 1.E-06 Mass distribution
"'•'Sour_ce re_gion 27.i•88
h I - o- Corsica 6.7.88 0.1 1 10 100 Nmnber distribution 1.E+13
• 1.E+11
•' 1.E+09 '• 1.E+07 1.E+05 1.E+03 , 0.1 1 10 100 1.E+02 '• 1.E+00 _q 1.E-02 '• 1.E-04 1.E-06 Spectral scheme North Africa 1.7.88 • Corsica 6.7.88 x• ... 1 ... i i i } i iI 1.E+13 't• 1.E+11 ,• 1.E+09 Z 1.E+07 1.E+05 Spectral scheme...
• ...
i
1.E+03 0.1 1 10 100 0.1 1 10 100Diameter d 0tm) Diameter d (gin)
Figure 5. Simulated aerosol size distributions over the source, en route over Africa and over the Mediterranean Sea, with the bins and the spectral scheme.
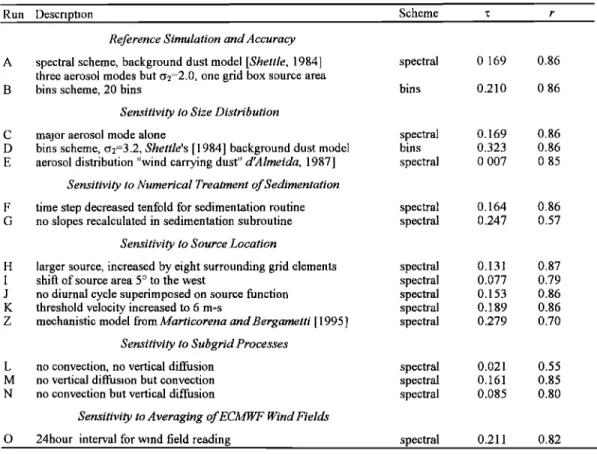
Table 2. Sensitivity Simulations Performed for the Period June 25 to July 10, 1988
Run Description Scheme • r
Reference Simulation and Accuracy A spectral scheme, background dust model [Shettle, 1984]
three aerosol modes but o2:2.0, one grid box source area B bins scheme, 20 bins
Sensitivity to Size Distribution C major aerosol mode alone
D bins scheme, o2=3.2, Shettle's [1984] background dust model E aerosol distribution "wind carrying dust" d9ilmeida, 1987]
Sensitivity to Numerical Treatment of Sedimentation
F time step decreased tenfold for sedimentation routine
G no slopes recalculated in sedimentation subroutine Sensitivity to Source Location
H larger source, increased by eight surrounding grid elements
I shift of source area 5 ø to the west
J no diurnal cycle superimposed on source function
K threshold velocity increased to 6 m-s
Z mechanistic model from Marticorena and Bergametti [ 1995]
Sensitivity to Subgrid Processes L no convection, no vertical diffusion
M no vertical diffusion but convection N no convection but vertical diffusion
Sensitivity to Averaging of ECMWF Wind Fields
O 24hour interval for wind field reading
spectral 0.169 0.86 bins 0.210 0.86 spectral 0.169 0.86 bins 0.323 0.86 spectral 0.007 0.85 spectral 0.164 0.86 spectral 0.247 0.57 spectral 0.131 0.87 spectral 0.077 0.79 spectral 0.153 0.86 spectral 0.189 0.86 spectral 0.279 0.70 spectral 0.021 0.55 spectral 0.161 0.85 spectral 0.085 0.80 spectral 0.211 0.82
Optical thickness r and correlation coefficients r are from comparison with satellite observations for the whole Mediterranean Sea area, July 4-10, 1988. Note that the source strength was equal to 17 Mt., with the exception of simulation Z (50.2 Mt.).
10,588 SCHULZ ET AL.: ROLE OF AEROSOL SIZE DISTRIBUTION AND SOURCE LOCATION
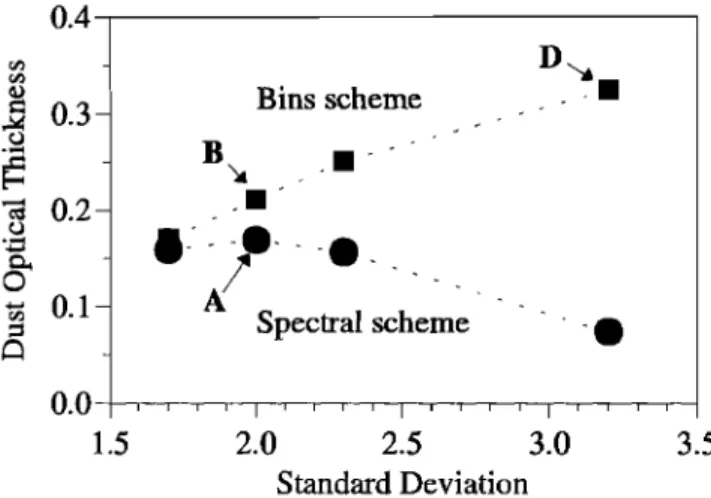
simulation D from 3.2 to 2.3 (Table 3). Figure 6 summarizes a
series of simulations where the standard deviation was varied
with both schemes. The results converge when c• decreases.
With a standard deviation of c•=2.0 the difference in simulated
mean optical thickness between the bins and the spectral
scheme is then 19% over the westem Mediterranean and 21%
over the eastem Atlantic. As is discussed in section 5.2 , a choice of a small standard deviation of c•=2.0 is also suggested by measurements and mass balance arguments. With the advantage of being able to use the spectral scheme, it seems thus justified to use a constant standard deviation for a dust aerosol distribution of 2.0.
5.2. Sensitivity to the Aerosol Size Distribution
An explicit and detailed treatment of the dust size distribution has not been implemented, to our knowledge, in any other model of this scale. It is thus of interest to study the overall performance of the dust model with respect to the variation of the distribution parameters. Table 3 shows the simulated size distribution in the receptor area of the Mediterranean Sea and optical properties of the dust cloud there. To relate this to the mass balance in the different simulations, we choose to calculate the mass fraction
deposited close to the source over Africa and the simulated mass load over the Mediterranean Sea.
It is currently deemed necessary to use at least three aerosol modes to represent the size distribution. However, only one major mode, which is centered around 2 [tm, is needed to reproduce the long-range transport and dust optical thickness over the ocean. This can be inferred from sensitivity
simulation C, where the coarse and very f'me aerosol modes
were omitted. It should be stressed, however, that this
conclusion comes from the use of optical thickness as validation parameter. A validation based upon deposition fluxes would have stressed the importance of the coarse mode.
The choice of the distribution parameters of the major mode critically affects the mass balance in the model region. The
imtial standard deviation and mass median diameter of the
source aerosol determine the rate with which the aerosol size distribution is transformed by sedimentation. Increasing either one of these parameters increases the sedimentation flux close to the source. However, a distribution with a larger initial standard deviation contains both more coarse and more very f'me aerosol particles. The latter settle very slowly and limit the mass to be removed by sedimentation. Simulation D, having a size distribution as proposed originally by Shettle [1984] as background dust distribution, consequently shows slightly higher deposition in the Sahara region and after long- range transport a much finer aerosol (MMD, 1.3 }am) over the Mediterranean Sea when compared to the reference simulation B.
The introduction of a source size distribution with a larger mass median diameter produces a dramatic difference. For an
intermediate distance from the actual dust rise zone,
d•llrneida [1987] proposed an aerosol distribution named "wind-carrying dust." For the major mode a MMD of 14.7 is assumed. This choice increases the deposition everywhere in the model region and leaves very little aerosol mass for long range-transport (simulation E). A larger mass median diameter (2.53 [tm) over the Mediterranean represents a memory of the initially larger aerosol. Measurements done in Table 3. Evolution of Size Distribution, Mass Balance and Optical Properties
Run Short Description
Size Distribution of Mediterranean Sea
July 4-10,1988
mmd, lam o
Deposition of Mass Load of Optical Properties of Sahara Mediterranean Sea Mediterranean Sea June 25 to July 10,1988 July 4-10, 1988 July 4-10 1988
% g m '2 •; K'550, g'lm2
A spectral scheme 2.03
B 20 bins scheme 1.86
C major aerosol mode 2.02 D bins scheme, o2=3.2 1.30
E dust d•llmeida 2.53
F time step decreased 1.99 G no slopes 2.27
H source enlarged 2.05
I source area to west 2.09
J no diurnal cycle 2.02
K threshold 6 m-s 2.00 Z mechanistic model 2.01
L no subgrid exchange 1.42
M only convection 1.94 N only vertical diffusion 1.90
Reference Simulation and Accuracy
2.00 55.8 0.176 0.169 1.04 1.78 47.6 0.219 0.210 1.04 Size Distribution 2.00 44.1 0.176 0.169 1.04 2.33 51.2 0.205 0.323 0.63 2.10 95.8 0.009 0.007 1.29 Treatment Sedimentation 2.00 47.3 0.167 0.164 1.01 2.00 40.5 0.295 0.247 1.19 Source Location 2.00 54.2 0.138 0.131 1.05 2.00 54.4 0.083 0.077 1.08 2.00 55.0 0.159 0.153 1.04 2.00 47.1 0.194 0.189 1.02 2.00 49.0 0.282 0.279 1.01 2.01 2.00 2.00 Subgrid processes 78.4 64.3 62.8 ECMWF Wind Fields
0.015 0.021 0.74 0.158 0.161 0.99 0.082 0.085 0.97
SCHULZ ET AL.: ROLE OF AEROSOL SIZE DISTRIBUTION AND SOURCE LOCATION 10,589 0.4
0.3-
0.2- BD•
Bins scheme I l i . Spectral scheme 1.5 2.0 2.5 3.0 3.5 Standard DeviationFigure 6. Simulated average dust optical thickness over the western Mediterranean for July 4-10 as a function of the standard deviation of the major dust mode from corresponding bins and spectral scheme simulations.
Corsica show MMD's between 2.0 and 2.3 during dust events [Dulac et al., 1989]. Thus both simulations D and E fail to reproduce the size distribution observed over the Mediterranean. Moreover, with d911meida's [ 1981] size
distribution
the source
strength
would
need
to be 520xl
06 t in
the 16-day period to reproduce the satellite derived-values. This is clearly unrealistic.
Not only do different size distributions affect the mass balance of dust, but the aerosol properties are also changed.
As shown
in Table
3, the conversion
factor
K'550
from
aerosol
mass to optical thickness can vary by a factor of 2. Comparing simulation B and D reveals that with almost the same simulated aerosol mass load but significantly smaller particles in D optical thickness may change by a factor of 1.5. The comparison with satellite observations on the basis of optical thickness is thus highly justified.
5.3. Sensitivity to Numerical Treatment of Sedimentation The model treatment of the sedimentation process may cause considerable numerical diffusion in the vertical dimension. This also affects the transport and transformation of the size distribution. If the z slopes are not recalculated during the sedimentation process (simulation G), large aerosol particles stay at high altitudes, once they are brought up by convection. The vertical gravity center of dust over the Mediterranean increases to 5.3 km compared to 3.3 km in A. Simulation G thus shows significantly less deposition near the sources as compared to the reference run. More serious is the substantially degraded correlation with satellite observations over the Mediterranean. A change in the vertical redistribution of the dust, by treating the sedimentation as a simple Euler- forward process, leads to an incorrect simulation of the long- range transport. This underlines that a higher-order numerical scheme needs to be introduced for the sedimentation process.
The spectral scheme is even more sensitive to the sedimentation scheme. The explicit calculation of the mean settling velocity overestimates the actual settling. In an attempt to increase the accuracy for the spectral scheme, we have decreased the time step for invoking the sedimentation routine tenfold (simulation F). This makes the spectral scheme
calculation look like the accurate bins simulation B also in absolute value of optical thickness. The decrease in time step, however, involves a large increase in cpu time, which means there is no advantage to this scheme over the bins scheme.
A disadvantage of the spectral scheme is that any deviation from the lognormal distribution during transport cannot be treated. In the case of multiple source areas, aged aerosol is mixed with any freshly injected aerosol, which in nature would produce a multiple mode size distribution but recombines in the spectral scheme to a weighted average lognormal distribution.
5.4. Sensitivity to Source Location
We found that a single grid box source over central west
Africa can be used to simulate the dust cloud evolution over
the Mediterranean Sea. Increasing the source area (H) by the surrounding eight grid elements does not improve the correlation coefficient. The decrease in optical thickness over
the Mediterranean, with the identical overall dust emission
flux, indicates that the mass is spread and dispersed to other regions, for instance, the Atlantic.
This fits well with the idea that other source areas may be important in providing additional dust to the Atlantic plume. A shift of the source area only 5 ø to the west (I) favors the dust transport into the trade wind regime. The agreement between satellite-derived and simulated optical thickness over the Atlantic is slightly improved (not shown). More significantly this shift deteriorates the correlation over the Mediterranean Sea. Consequently, additional dust sources responsible for some part of the dust clouds over the Atlantic must have been more to the west.
We also tested the importance of the diurnal cycle for the evolution of the dust plume during long-range transport. In simulation J we omitted the modulation of the diurnal cycle as described in the source section with no major change to the
quality of the simulation. We suppose that the diurnal signal is smeared out during long-range transport in the relatively coarse grid. However, this change in the diurnal cycle of the dust rise reduces the simulated optical thickness by 10% over the Mediterranean.
We also tested the sensitivity to the timing of the source. The long-range transport requires that the simulation starts at least on July 1 to simulate the dust appearance on July 4-10 over the Mediterranean. A later initialization drops the correlation with satellite observations (not shown). This underlines the need for at least 10 days of simulation to capture the development of a dust cloud and hence the necessity of a computationally efficient large-scale model to simulate the dust transport.
Another experiment, which affects the timing of source activation, was done by applying a threshold velocity for dust rise of 6 m-s (simulation K). Then 65% of the simulated dust injection occurs on the June 21, 28, and 30, whereas this quota is only 38% for the reference simulation. Also, in this experiment the simulated dust plume positions do not change, and correlation remains high. However, the optical thickness increased by 10% over the Mediterranean. This reflects albeit an identical emission flux over the whole period; the different transport occurring on different days will determine the dust loading arriving over the Mediterranean. In our case K, dust rise appears only on days with higher winds, which are