HAL Id: hal-00642879
https://hal.archives-ouvertes.fr/hal-00642879
Submitted on 31 Dec 2015
HAL is a multi-disciplinary open access
archive for the deposit and dissemination of
sci-entific research documents, whether they are
pub-lished or not. The documents may come from
teaching and research institutions in France or
abroad, or from public or private research centers.
L’archive ouverte pluridisciplinaire HAL, est
destinée au dépôt et à la diffusion de documents
scientifiques de niveau recherche, publiés ou non,
émanant des établissements d’enseignement et de
recherche français ou étrangers, des laboratoires
publics ou privés.
Airborne measurements of trace gases and aerosols over
the London metropolitan region
G. R. Mcmeeking, M. Bart, Patrick Chazette, Jim M. Haywood, J. R.
Hopkins, J. B. Mcquaid, W. T. Morgan, Jean-Christophe Raut, C. L. Ryder,
N. Savage, et al.
To cite this version:
G. R. Mcmeeking, M. Bart, Patrick Chazette, Jim M. Haywood, J. R. Hopkins, et al.. Airborne
mea-surements of trace gases and aerosols over the London metropolitan region. Atmospheric Chemistry
and Physics, European Geosciences Union, 2012, 12 (11), pp.5163-5187. �10.5194/acp-12-5163-2012�.
�hal-00642879�
www.atmos-chem-phys.net/12/5163/2012/ doi:10.5194/acp-12-5163-2012
© Author(s) 2012. CC Attribution 3.0 License.
Chemistry
and Physics
Airborne measurements of trace gases and aerosols over the London
metropolitan region
G. R. McMeeking1,*, M. Bart2,**, P. Chazette3, J. M. Haywood4,5, J. R. Hopkins6, J. B. McQuaid2, W. T. Morgan1, J.-C. Raut7, C. L. Ryder8, N. Savage4, K. Turnbull4, and H. Coe1
1Centre for Atmospheric Science, University of Manchester, Manchester, UK 2School of Earth and Environment, University of Leeds, Leeds, UK
3Laboratoire des Sciences du Climat et de l’Environnement, Laboratoire mixte CEA-CNRS-UVSQ, CEA Saclay,
Gif-sur-Yvette, France
4Observation Based Research, Met Office, Exeter, UK
5College of Engineering, Mathematics and Physical Sciences, University of Exeter, Exeter, UK 6Department of Chemistry, University of York, York, UK
7Laboratoire Atmosph`eres, Milieux et Observations Spatiales, Laboratoire mixte CNRS-UVSQ-UPMC, Universit´e Paris,
Paris, France
8Department of Meteorology, University of Reading, Reading, UK
*now at: Department of Atmospheric Science, Colorado State University, Fort Collins, CO, USA **now at: Aeroqual, 109 Valley Road, Auckland 1024, New Zealand
Correspondence to: G. R. McMeeking (gavin@atmos.colostate.edu)
Received: 21 October 2011 – Published in Atmos. Chem. Phys. Discuss.: 16 November 2011 Revised: 9 April 2012 – Accepted: 9 May 2012 – Published: 13 June 2012
Abstract. The Emissions around the M25 motorway (EM25)
campaign took place over the megacity of London in the United Kingdom in June 2009 with the aim of character-ising trace gas and aerosol composition and properties en-tering and emitted from the urban region. It featured two mobile platforms, the UK BAe-146 Facility for Airborne Atmospheric Measurements (FAAM) research aircraft and a ground-based mobile lidar van, both travelling in circuits around London, roughly following the path of the M25 mo-torway circling the city. We present an overview of findings from the project, which took place during typical UK sum-mertime pollution conditions. Emission ratios of volatile or-ganic compounds (VOCs) to acetylene and carbon monoxide emitted from the London region were consistent with mea-surements in and downwind of other large urban areas and indicated traffic and associated fuel evaporation were major sources. Sub-micron aerosol composition was dominated by secondary species including sulphate (24 % of sub-micron mass in the London plume and 29 % in the non-plume re-gional aerosol), nitrate (24 % plume; 20 % rere-gional) and or-ganic aerosol (29 % plume; 31 % regional). The primary
sub-micron aerosol emissions from London were minor com-pared to the larger regional background, with only limited in-creases in aerosol mass in the urban plume compared to the background (∼12 % mass increase on average). Black car-bon mass was the major exception and more than doubled in the urban plume, leading to a decrease in the single scatter-ing albedo from 0.91 in the regional aerosol to 0.86 in the London plume, on average. Our observations indicated that regional aerosol plays a major role on aerosol concentrations around London, at least during typical summertime condi-tions, meaning future efforts to reduce PM levels in London must account for regional as well as local aerosol sources.
1 Introduction
The greater London urban region is home to approximately 8–12 million people, making it the largest conurbation in the United Kingdom and one of a growing number of megacities throughout the world. Globally, over half of the world’s human population lives in urban areas, many of them
5164 G. R. McMeeking et al.: Trace gases and aerosols over London
megacities, and these numbers are expected to grow in the coming years. Megacities frequently have very high concen-trations of observed air pollutants (Banta et al., 2005), which combined with their large populations results in serious health and visibility impacts (Garland et al., 2008; Parekh, 2001). In addition to local impacts, the large emissions of pollutants from megacities make them important contribu-tors to air pollution on regional and global scales (Lawrence et al., 2007; Molina and Molina, 2004). Cities emit primary aerosols as well as oxides of nitrogen (NOx) and volatile
organic compounds (VOCs) that drive photochemical smog formation and also oxidise to secondary aerosol precursors.
The importance of megacity emissions has motivated sev-eral recent studies featuring a combination of measurements and numerical modelling to examine aerosol and trace gas emissions and atmospheric processing. These include the MILAGRO (Megacity Initiative: Local and Global Research Observations) (Molina et al., 2010) Mexico City case study in 2006 and the CalNex (Research at the Nexus of Air Quality and Climate Change) intensive measurement pe-riod in Los Angeles in 2010. In Europe, components of the MEGAPOLI (Megacities: Emissions, urban, regional and Global Atmospheric POLlution and climate effects, and Inte-grated tools for assessment and mitigation) project examined emissions from Paris, France in 2009 and 2010. It followed the original experiments conducted within the frame of the Etude et Simulation de la Qualit´e de l’air en region Ile-de-France (ESQUIF) program (Chazette et al., 2005; Menut et al., 2000). Results from these recent campaigns have under-scored the importance of oxygenated organic and secondary inorganic aerosol species to PM concentrations even in major urban locations (e.g., Aiken et al., 2009).
In London, the introduction of air quality control strate-gies going back to at least the early 1990s has led to reduc-tions in gas- and particle-phase pollutants (Bigi and Harri-son, 2010). Some species, including ozone (Bigi and Har-rison, 2010), have increased, while recent trends in PM2.5
and PM10 (particulate matter with aerodynamic diameters
<2.5 µm and 10 µm, respectively) concentrations have re-mained flat or even increased, despite predicted reductions from emissions inventories (Fuller and Green, 2006). Fur-ther reductions in PM have proved elusive. For example, the contribution from road transport was expected to decrease following the introduction of a number of control strategies, including the inner London congestion charge scheme, how-ever the impacts of the scheme and other control strategies on surface pollutant concentrations have been mixed (Atkin-son et al., 2009). The upcoming 2012 London Olympics has also drawn more attention to air quality in the London region and its potential effects on the games.
Previous measurements have provided valuable informa-tion regarding the chemical make-up and sources of PM in London, but did not provide a characterisation of background aerosol upwind of London nor described how London emis-sions affect aerosol properties downwind of the city.
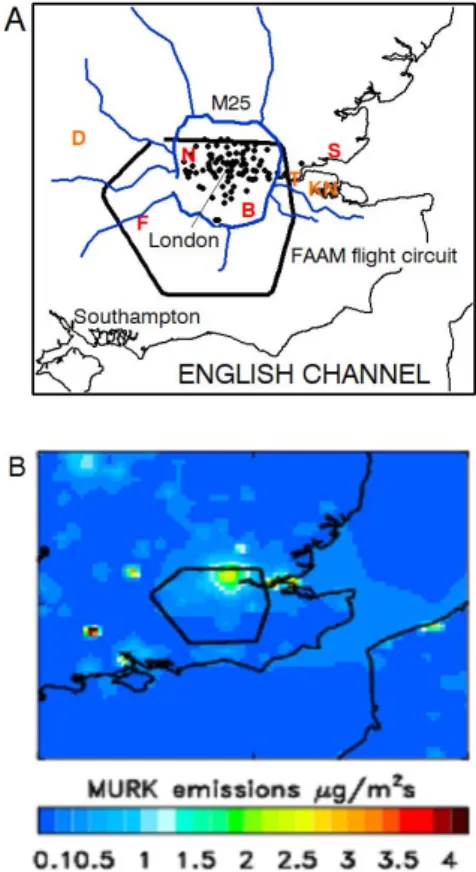
Ad-Fig. 1. Maps of south-eastern England showing: (a) location of the major motorway network (blue lines), London Air Quality Net-work observing sites (black circles), the main FAAM London cir-cuit flight track (black line), the locations of three large coal-fired power stations (orange letters: “D” = Didcot; “T” = Tillbury; “KN” = Kings North) and airfields used for missed approaches (red let-ters: “N” = Northolt; “F” = Farnborough; “B” = Biggin Hill; “S” = Southend) and (b) “MURK” emissions (a generic term for emis-sions that drive the aerosol field in the UK4 model forecast).
ditional measurements of aerosol chemical composition in London are needed to improve both our understanding of current trends in monitoring observations and to improve emission inventories. Better understanding of the contribu-tions from nitrate, sulphate and secondary organic aerosol (SOA) to regional background aerosol concentrations is also needed. Motivated by these needs, the EM25 (EMissions around the M25) project focused on aircraft-based in situ ob-servations of aerosols and trace gases and remotely sensed aerosol properties measured by a ground-based mobile lidar up- and downwind of Greater London. The mobile platforms travelled in circuits roughly encompassing the M25 motor-way “ring road”, shown in Fig. 1a. This approach allowed us to sample air upwind and downwind of London and compare the urban emissions with regional pollution moving over the city. Here we present an overview of major findings from the campaign to serve as a background for more detailed analy-ses of trace gas and aerosol properties.
Table 1. Summary of flights and synoptic conditions during the EM25 campaign.
Flight ID Date Time (UTC) Regions sampled Synoptic flow (850 hPa) B457 16 June 2009 09:10–14:00 M25 circuits only light westerly
B458 18 June 2009 09:50–14:45 M25 circuit and SE English coast strong westerly B459 22 June 2009 09:10–13:00 M25 circuits only stagnant/light northerly B460 23 June 2009 10:00–14:10 M25 circuits only light easterly
B461 24 June 2009 08:45–12:00 M25 and English channel strong easterly
London is located in south-eastern England in the United Kingdom (Fig. 1a) and has essentially a maritime climate. The major contributors to emissions in London depend on pollutant type. Road transport (52 % of total emissions in-cluding passenger cars, 17 %, and rigid heavy-duty vehicles, 13 %) and natural gas use (32 %) were the most important source types of nitrogen oxides (NOx) within the M25 in
2004 according to the London Atmospheric Emissions In-ventory (LAEI; Mattai and Hutchinson, 2008). Major VOC emission sources in the London region include the evap-oration of industrial solvents and petrol (45 % total VOC emissions), road transport (30 %), and agricultural or natural sources including urban parks (20 %). The main contributors to the sources of particulate matter in London are road traf-fic (producing primary aerosol from both exhaust and non-exhaust emissions), primary particles from industry, and sec-ondary particles from the oxidation of SO2, NOxand VOCs
emitted by traffic and industry (Harrison et al., 2004). Trans-port of regional PM, such as aged organic aerosol, also con-tributes to London aerosol mass concentrations in addition to the local sources (Allan et al., 2010).
2 Methods
The EM25 campaign took place between 16–24 June 2009 in and around the Greater London region. In addition to a num-ber of gas and aerosol long-term monitoring sites, the exper-iment featured two mobile measurement platforms, the UK Facility for Airborne Atmospheric Measurements (FAAM) modified BAe-146 research aircraft and a van fitted with a mobile lidar system, both described in detail below. The FAAM research aircraft flight tracks were designed to fol-low the M25 motorway as closely as possible at a minimum safe altitude of ∼750 m above ground level (a.g.l), but de-viated in the western and southern portions of the circuit to comply with air traffic control restrictions owing to the prox-imity of the Heathrow and Gatwick terminal manoeuvring areas. Vertical profiles were obtained during each flight by flying “missed approaches” into Northolt, Farnborough, and Southport airfields (Fig. 1), selected based on the prevailing wind direction to probe the atmosphere to ∼20 m a.g.l. The research flights and lidar van deployments were coordinated to allow simultaneous sampling for the dates listed in Table 1.
2.1 FAAM research aircraft and instruments
The FAAM research aircraft is a BAe-146 jet modified for atmospheric measurements and has participated in a large number of campaigns since 2004. Real-time measurements of carbon monoxide, nitrogen oxides and ozone were made by an Aero-Laser AL5002 VUV resonance fluorescence gas analyser, a chemiluminescence gas analyser (Thermo Scien-tific Model 42) and a UV photometric gas analyser (Thermo Environmental Instruments Inc., USA, Model 49C), respec-tively. Calibration procedures for the real-time gas analysers are described by Hopkins et al. (2006). Whole air canister samples were collected in 3 L silica coated stainless steel canisters (Thames Restek, UK) using an all-stainless steel assembly double headed bellows pump (Senior Aerospace, USA), which drew air from the main sampling manifold of the aircraft and pressurised air into canisters to a maximum pressure of ∼3 bar. Samples were usually collected over ap-proximately one minute intervals during selected portions of each flight. The samples were analysed off-line for VOCs us-ing a dual channel gas chromatograph with flame ionisation detection (Hopkins et al., 2011).
Aerosol composition measurements were made by an Aerodyne compact Time-of-Flight Aerosol Mass Spectrom-eter (cToF-AMS) (Canagaratna et al., 2007; Drewnick et al., 2005; Morgan et al., 2010b) and a DMT Single Particle Soot Photometer (SP2) (Baumgardner et al., 2004; McMeek-ing et al., 2010; Schwarz et al., 2006). The AMS pro-vided size-resolved chemical composition information for sub-micron, non-refractory particulate matter, classified as organic aerosol (OA), sulphate, nitrate, ammonium and non-sea salt chloride. The SP2 made size-resolved measurements of refractory black carbon (rBC) mass for “cores” between approximately 0.5–300 fg and also provided information re-garding the rBC mixing state for a subset of the measured particles (Moteki and Kondo, 2007). The AMS was cali-brated and data were analysed following the procedures de-scribed in detail by Morgan et al. (2010b). The SP2 data analysis followed the procedures described by McMeeking et al. (2010) and calibrations were performed using mobil-ity diameter-selected glassy carbon spheres and polystyrene latex spheres (PSL).
Aerosol number distributions were measured by a wing-mounted passive cavity aerosol spectrometer probe
5166 G. R. McMeeking et al.: Trace gases and aerosols over London Table 2. Summary of in situ trace gas and aerosol sampling instrumentation on the FAAM BAe-146 during the EM25 campaign.
Quantity measured Instrument Size range or wavelength Uncertainty
CO Aero-laser 5002 N/A ±1.5 ppbv at 100 ppbv
NO, NO2 Thermo model 42C N/A ±5 ppbv
O3 Thermo model 49C N/A ±3 ppbv
C2-C8volatile organic
com-pounds
whole air sampler (WAS) + off-line gas chromatography
N/A variable, see
Hopkins et al. (2011) aerosol composition and
mass
Aerodyne time-of-flight aerosol mass spectrome-ter (AMS)
∼50–800 nm ∼25 %, see
Canagaratna et al. (2007) refractory black carbon
aerosol mass
DMT single particle soot photometer (SP2)
∼70–600 nm ∼30 % for rBC, see Schwarz et al. (2008) aerosol optical diameter and
concentration
passive cavity aerosol spectrometer probe (PCASP-100X, SPP200); cloud aerosol spectrometer (CAS) 0.1–3 µm; 0.5–50 µm ±20 % (diameter) ±15 % (concentration)
aerosol concentration TSI 3786 water-based ultrafine condensa-tion particle counter (WCPC)
>3 nm ±12 %
dry aerosol light scattering coefficient
TSI 3563 integrating nephelometer
λ =450, 550, 700 nm ±10 %, see
Anderson et al. (1996) “wet” aerosol light scattering
coefficient
“wet” TSI 3563 integrat-ing nephelometer
λ =450, 550, 700 nm >10 % aerosol light absorption
coefficient
particle soot absorption photometer (PSAP)
λ =567 nm (corrected to 550 nm) variable, see Bond et al. (1999); Lack et al. (2008)
(PCASP-100X with SPP-200 hardware upgrade), which op-tically counted and sized particles between 0.1 and 3µ di-ameter. Particle size bins up to 0.8 µm were calibrated us-ing ammonium sulphate, which was converted to a PSL-equivalent diameter using Mie theory. Coarse mode aerosol and cloud hydrometeors in the size range 0.5–50 µm diame-ter were counted and sized using a DMT cloud aerosol spec-trometer (CAS) operating as part of a wing-mounted DMT cloud, aerosol and precipitation spectrometer (CAPS) probe. Daily checks of the CAS size calibration were performed using glass beads. Aerosol number concentrations (diame-ter >3 nm) were measured by a modified TSI 3786 ultrafine water-based condensation particle counter (WCPC).
Wet and dry aerosol light scattering (bsp) and ambient ab-sorption (bap) coefficients were measured by two TSI 3563 integrating nephelometers (Haywood et al., 2008a) and a particle soot absorption photometer (PSAP). The PSAP and nephelometer sample air through the same inlet and heat-ing associated with brheat-ingheat-ing the sample into the aircraft re-duces the sample RH. Measurements of RH at the neph-elometer inlet indicate the sample RH was typically be-low 30 % (Highwood et al., 2011). The dry and wet neph-elometer measurements were corrected for angular trunca-tion and non-Lambertian light-source errors using the sub-micron correction parameters provided by Anderson and
Ogren (1998). The nephelometer system performed scans be-tween 40–90 % relative humidity (RH) to determine the light scattering growth factor or f (RH) (Morgan et al., 2010a). The average scan cycle (up and down) took between 10– 30 min to complete. We corrected the scattering coefficients to ambient conditions based on the measured relative humid-ity and the average f (RH) response observed over the en-tire study. The PSAP measurements were corrected follow-ing Bond et al. (1999) to account for variations in the par-ticle deposit spot size, instrument flow rate and adjust the measurement to 550 nm wavelength for comparing with the 550 nm nephelometer wavelength.
All on-board aerosol instruments sampled ambient air via stainless steel tubing through Rosemount inlets. The in-let efficiency for super-micron particles is believed to be low (Haywood et al., 2003), so the aircraft measurements are thought to represent predominantly sub-micron aerosol properties. Aerosol number and mass concentrations, scat-tering and absorption coefficients are reported at standard temperature and pressure (STP) defined as 273.15 K and 1013.25 hPa. For clarity, these parameters are denoted us-ing an “s” (e.g., s m3) to distinguish them from ambient concentrations and coefficients. All real-time measurements were averaged to the approximately 30 s time resolution of the AMS or the sampling interval of the whole air canister
samplers, if collected. Table 2 summarizes the instruments and associated uncertainties used during the project.
2.2 Ground-based mobile LIDAR
We used a mobile Aerosol LIDAR System (ALS) to inves-tigate the aerosol vertical distribution around London. The ALS is a custom-built backscatter lidar emitting in the ultra-violet developed by the Commissariat `a l’Energie Atomique (CEA) and the Centre National de la Recherche Scientifique (CNRS) (Chazette et al., 2007). It is available commercially from the LEOSPHERE Company under the name of EZ Li-dar® (www.leosphere.com). It is designed to monitor the aerosol dispersion in the low and middle troposphere and op-erated with a Nd:YAG laser at the wavelength of 355 nm. The detection system had parallel and cross-polarised detec-tion channels. The resoludetec-tion along the line of sight was 15 m for a sampling of 1.5 m and had an overlap factor close to 1 at approximately 150 m above the ground level.
The primary ALS measurement is the backscatter coeffi-cient measured at 355 nm, which has both molecular (i.e., gas-phase) and aerosol contributions. It is mounted in a small vehicle allowing it to follow small atmospheric features (Raut and Chazette, 2009; Royer et al., 2011b), provide infor-mation regarding the vertical distribution of aerosols around London by following a set loop following the M25 ring-road or beltway, and could examine the role of the M25 traffic in the production of anthropogenic aerosols. The lidar sig-nals have been calibrated, corrected from the background sky radiance and range-corrected. We retrieved aerosol extinc-tion coefficients from the measured backscatter coefficients following the procedures described by Raut and Chazette (2007) and Royer et al. (2011a), assuming a lidar ratio of 45.5 sr. Extinction coefficients were estimated at 550 nm by assuming an ˚Angstr¨om exponent of 1.5. Uncertainties asso-ciated with the retrieval of aerosol extinction coefficient at 355 nm were due to four main sources: (a) statistical fluc-tuations of the measured signal, associated with the random detection process, (b) uncertainty in the lidar signal in the al-titude range used for the normalization, (c) the uncertainty of the a priori knowledge of the vertical profile of the molecu-lar backscatter coefficient as determined from ancilmolecu-lary mea-surements and (d) the uncertainty in the backscatter to extinc-tion ratio (or lidar ratio) and its altitude dependence. Chazette et al. (2010) discuss the different sources of uncertainty and conclude that there is an absolute error of approximately 0.01 km−1in the retrieved aerosol extinction coefficient. We
assumed a lidar ratio of ∼45 sr based on similar retrievals of extinction coefficients in a polluted boundary layer in Paris (Chazette et al., 2012).
2.3 Ground-based fixed measurements
In addition to the aircraft and ground-based lidar ments, we used three networks of ground-based
measure-ments across London to provide information on aerosol dis-tribution within the circuits performed by the mobile mea-surements. The first was a well-established network of air quality measurements run by the London Air Quality Net-work (http://www.londonair.org.uk) (Atkinson et al., 2009; Fuller and Green, 2006), which includes measurements of PM10concentrations at most stations, and PM2.5at a subset
of these measured with a Tapered Element Oscillating Mi-crobalance (see Fig. 1a). The stations represent a variety of site types, including suburban, urban background, industrial, roadside and kerbside locations. Second, we analysed data from a new network of weather stations which was set up as part of the OPen Air Laboratories (OPAL) project (Davies et al., 2011). The weather stations are Davis Vantage Pro2 Plus automatic weather stations measuring standard meteo-rological variables, although during EM25 measurements of solar irradiance were used to infer column aerosol loadings on clear days (Ryder and Toumi, 2011). The third network in-cluded two locations that are part of the UK Automated Hy-drocarbon Network, a kerb-side site (Marylebone Road) and a suburban site (Eltham). Both sites feature automatic Perkin Elmer gas chromatograph systems measuring over 25 differ-ent hydrocarbon species (http://www.uk-air.defra.gov.uk).
3 Results and discussion 3.1 Meteorology and transport
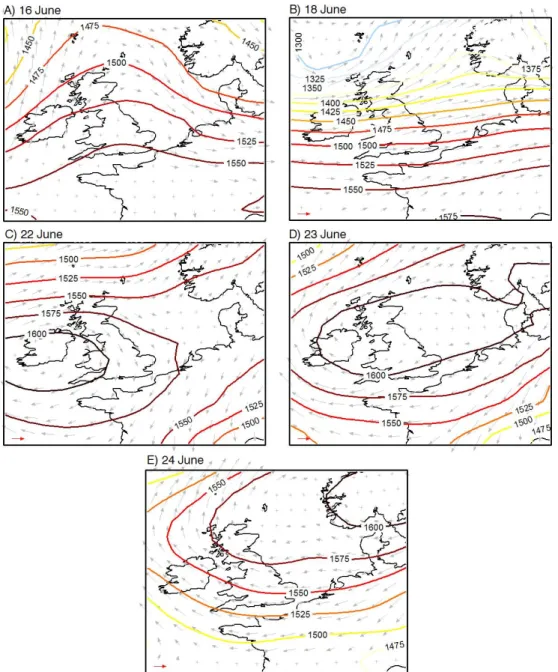
Flight operations during the June 2009 EM25 campaign win-dow targeted polluted conditions to assess pollution transport into and out of the London region. Meteorological conditions during the five flight days are summarized in Fig. 2, which shows the 850 hPa geopotential height fields and 850 hPa pressure level winds from the ECMWF ERA Interim re-analysis. The first two flights on 16 and 18 June took place before and after the passage of a precipitating cold front over the UK. The 850 hPa pressure-level winds on 16 June over the London region were light and variable, though gener-ally westerly or southwesterly, changing to westerly on 18 June following the passage of a front the previous night. The final three flights took place between 22–24 June, when a high pressure system moved eastwards from southern Ireland to southern Norway. Flow over the London region changed from light northerlies on 22 June to easterlies on 23–24 June. There were usually scattered fair weather cumuli clouds over the study region with no precipitation on flight days, though cloud base was above the flight measurement altitude for all but a few brief periods, which have been removed from the analysis.
We examined aerosol mass concentrations measured by the ground stations to provide context for the aircraft mea-surements during the EM25 campaign. Figure 3 shows PM2.5
concentrations from the London ground stations shown in Fig. 1a with summertime (June/July) mean values for the
5168 G. R. McMeeking et al.: Trace gases and aerosols over London
Fig. 2. Maps showing geopotential height and winds from the ERA Interim ECMWF re-analysis at the 850 hPa pressure level at 12:00 UTC for each flight day. Red arrow in lower left-hand corner indicates 10 m s−1wind speed.
period 2005–2009. Mass concentrations were near or slightly below their July/July 2005–2009 averages (approximately 15 µg m−3) from 16 June to 22 June. PM
2.5 concentrations
then increased to above average (20 µg m−3), reflecting the
change from predominantly westerly to easterly winds and associated transport of pollution from continental Europe (Bigi and Harrison, 2010).
Forecast aerosol mass concentrations from the 4 km res-olution operational numerical weather prediction (NWP) model (Clark et al., 2008; Haywood et al., 2008b) showed transport patterns and expected pollution “hotspots” in the London area. In addition to providing standard
meteorolog-ical variables such as temperature, humidity, cloud and pre-cipitation fields, the UK4 model included a highly simplified representation of aerosol emission, transformation, and de-position (Clark et al., 2008). Sources of aerosol were based on the European emission inventory on a 1/8 degree by 1/16 degree grid developed for the GEMS project by Visschedijk et al. (2007) plus ship emissions from the European Monitor-ing and Evaluation Programme (EMEP) emissions database for 2005. The aerosol was represented by a single tracer (generically termed “murk”) which approximately accounted for sources from SO2, NOx and VOCs by using a factor
Fig. 3. Time series showing PM2.5concentrations during the EM25 campaign period in 2009. Heavy black line shows London average for
all PM stations over the EM25 campaign and grey shading shows one standard deviation of the average. Solid red line shows the June/July historical London average PM2.5 concentration from 2005 to 2009 (all station classifications) and dashed red lines show two standard
deviations. Flight identification numbers indicate days when the FAAM BAe-146 research aircraft flew circuits over London. Date ticks are labelled at 00:00 UTC for that day.
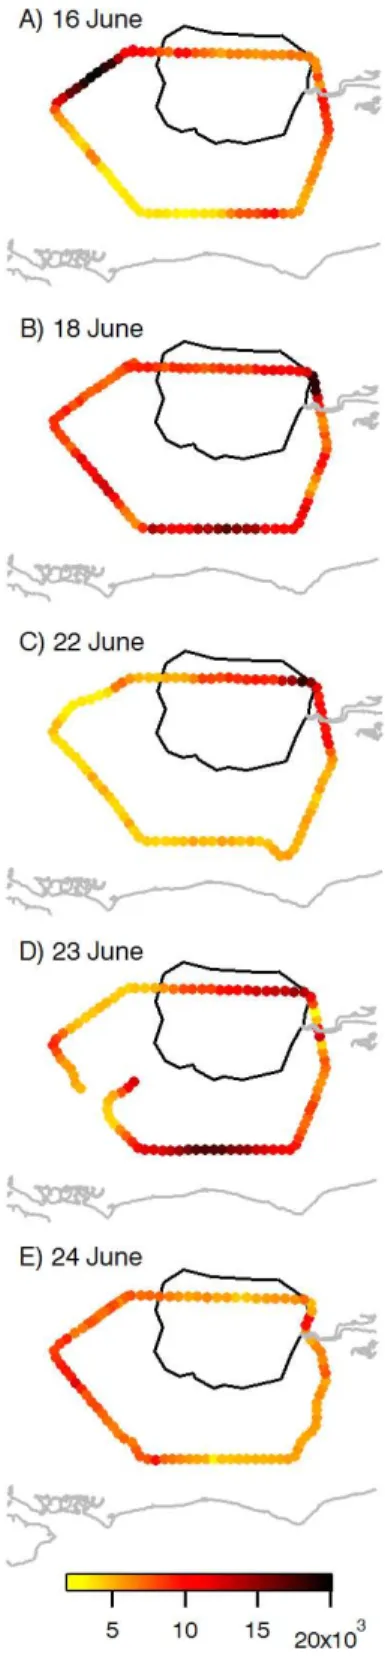
Fig. 4. Aerosol mass mixing ratios predicted at the 760 m altitude by the UK 4km visibility model for selected times during each flight day. Arrows indicate wind speed and direction at the predicted level. The “R” indicates the location of the city of Reading and “L” indicates the location of central London. Flight tracks for each day are shown by filled circles, shaded by total aerosol mass measured on the aircraft. Aircraft mass concentrations are shaded similar to model fields but multiplied by a factor of four.
5170 G. R. McMeeking et al.: Trace gases and aerosols over London
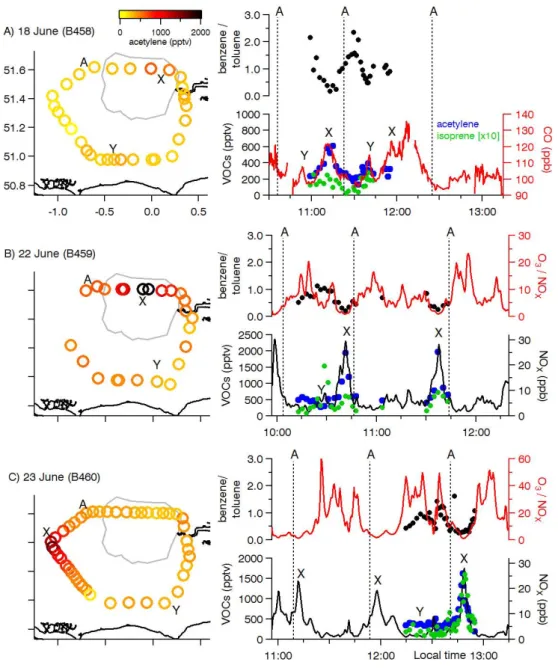
Fig. 5. Mixing ratios for acetylene (C2H2), isoprene, nitrogen oxides (NOx), carbon monoxide and ratios of ozone-to-nitrogen and
benzene-to-toluene measured around London for three EM25 flights. NOxmixing ratios were unavailable for the 18 June flight so CO is shown
instead. The approximate location of the London plume is indicated by “X”. Additional features of interest are shown by “Y”. Point “A” on each map corresponds to the dashed lines on each time series. The flight direction for all days was anti-clockwise.
aerosol within the model domain. The emission fields used by the model are shown in Fig. 1b. The aerosol concentra-tion was used along with a mean hygroscopic growth factor to provide forecasts of atmospheric visibility (Haywood et al., 2008b). The hygroscopic growth factor used was based on nephelometer data from previous flight campaigns. Varia-tional data-assimilation of observed visibilities were used to correct the model fields of aerosol mass concentration and relative humidity (Clark et al., 2008).
Snapshots of the predicted aerosol mass distribution to-gether with segments of flight tracks shaded according to
aircraft-measured sub-micron aerosol mass concentrations are shown in Fig. 4 for illustrative purposes timed at ap-proximately the middle of aircraft circuits. At the 760 m model level nearest to the aircraft altitude during circuits, the highest aerosol emissions were predicted to be around London. The predicted plume advected southeast and east for the northwesterly and westerly flights (16 and 18 June; Fig. 4a and b), west for the two easterly flow cases (23 and 24 June; Fig. 4d and e) and remained over the Lon-don region and slightly to the north for the stagnant 22 June flight (Fig. 4c). Plumes from the Southampton area to the
southwest of London may have reached the flight track for the 16 and 18 June flights. The visibility model also showed emissions from the coal-fired Didcot power station (shown in Fig. 1a) possibly reaching the flight track on 16, 22 and 23 June. The model predicted the highest and lowest aerosol concentrations over London on 22 and 18 June, respectively. We classified different portions of each flight as either “plume”, “regional” or “upwind” based on measurements of rBC mass concentrations from the SP2 and predicted wind fields. Plumes were defined as regions having rBC mass concentrations greater than the 75th percentile for the flight downwind of London. Upwind regions were deter-mined from model predicted wind fields while regional sam-ples included all periods when rBC mass concentrations were below the 75th percentile, including upwind regions.
3.2 Trace gas measurements
Three flights (B458, B459 and B460) had valid trace gas measurements from the whole air sampling system, shown in Fig. 5. Major features, such as increases in VOCs, were consistent during repeat flight circuits. All circuits had peaks in CO (and NOxif measured) mixing ratio(s) and decreases
in the ozone mixing ratio when the aircraft was in the Lon-don plume, denoted by the letter “X” in Fig. 5a–c. Mixing ratios of CO have a background contribution that we esti-mated from the intercept of the regression of CO on rBC measured by the SP2. Background CO values were between 90–98 ppb and we subtracted these background values to obtain excess mixing ratios for CO for each flight (1CO). Acetylene (C2H2) was elevated in the London plume and was
highly correlated with CO (r2= 0.86) and NOx(r2= 0.79).
Acetylene is primarily emitted as vehicle exhaust (Fortin et al., 2005) and has a relatively long atmospheric lifetime of approximately 2 months with respect to oxidation by OH (Atkinson, 2000). Figure 5 also shows the ratio of benzene-to-toluene, which is commonly used to determine the air mass photochemical age because of the different atmospheric lifetimes of the two species (e.g., Warneke et al. 2007). The regions with low benzene/toluene ratios and elevated pollutant concentrations coincided with the location of the aerosol plume predicted by the UK visibility model and ex-pected based on flow patterns from the synoptic re-analysis, i.e., downwind of London. We also observed elevated CO and VOC concentrations away from the London plume to-gether with increased ozone relative to NOx. These
loca-tions had slightly higher benzene/toluene ratios, suggesting they were more aged regional pollution or aged plumes from non-London sources encountered by the aircraft. We identify these features for selected flights in Fig. 5a–c using the letter “Y”.
We estimated initial emission ratios for various VOCs relative to acetylene and CO using a simple linear regres-sion approach. Other methods compare VOC ratios to pho-tochemical age (tphoto) to account for changes in VOC
con-Table 3. Emission ratios for selected volatile organic compounds with respect to acetylene measured and associated coefficient of variation for all EM25 samples and for the subset with photochem-ical age less than 20 hours. Atmospheric lifetimes with respect to oxidation by OH at a concentration of 2×10⁶molecules cm−3 re-ported by Atkinson (2000) are listed for selected species.
compound τ X/C2H2 r2 X/C2H2 r2 all tphoto<20 h acetylene 2 mo 1.0 1.0 1.0 1.0 ethane 3 mo 3.09 0.86 3.41 0.85 n-butane 4.7 d 1.27 0.75 1.21 0.97 propane 10 d 1.24 0.43 1.31 0.96 iso-butane 7.5 d 0.74 0.86 0.71 0.97 iso-pentane 5 d 0.73 0.57 0.57 0.54 toluene 1.9 d 0.55 0.90 0.47 0.86 ethene 1.4 d 0.52 0.77 0.45 0.82 m+p-xylene 5.9 h 0.27 0.84 0.27 0.91 n-pentane 5 d 0.23 0.32 0.19 0.43 2, 3-methylpentane 0.19 0.67 0.18 0.93 benzene 9.4 d 0.11 0.91 0.11 0.93 propene 5.3 h 0.10 0.60 0.10 0.91 ethylbenzene 0.07 0.51 0.08 0.78 n-hexane 0.07 0.61 0.07 0.85 isoprene 1.4 h 0.06 0.35 0.04 0.18 cyclopentane 0.05 0.55 0.04 0.86 o-xylene 0.03 0.01 0.04 0.01 1-butene 0.02 0.50 0.01 0.28 trans-2-butene 2.2 h 0.01 0.38 0.01 0.67 cis-2-butene 0.00 0.46 0.00 0.40
centrations with time due to photochemical reactions (e.g., Warneke et al., 2007). We also calculated emission ratios using the photochemical age method, but only report the linear regression results because of uncertainties in the ini-tial benzene-toluene ratio at the source region and the OH radical concentrations. We did use an estimate of photo-chemical age to examine aerosol properties as a rough func-tion of time and to provide a second set of emission ratios restricted to samples with photochemical age of less than 20 h to better represent the London emissions. We estimated the photochemical age by assuming a concentration of hy-droxyl radical (2×10⁶molecules cm−3) and an assumed ini-tial toluene/benzene ratio of 5 for London needed for the calculation. The absolute accuracy of the photochemical age was not critical to the analysis because we sought to roughly distinguish fresh and aged air masses. We performed the cal-culations for data combined from all three flights where VOC data from whole air samplers were available (18, 22, and 23 June).
Emission ratios of various VOCs to acetylene determined from linear regression are listed in Table 3 together with an associated measure of correlation (Pearsons r2) for all sam-ples and for those with photochemical age less than 20 h. We compared emission ratios calculated for the “fresh” Lon-don emissions (tphoto<20 h) to several previously published
5172 G. R. McMeeking et al.: Trace gases and aerosols over London
Fig. 6. Selected volatile organic compound (VOC) emission ratios to acetylene (C2H2) measured on the FAAM BAe-146 research aircraft
for samples with photochemical age less than 20 h, at ground sampling sites in London, and by previous measurement campaigns. Bos-NYC refers to emission ratios measured in the outflow of the north-eastern US reported by Warneke et al. (2007), exhaust refers to vehicle exhaust emission ratios reported by Harley et al. (1992), and the London (kerbside) and London (suburban) data were obtained from the Marylebone Road and Eltham automated hydrocarbon monitoring network locations for June/July 2008–2010. Points are shaded by VOC family as alkanes, alkenes and aromatics. The solid line gives the 1:1 relationship and the dashed lines 2:1 and 1:2 relationships; all axes are log-scaled and identical.
emission ratios for cities in the north-eastern US (Warneke et al., 2007), emissions directly measured from petrol ve-hicle exhaust (Harley et al., 1992) and ratios we calculated from measurements at two automatic hydrocarbon monitor-ing sites in London. The London monitormonitor-ing locations were Marylebone Road in central London, which is classified as a kerb-side site, and Eltham in eastern London, which is clas-sified as a suburban site. We calculated emission ratios by re-gressing selected VOCs against acetylene for measurements in June and July between 2008 and 2010 to compare to our June 2009 aircraft observations because both London sites had measurement gaps during the EM25 campaign.
We compare VOC to acetylene emission ratios from dif-ferent studies and sites to each other in Fig. 6. Each row and column in the figure contains a scatter plot that com-pares VOC to acetylene ratios measured at a particular site or for a particular study to another site or study. For example
Fig. 6f compares VOC ratios measured for vehicle exhaust by Harley et al. (1992) to those measured downwind of the north-eastern US by Warneke et al. (2007). VOC emission ratios to acetylene measured by the aircraft were correlated with those determined for the London monitoring sites (Fig-ures 6g and 6h), but the ratios measured at the ground sites were approximately twice those measured aloft. We suspect these differences arise from the larger influence of entrain-ment on the aircraft measureentrain-ments and the different lifetimes of the VOCs. Short-chain alkanes (particularly ethane and propane) measured at the Marylebone Road site were the exception to this trend, having much lower ratios compared to those measured by the aircraft and at the suburban site (Fig. 6a and g). The short alkanes have a large evaporative fuel contribution and previous studies have suggested that this explains the lower ratios observed downwind of urban re-gions compared to vehicle emissions (de Gouw et al., 2005).
Fig. 7. Number concentrations for particles with Dp>3 nm
mea-sured by the ultrafine water-based condensation particle counter for single circuits around London during each flight. Note scale on panel (d) has been adjusted by a factor of 2 (maximum N= 40 000 cm−3) to better illustrate the variability along the flight path.
The aircraft alkane to acetylene emission ratios were lower than those measured at the suburban Eltham site (Fig. 6h), which is less vehicle emission dominated than the Maryle-bone Road location. The alkane to acetylene emission ratios were also statistically less certain because of the low coeffi-cients of variation observed in both the aircraft and ground monitoring site data.
Warneke et al. (2007) concluded that emissions of aromat-ics and alkenes are dominated by vehicle exhaust, at least for urban areas in the north-eastern US, based on the relatively good agreement between emission ratios to acetylene mea-sured for urban outflow and those reported for petrol engine vehicle exhaust by Harley et al. (1992) (Fig. 6f). We found similar agreement between aircraft-measured and vehicle ex-haust emission ratios for aromatics, but poorer agreement for alkene emissions (Fig. 6j), which may arise from the influ-ence of the entrainment of air with lower alkene-to-acetylene ratios on the aircraft measurements. Alkene to acetylene emission ratios measured at both London ground sites were in excellent agreement with vehicle exhaust (Fig. 6d and e), suggesting that increasing differences in fleet composition in the US and Europe are not affecting emission ratios. For example, diesel consumption in the Greater London region in 2009 was approximately equal to that of petrol (UK De-partment of Energy and Climate), but it was approximately 15 % of petrol consumption in California in the first quarter of 2011 (California State Board of Equalization).
Despite differences in timing, sampling method and ana-lytical approach, we observed VOC to acetylene emission ra-tios in London outflow that are within a factor of two of those reported for the north-eastern US by Warneke et al. (2007) (Fig. 6i). They reported observations within a factor of two of those reported for 39 US cities by Seila et al. (1989). These findings provide further support to recent analyses that indicate VOC to acetylene emission ratios from cities, at least in the locations that have been characterised, are gener-ally consistent, despite differences in location, vehicle fleets, and photochemical environments. For example, Parrish et al. (2009) compared relationships between different VOC mixing ratios for observational datasets collected in several mega-cities and in many US cities. They found nearly iden-tical (0.29–0.31) benzene-acetylene ratios in Mexico City, Tokyo, Beijing and 71 US cities (measured in the 1980s), but lower ratios for recent measurements in the north-eastern US (0.17). von Schneidemesser et al. (2010) found yearly-averaged benzene-acetylene ratios for 2000–2008 between 0.17–0.29 for London. Benzene-acetylene ratios we mea-sured in London outflow were even lower than reported for the north-eastern US (0.11) however the ratios determined for the ground site locations were higher, between 0.3–0.5. Parish et al. (2009) attributed the lower ratios observed in the north-eastern US to targeted benzene reductions following the 1990 Amendments to the Clean Air Act. Similar ben-zene emission reductions were implemented in the UK in the 1990s and benzene levels in the UK were dropping by
5174 G. R. McMeeking et al.: Trace gases and aerosols over London
approximately 20 % per year until at least 2005 (Dollard et al., 2007). Our own analysis of Marylebone Road data indi-cated that the ratio of benzene to acetylene since 2000 was approximately constant at ∼0.2 until 2008 but has increased to approximately 0.4 since then, which may be related to changes in the vehicle fleet in London. According to Parrish et al. (2009), the similar ratios for various megacity VOC emission ratios across the world result from a combination of the fact that vehicular emissions and associated fuel evap-oration dominate emissions and that the hydrocarbon com-position of petrol and exhaust emissions is consistent over these urban areas. Though there are some discrepancies in emission ratios measured by the aircraft and those from the ground-based monitoring stations, we found no evidence of a major difference between the London emission ratios and those reported for other highly-developed urban regions.
Isoprene is a major biogenic VOC that also has both vehic-ular and other anthropogenic sources. Langford et al. (2010) performed eddy covariance VOC flux measurements over London and also analysed long-term Marylebone Road VOC observations to conclude that as much as 80 % of isoprene in London has biogenic sources on warm (30◦C) days. We compared isoprene to benzene (not shown) to identify pe-riods of the flight when isoprene became elevated with re-spect to benzene. Two portions of different flights showed large increases in isoprene mixing ratios in the absence of changes in benzene and other anthropogenic pollution trac-ers, both occurring over the southern portion of each flight circuit (Fig. 5). We believe both of these events were associ-ated with increased emissions from the more rural landscape south of the M25 region rather than emissions from London itself based on the wind flow patterns during each flight. We also observed increases in isoprene mixing ratios over Lon-don that were coincident with increases in benzene. Average maximum temperatures in London on the days of our mea-surements were between 18–25◦C, which corresponds to a 20–60 % expected temperature-dependent/biogenic isoprene contribution (Langford et al., 2010). We observed slightly higher isoprene relative to benzene on 23 June (maximum temperature ∼25◦C) compared to 22 June (maximum tem-perature ∼22◦C) consistent with this view. A recent analysis by von Schneidemesser et al. (2011) has shown that despite recent reductions in anthropogenic non-methane hydrocar-bons (NMHCs) the contribution of isoprene to NMHC OH reactivity has not gained importance in urban London. They attribute this result in part to the fraction of isoprene emitted by anthropogenic sources.
3.3 Aerosol physical properties
Aerosol number distributions measured by the PCASP and CAS wing-mounted probes had a dominant accumulation mode (centred at approximately 0.17 µm)with only minor contributions from coarse particles (optical diameter >1 µm) to total number and volume in the London circuits. The
campaign-average standard deviation of the number distribu-tions was best represented by a log-normal distribution with mean diameter 0.17 µm and a standard deviation of 1.4. We observed little change in aerosol number size distributions around the circuit, consistent with relatively homogeneous sub-micron aerosol mass concentrations and light scattering coefficients that were measured by the AMS and nephelome-ter, respectively. Kleinman et al. (2009) conducted size distri-bution measurements over Mexico City and observed minor changes in the size distribution but did observe changes in the number of particles in the accumulation mode that were correlated with changes in particle mass and carbon monox-ide. Changes in total number concentrations measured by the ultrafine CPC (diameter >∼3 nm) partly reflected changes in sub-0.1 µm particles because they dominate number dis-tributions, giving us some indication of their distribution around London during the flights. The regions of high par-ticle number concentrations shown in Fig. 7 were not al-ways co-located with the urban plume identified from the rBC mass concentrations. We observed a correlation between particle concentrations and sulphur dioxide (SO2) mixing
ra-tios, particularly downwind of coal-fired power plants in the vicinity of London, including the Didcot, Tilbury and Kings North power stations shown in Fig. 1b. These observations were consistent with the well-documented formation of fine sulphur containing particles downwind of SO2sources (e.g.,
Hewitt, 2001) and indicate that at least under typical sum-mertime conditions power plant can have a similar contribu-tion to particle number as the urban emissions in the London area.
Aerosol dry scattering coefficients were correlated with to-tal sub-micron mass (sum of AMS mass and SP2 rBC) for all five flights (Pearson’s r2= 0.70). The ratio of dry scat-tering coefficients measured at λ = 550 nm to sub-micron mass yielded a study-average mass scattering efficiency of 3.4 m2g−1, consistent with values expected for sub-micron dominated mixtures of OA, ammonium sulphate and ammo-nium nitrate and similar to the dry mass scattering efficiency of 3.6±1.3 m2g−1reported for PM2.5over the eastern United
States (Shinozuka et al., 2007). We also calculated the scat-tering and absorption coefficients from size distributions us-ing Mie theory. The bulk, campaign-average aerosol refrac-tive index and density, estimated from particle composition data by a volume-weighted mixing approach, were 1.59– 0.022i and 1.63 g cm−3, respectively. The average mass scat-tering efficiency determined from the Mie calculations was 3.5 m2g−1, in agreement with the measured value. The
scat-tering efficiency around London was lower than the range of 4.5–5.9 m2g−1for urban aerosols retrieved over the Paris region by Raut and Chazette (2009).
The humidity-dependence of light scattering coefficients (f (RH)) over London was generally weaker than that mea-sured by the same equipment for a sulphate dominated aerosol over the eastern Pacific, shown in Fig. 8. The f (RH) was similar to that retrieved by Randriamiarisoa et al. (2006)
Fig. 8. Campaign-averaged ratios of humidified-to-dry corrected light scattering coefficients for 550 nm as a function of relative humidity during the EM25 (London, black) and VOCALS (south-eastern Pacific, red, Allen et al., 2011) campaigns. Solid lines in-dicate the median values and the shaded region shows the inter-quartile range. Dashed line shows no change in light scattering upon humidification.
for air masses passing over Paris that originated from the UK. Shinozuka et al. (2007) measured f (RH) over North Amer-ica and parameterized the scattering response measured at RH1= 40 % and RH2= 80 % using: f (RH) = 1 − RH1 100 1 −RH2 100 !−γ (1)
where γ captures the effects of chemistry, mixing state, size and refractive index. We found thatγ ∼0.3 best fit the aver-age f (RH) observed over London, which is near the lower range of the Shinozuka et al. (2007) column-averaged val-ues. The lower humidity-dependence of scattering was also consistent with higher mass fractions of relatively hydropho-bic OA measured over London compared to the eastern Pa-cific (Allen et al., 2011), which have been shown in labora-tory studies to suppress hygroscopic growth when internally mixed (e.g., Svenningsson et al., 2006). The growth factor differed from ∼2/3 of the ammonium sulphate-dominated aerosol sampled over the Pacific, showing the importance of treating the aerosol as an internal rather than external mix-ture.
Aerosol absorption coefficients were correlated with rBC mass concentrations measured by the SP2 for all five flights (Pearson’s r2= 0.67). The regression for all non-profile mea-surements yielded an rBC mass absorption efficiency (MAE) at 550 nm of 10.4 m2g−1, higher than the 7.5±1.2 m2g−1
value recommended by Bond and Bergstrom (2006) for un-coated BC particles. Subramanian et al. (2010) reported an MAE of 13.1 m2g−1for rBC measured by an SP2 and a 3-wavelength PSAP over and downwind of Mexico City. Their MAE included an SP2 mass scaling factor of 1.3 to account for rBC mass falling outside the detection range of the instru-ment. When we applied the same correction to our data, we obtained an MAE of 7.8 m2g−1for London, almost a factor
Fig. 9. Campaign-averaged ratios of humidified-to-dry corrected light scattering coefficients for 550 nm as a function of relative humidity during the EM25 (London, black) and VOCALS (south-eastern Pacific, red) campaigns.
of two lower than that observed over and downwind of Mex-ico City. Baumgardner et al. (2007) reported a lower MAE of 5 m2g−1from an SP2 and PSAP in Mexico City than we ob-served, but their observations were made on the surface and very close to rBC sources. Both field (Lack et al., 2008) and laboratory (Cappa et al., 2008) observations have shown that the PSAP measures erroneously high absorption coefficients for high OA loadings, so the lower MAE observed by the PSAP/SP2 combination over London may be partially due to the lower contribution by OA to sub-micron aerosol mass (∼30 %) around London compared to roughly 60 % contri-bution observed over Mexico City (DeCarlo et al., 2008).
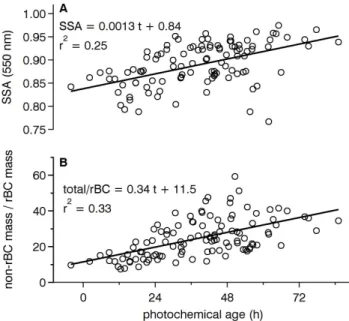
We calculated the aerosol single scattering albedo (SSA), the ratio of the light scattering coefficient to the light extinc-tion (scattering plus absorpextinc-tion) coefficient, from the cor-rected PSAP and nephelometer observations at λ = 550 nm around each circuit. The SSA decreased to 0.85±0.03 (mean
±1 standard deviation) in the London plumes from a higher regional background of 0.91±0.05 (Table 4), which was con-sistent with the higher light-absorbing rBC mass fractions in the plume compared to background regions of the cir-cuit. Raut and Chazette (2007) obtained similar behaviour within and outside of the Paris plume. We investigated the timescales for increases in SSA by comparing its measured values to photochemical age for periods with valid whole air canister samples, shown in Fig. 9. Single scattering albedo increased from approximately 0.84 at t = 0 to approximately 0.95 at t ∼ 3 days, consistent with the plume versus non-plume differences and the addition of secondary material in-cluding SOA indicated by the increase in the OA/1CO and
5176 G. R. McMeeking et al.: Trace gases and aerosols over London
Fig. 10. Mass concentrations of AMS- and SP2-measured species averaged over London plume (p), upwind of London segments (u) and regional segments (r) for each flight as well as the campaign-averaged values for each category. Black numbers indicate the mass fraction (%) of each species relative to the corresponding total sub-micron mass.
sub-micron mass/1CO ratios with photochemical age. The regression of SSA on photochemical age yielded an increase of 0.0013±0.0002 h−1, but there was considerable variability
(r2= 0.25). The total sub-micron mass measured by the AMS normalized by rBC increased from roughly 10 g g−1BC to as
much as 50 g g−1BC after 40 h, with an average increase of 0.34±0.05 h−1(r2= 0.33).
The addition of secondary material and coagulation pro-cesses can lead to changes in the rBC mixing state and coat-ing thickness (Moteki et al., 2007; Schwarz et al., 2008; Sub-ramanian et al., 2010), so we compared one measure of rBC mixing state, the number fraction of “thickly coated” parti-cles to photochemical age. The number fraction of “thickly coated” particles increased from approximately 0.18 at t = 0 to a maximum of approximately 0.3 at t = 45 h, but there was considerable variability in the data. The average in-crease was approximately 0.08 % h−1, significantly lower than 2.3 % h−1 reported by Moteki et al. (2007).
Subrama-nian et al. (2010) also calculated rates of increase in the thickly coated fraction of 0.2–0.25 % h−1 over and
down-wind of Mexico City, closer to our reported values. One im-portant distinction between our results and those reported by Moteki et al. (2007) and Subramanian et al. (2010) in addi-tion to differences in aerosol and photochemical environment was that we considered the entire rBC population but the pre-vious studies restricted their analyses of the conversion rate
to thickly coated rBC to particles within a specific mass/size range. There was no evidence of observed changes in rBC mixing state with time causing higher mass absorption effi-ciencies, which might be expected (Bond et al., 2006). This may have been due to different rBC sources to the plume and non-plume regions sampled, measurement artefacts as-sociated with the PSAP light absorption measurement, or changes in rBC structure. See McMeeking et al. (2011) for a more detailed discussion.
3.4 Aerosol chemical properties
The sub-micron aerosol mass concentrations for the ma-jor chemical components are summarized for all flights in Fig. 10 and details for specific circuits are shown in Fig. 11. Total sub-micron mass (calculated from the total mass of aerosol measured by the AMS plus rBC measured by the SP2) was relatively homogeneous around the circuit for all flights. On average, the sub-micron aerosol mass concentra-tions were about 12 % higher in the plume compared to the regional air and for individual flights were higher than re-gional values for all but the 24 June flight. Mass concen-trations were between 4–8 µg sm−3 for the 16 and 18 June flights and between 8–20 µg sm−3, for the 22–24 June flights. The higher aerosol mass loadings on the 22–24 June flights resulted from transport of pollution from continental Europe, consistent with the elevated CO mixing ratios also observed.
Fig. 11. Examples of aerosol sub-micron mass concentrations measured during a single circuit around London for each flight. Also shown are time series for altitude (grey), nitrogen oxides (black), carbon monoxide (red), aerosol sulphate (red), nitrate (blue), organics (green), ammonium (orange), and refractory black carbon (grey) measured by the AMS and SP2. The time series are restricted to periods when the aircraft was flying circuits around London. Shaded regions and outlined circles indicate regions identified as either in plume or upwind based on air mass classification method described in the text.
5178 G. R. McMeeking et al.: Trace gases and aerosols over London Table 4. Average OA/1CO, rBC/1CO, single scattering albedo (SSA) and mass absorption efficiency (MAE) for plume and non-plume periods determined from the photochemical age calculated from whole air canister toluene and benzene mixing ratios. Only flights with valid canister data are listed.
Date Flight ID OA/1CO [µg sm−3ppmv−1] rBC/1CO [ng sm−3ppbv−1] SSA MAE [m2g−1] # samples Plumes (tphoto<20 h) 18 June B458 13 13.1 0.86 6.0 2 21 June B459 6.8±6.5 8.6±2.0 0.88±0.03 11.6±1.5 6 22 June B460 8.1±3.2 12.0±1.8 0.84±0.03 9.1±0.8 12 Average 9.3±3.3 11.2±2.3 0.86±0.02 8.9±2.8 20 Non-plume/background (tphoto>50 h) 18 June B458 54±11 11.0±1.5 0.93±0.03 9.2±1.9 17 21 June B459 30±19 10.3±1.9 0.94±0.007 3.7±2 5 22 June B460 64±9 9.3±0.8 0.86±0.04 5.9±8.4 8 Average 49±17 10.2±0.9 0.91±0.04 6.3±2.8 30
The lowest aerosol mass concentrations occurred on 18 June during a period of strong westerly flow following passage of a cold front.
Averaged over the campaign the aerosol in the London plume had roughly equal contributions from nitrate, OA and sulphate with lower contributions from ammonium and rBC. The average contributions from each species to total sub-micron mass in the London plume were approximately 6 % for rBC, 24 % for nitrate, 17 % for ammonium, 24 % for sul-phate, and 29 % for OA. The regional air masses had slightly higher contributions from OA and sulphate and less nitrate (3 % for rBC, 20 % for nitrate, 17 % for ammonium, 29 % for sulphate, and 31 % for OA). Aerosol sampled upwind of London had less nitrate and rBC and a stronger relative con-tribution from sulphate. The enhancement of nitrate aerosol in the urban plume was also evident in the positive correla-tion between nitrate-sulphate ratios and rBC around the cir-cuits (r2= 0.42). We normalized by sulphate mass to account for regional contributions to nitrate in the plume, on the ba-sis that urban sulphate precursor emissions in London are minor compared to nitrate precursor emissions according to the LAEI. The increase in nitrate could have resulted from the new formation of nitric acid via oxidation of nitrogen ox-ides emitted by the city and combination with urban ammo-nia emissions or pre-existing agricultural emissions upwind to form ammonium nitrate. In addition, it is possible that re-partitioning of nitrate from super-micron particles that are not detected by the AMS to detectable sub-micron particles was responsible for some of the observed increase. Super-micron/coarse mode nitrate arises from the surface reaction of nitric acid on sea salt aerosol. The lack of a significant super-micron contribution to aerosol volume suggests that re-partitioning is the less likely explanation, but we do not rule out either possibility.
Dall’Osto et al. (2009) identified two types of nitrate in London using a single particle aerosol mass spectrometer:
a “local” nitrate formed in the urban area during the night and a larger-sized “regionally transported” nitrate. Our air-borne measurements support both a strong regional contribu-tion to nitrate, evident in the relatively high non-plume legs of the flights, as well as a local contribution. The “local” ni-trate source was evident in our daytime measurements be-cause of the lower temperatures and higher relative humid-ity aloft, discussed in more detail in Sect. 3.5. Thus, while Dall’Osto et al. (2009) observed a disappearance of the local nitrate during the day that they attributed to increased tem-perature (resulting in volatilization), decreased relative hu-midity and changes in the boundary layer depth, we still ob-served a minor, local source of nitrate from the city. Despite the increase in nitrate, total sub-micron aerosol mass con-centrations increased either only slightly or in one case (24 June) decreased in the plume, indicating that sub-micron PM emissions from the city were still minor (15 %) compared to contributions from regional aerosol. Refractory black carbon mass concentrations increased by more than a factor of two in the plume, but only represented a small contribution to sub-micron aerosol mass.
Aerosol composition has been previously measured by an AMS over and in the outflow of several major cities (de Gouw and Jimenez, 2009), including Mexico City (DeCarlo et al., 2008). Mexico City is a much larger urban region than London and is confined by topography and influenced by a number of additional sources including wildfires and volca-noes (DeCarlo et al., 2008; Yokelson et al., 2007). Its lower latitude and higher altitude compared to London means more radiation is available for photochemical reactions. DeCarlo et al. (2008) observed average AMS mass concentrations of 26.6 µg sm−3in the Mexico City basin, of which about 60 % was OA, 23 % nitrate and 7 % by sulphate. The higher aver-age OA mass fraction in Mexico City compared to London (60 % versus 30 %) was not surprising given the large differ-ences in photochemical environments and emissions.
Finer-scale changes in aerosol and trace gas concentra-tions are shown in Fig. 11, which gives total aerosol con-centrations along the flight track for a single circuit around London and time series for periods when the aircraft was flying the circuits. We observed elevated sulphate concen-trations in several locations around the circuit for multiple flights, particularly during the southern legs (e.g., points Y on Fig. 10c and d). The higher sulphate concentrations ob-served at point Y on 18 June coincided with elevated sul-phur dioxide concentrations (not shown) and the transport predicted from the UK4 model suggested these were emis-sions from the Southampton area, possibly shipping and/or power-plants. The mean, low-level flow on the 23 and 24 June flights and backward trajectory analysis (not shown) in-dicated that on these occasions the elevated sulphate concen-trations likely resulted from transport from continental Eu-rope, particularly the Netherlands and Belgium regions. Car-bon monoxide, NOx (available 22–24 June only) and rBC
were strongly correlated and increased during the London plume intercepts, which are shaded in Fig. 11. As noted pre-viously, there was little change in total aerosol mass concen-trations, with only minor increases in nitrate and to a lesser degree organics during plume intercepts compared to regions outside the plume.
Aerosol mass concentrations are often normalized by gas-phase tracers of different emission sources to aid compar-isons between measurement locations while accounting for the effects of dilution on absolute concentrations. Increases in the aerosol species relative to a long-lived tracer such as CO reflect secondary production, assuming a constant emission ratio. We examined relationships between aerosol species and trace gas mixing ratios for a subset of three flights (18, 22 and 23 June) with valid gas-phase data from whole air canister samples. Nitrate was positively corre-lated with 1CO, acetylene and other traffic-recorre-lated VOCs with significantly different relationships inside and outside of the London plume. The average non-plume (photochem-ical age >50 h) nitrate/1CO ratio was 80 µg sm−3ppmv−1 (r2= 0.69) compared to 20–30 µg sm−3ppmv−1 in the plumes (photochemical age <20 h), reflecting the enhance-ment of nitrate relative to 1CO in aged, regional pollution. Note here we rely on gas-phase data to distinguish between the plume and non-plume samples rather than the rBC data available for all five flights. Our observations differ from ob-servations of decreases in nitrate-1CO ratios downwind of Mexcio Cit by DeCarlo et al. (2008), which may have re-sulted from dilution with air with low concentrations of ni-tric acid and/or ammonia. We lacked the gas-phase measure-ments of these compounds needed to explore possible rea-sons for the differences in nitrate-1CO ratios,but suspect stronger regional-contributions to NOx and ammonia over
north-western Europe combined with our inability to sample the aged London emissions are responsible.
OA was also positively correlated with 1CO (r2=0.50) and had different relationships inside and outside of the
London plume. The average OA/1CO ratio for photo-chemical age >50 h was ∼45 µg sm−3ppmv−1 but lower
(∼10 µg sm−3ppmv−1) during plume sampling (Table 4).
The relationships between nitrate and OA mass concentra-tions with respect to acetylene, ethane and other long-lived VOCs also showed similar relationships as those observed for 1CO. Allan et al. (2010) measured OA and CO in central London and calculated an average OA/1CO ratio of 10.30 µg sm−3ppmv−1 using linear regression. They re-stricted their calculation to sub-200 nm diameter OA, but our size-resolved OA data for the circuit flights was too vari-able to allow a similar calculation. Our observed OA/1CO ratio of ∼10 µg sm−3ppmv−1in the London plume was sim-ilar to the Allan et al. (2010) value despite the larger size range of OA in our calculations. We suspect the addition of OA mass for diameter >200 nm particles in our calcula-tion was offset by different source footprints. We observed much lower OA/1CO ratios in the London plume compared to a value of approximately 80 µg sm−3ppmv−1 measured in the Mexico City outflow by DeCarlo et al. (2008). De-Carlo et al. (2008) attributed the high OA/1CO ratio to a combination of rapid photochemistry and biomass burning influence. The production of secondary OA in urban plumes means that OA/1CO ratios increase with age. Several stud-ies showed clear increases in OA/1CO from approximately 10 to 80 µg sm−3ppmv−1in aging emissions from Mexico city (DeCarlo et al., 2010; Dzepina et al., 2009; Kleinman et al., 2008). Our observations of higher OA1CO in the re-gional pollution outside of the London plume are consistent with the previous observations if we assume that dominant source of OA and CO in the study region originates from urban centres with similar initial OA/1CO Photochemical reactions likely proceeded more slowly over London com-pared to Mexico City due to lower trace gas concentrations and reduced actinic flux. de Gouw and Jimenez (2009) sum-marized recent AMS OA measurements for urban emissions and reported that primary OA/1CO ratios were typically be-tween 5-15 µg sm−3ppmv−1, in agreement with our London plume measurements. They suspected the lower end of this range was more accurate due to the difficulty in accounting for the rapid formation of SOA and background SOA down-wind of urban sources. de Gouw and Jimenez (2009) also ex-amined aged urban air and found that OA/1CO ratios were about 70±20 µg sm−3ppmv−1for a wide range of emissions and photochemical environments. Our measured OA/1CO ratios in non-plume air around London were also consistent with these results, providing further evidence of the impor-tant contributions by SOA, even in regions with large urban emission sources such as north western Europe. We stress that our non-plume and plume sampling did not measure the same air mass or sources, but rather represent the contrast be-tween emissions from a major European megacity (London) with surrounding regional pollution from a variety of UK and European sources.
5180 G. R. McMeeking et al.: Trace gases and aerosols over London
Refractory BC is a combustion product produced by ve-hicle traffic, so we compared its measured mass concen-trations to other traffic tracers including CO and certain VOCs. Several previous studies have examined BC/1CO relationships and have reported values ranging from ∼1– 6 ng sm−3ppbv−1 (Baumgardner et al., 2007; McMeeking et al., 2010; Spackman et al., 2008; Subramanian et al., 2010). Using whole air canister samples, we observed sub-stantially higher ratios downwind of London, with rBC/1CO approximately 10–12 ng sm−3ppbv−1. Refractory BC/1CO ratios reflect the mix of sources within the city, and for London we believe the increased contributions from diesel vehicles, which produce relatively more rBC compared to petrol vehicles, explain the higher rBC/1CO ratios compared to other locations. Refractory BC was also correlated with other traffic-related and relatively long-lived VOCs, includ-ing ethane (r2= 0.72) and acetylene (r2= 0.81).
3.5 Aerosol vertical structure
Each research flight included vertical profiles from approxi-mately 3000 m to the surface before the first circuit around London in the vicinity of Northolt airfield (Fig. 1). Each profile occurred at approximately 10:00 UTC ±1 h. Poten-tial temperature, potenPoten-tial dew point temperature and aerosol mass concentrations for individual species measured by the AMS and rBC during the profiles are shown in Fig. 12. The planetary boundary layer (PBL) height was about 1900 m for the 16 and 18 June flights. Two distinct layers were visible on the 22 June flight, with a well-mixed layer (constant po-tential temperature) extending from the surface to approxi-mately 1200 m underneath a warmer (in terms of potential temperature) layer extending up to 2100 m. The upper layer was no longer evident by the 23 June and the mixed layer extended from the surface up to approximately 1400 m. The feature was also apparent during the 24 June flight, with a shallow mixed layer extending from the surface up to 750 m underneath a warmer, deeper layer extending up to 1900 m.
The mass concentrations during the two westerly flights (16 and 18 June) were lower throughout the depth of the PBL compared to the 22–24 June flights. The profiles re-vealed a more complicated vertical structure for the flights where anti-cyclonic conditions dominated on 22–24 June. Within the PBL, nitrate mass concentrations increased with altitude, as previously observed by Morgan et al. (2009) dur-ing similar airborne measurements over the UK. They linked the enhancement of nitrate with altitude to decreases in tem-perature and increases in RH that altered the equilibrium of the nitric acid-ammonia-ammonium nitrate system towards the particle/ammonium nitrate phase. This is consistent with the increase in nitrate with relative humidity observed dur-ing several flights around London. For example, durdur-ing the 23 June flight (B460), nitrate mass concentrations increased by a factor of 3 for a 40 % increase in RH whereas sul-phate and OA concentrations remained constant. Previous
Fig. 12. Altitude profiles in the vicinity of Northolt airfield (Fig. 1) for (left) sub-micron aerosol mass concentrations over London and (right) potential temperature (black) and potential dew point tem-perature (blue). Refractory black carbon (rBC) was measured by the SP2 and organics, nitrate, sulphate and ammonium were measured by the AMS. rBC mass concentrations were multiplied by five to appear on the same scale as the AMS species. The horizontal grey line shows the altitude of the around London circuits. All axes are to identical scales.


![[PDF] Cours Base de données J2EE pdf | Cours informatique](data:image/gif;base64,R0lGODlhAQABAIAAAP///wAAACH5BAEAAAAALAAAAAABAAEAAAICRAEAOw==)