HAL Id: hal-03111629
https://hal.archives-ouvertes.fr/hal-03111629
Submitted on 24 Jan 2021
HAL is a multi-disciplinary open access
archive for the deposit and dissemination of
sci-entific research documents, whether they are
pub-lished or not. The documents may come from
teaching and research institutions in France or
abroad, or from public or private research centers.
L’archive ouverte pluridisciplinaire HAL, est
destinée au dépôt et à la diffusion de documents
scientifiques de niveau recherche, publiés ou non,
émanant des établissements d’enseignement et de
recherche français ou étrangers, des laboratoires
publics ou privés.
Spatial and temporal variability of atmospheric
sulfur-containing gases and particles during the
Albatross campaign
J. Sciare, E. Baboukas, M. Kanakidou, U. Krischke, S. Belviso, H. Bardouki,
N. Mihalopoulos
To cite this version:
J. Sciare, E. Baboukas, M. Kanakidou, U. Krischke, S. Belviso, et al.. Spatial and temporal
variabil-ity of atmospheric sulfur-containing gases and particles during the Albatross campaign. Journal of
Geophysical Research: Atmospheres, American Geophysical Union, 2000, 105 (D11), pp.14433-14448.
�10.1029/1999JD901155�. �hal-03111629�
JOURNAL OF GEOPHYSICAL RESEARCH, VOL. 105, NO. Dll, PAGES 14,433-14,448, JUNE 16, 2000
Spatial and temporal variability of atmospheric sulfur-
containing gases
and particles during the Albatross campaign
J. Sciare,
1 E. Baboukas
2M Kanakidou,
2 U. Krischke
3 S Belviso
1 H Bardouki,
2
and
N. Mihalopoulos
2
Abstract. To investigate the oxidation chemistry of dimethylsulfide (DMS) in the marine atmosphere, atmospheric DMS, SO2, as well as several DMS oxidation products in aerosol phase such as non-sea-salt sulfate (nss-SO4), methanesulfonate (MSA), and
dimethylsulfoxide (DMSOp) have been measured during the Albatross campaign in the Atlantic Ocean from October 9 to November 2, 1996. Long-range transport, local sea-to-air flux of DMS (Frms), marine boundary layer (MBL) height variation, and photochemistry were found to be the major factors controlling atmospheric DMS concentration which ranged from 29 to 396 parts per trillion by volume (pptv) (mean of 120+_68 pptv) over the cruise. The spatial variability of MSA and DMSOp follows the latitudinal variations of FvMs. A 2-day period of intensive photochemistry associated with quite stable atmospheric conditions south of the equator allowed the observation of anticorrelated diurnal variations between DMS and its main oxidation products. A chemical box model describing sulfur chemistry in the marine atmosphere was used to reproduce these variations and investigate coherence of
experimentally calculated fluxes FvMs with observed DMS atmospheric concentrations. The model results reveal that the measured OH levels are not sufficient to explain the observed DMS daytime variation. Oxidizing species other than OH, probably BrO, must be involved in the oxidation of DMS to reproduce the observed data.
1. Introduction
Many efforts have been made in the last years to understand the processes controlling the formation of particles in the remote marine atmosphere (see, for instance, the First Aerosol Characterization Experiment (ACE 1) [Bates et al., 1998]). Particles play an important climatic role since they can scatter solar radiation and they can act as a cloud condensation nuclei (CCN), thus influencing the Earth's albedo and subsequently climate [Intergovernmental Panel on Climate Change (IPCC), 1994]. Atmospheric dimethylsulfide (DMS), through its end-products, is proposed to be the main compound leading to formation of new particles in the remote marine atmosphere [Charlson et al., 1987].
DMS is produced in seawater from the activity of various phytoplanktonic species. Once released in the atmosphere it
will follow an oxidation
scheme
controlled
mainly by OH
radicals, the main oxidant in the remote marine atmosphere. Halogen and halogen oxides, especially BrO, have been also proposed to play a significant role in the oxidation pathway of DMS in the remote marine atmosphere [Toumi, 1994].•Laboratoire des Sciences du Climat et de l'Environnement, CEA Orme des Merisiers, Gif-sur-Yvette, France.
2Evironmental Chemical Processes Laboratory, Department of Chemistry, University of Crete, Heraklion, Greeceø
3Department of Atmospheric Sciences, University of California, Los Angeles.
Copyfight 2000 by the American Geophysical Union.
Paper number 1999JD901155. 0148-0227/00/1999JD901155509.00
Various authors have shown that DMS follows a daytime cycle in the remote marine atmosphere, generally consistent with simulations of photochemical models considering only
the OH-initiated reactions of DMS and its sea-to-air flux
[Andreae et al., 1985; Ayers et al., 1995]. In parallel, other studies [see, e.g., Yvon et a/.,1996; Chin et al., 1996] showed that in several cases the amplitude of the measured daytime cycle of DMS is significantly larger than that predicted by a photochemical model in which OH radical is the only oxidant for DMS. Therefore these authors speculated on the possible
contribution of radicals other than OH in the oxidation
scheme of DMS. However, lack of measurements of BrO
and/or even OH radicals in the marine atmosphere does not allow any conclusion to be made on their relative contribution
to the oxidation of DMS.
Although several experiments have been performed to identify the parameters controlling the atmospheric DMS concentrations in the marine atmosphere [Andreae et al.,
1995; Ayers et al., 1995], very few experiments
were
performed
to study
the latitudinal
behavior
of this compound
(both in seawater
and the atmosphere)
along with its oxi-
dation
products
(SO2, dimethylsulfoxyde
(DMSO), nss-804,
methanesulfonate (MSA)).Measurements of atmospheric DMS and its oxidation
products
in gas
and particulate
phase
in conjunction
with "in
situ" measurements of OH radicals and their latitudinalvariation
during
the Albatross
cruise
(following
the 30øW
from 58øN to 42øS)
allowed
us (1) to study
the factors
con-
trolling the latitudinal variation of DMS and its oxidation products and (2) to investigate the relative contribution of OHradicals
in the oxidation
of DMS in the marine
atmosphere
through modeling studies.
14,434 SCIARE ET AL.' ATMOSPHERIC SULFL•.-CONTAINING GASES AND PARTICLES
2. Experiment
The Albatross campaign was conducted aboard of the
German ice breaker R/V Polarstern from Bremerhaven
(Germany) to Punta Quilla (Argentina) from October 5 to November 11, 1996. After leaving Bremerhaven, the ship
reached the Arctic circle north of Iceland (October 10), then
followed roughly the 30øW longitude southward until 45øS
(October 11 to November 3) arrived at the South American
coast at 50øS (November 10; Figure la). The sampling was conducted along the 30øW (from 60øN to 45øS) thus coveting the main parts of North and South Atlantic Ocean. The sampling was performed on the working deck, at the front of the ship around 25 m above sea level, close to the sampling devices of all other participating groups.
2.1. Atmospheric DMS
DMS was collected into 6-L stainless steel electropolished
canisters by compressing air up to 5 bars. Time of collection
was typically of the order of 10 min, with a mean of one air sample collected every 4 hours during all the reported period. The analysis was conducted immediately after the collection using a gas chromatograph (VARIAN 3400) equipped with a FPD detector as described by Nguyen et al. [1990]. Regular DMS calibrations using permeation tubes (wafer-type permeation source, VICI Metronics, Santa Clara, California)
were performed through the entire sampling period and did not show any detectable variation in the sensitivity of the detector. Detection limit was typically of the order of 2 ng (DMS) which in our sampling conditions corresponds to approximately 10 pptv of atmospheric DMS. Accuracy of the analysis was of the order of 5%. Comparisons of sampling in canisters with "on-line" sampling have shown differences (+ 5.4%) of the same order of magnitude with the accuracy of the analysis. The DMS was found to be stable in the canisters for at least 9 days (change less than 7%). Finally, no destruction of DMS by oxidants during the preconcentration step has been detected by DMS standard additions.
2.2. Atmospheric SO2
Atmospheric SO2 samples were collected using annular denuders equipped with a mini impactor (2.1 pm cutoff
diameter). The denuders were coated with Na2CO3 and
positioned approximately 25 m above the sea level on the working deck. More details concerning the denuder sampling system are presented by Baboukas et al. [this issue] and Lawrence and Koutrakis [1994]. Exposure times varied from 10 to 22 hours. A total of 31 SO2 samples were thus continuously collected from 62øN to 38øS covering the period from October 11 to November 2, 1996. Following exposure, the denuders were extracted with 10 mL of Milli-Q water, and approximately 50 pL of chloroform were added as a biocide
la 60 N ! ß i i ! 2O W 15S 30 S 45S lb
1,5E+04 1,0E+04 5,0E+03 O,OE+00 11110 13110 15110 17110 19110 21110 23110 25110 27110 29/10 31110 2111 4/11
•,,.•, ,.,,c muauu• campaign hi the ... ' Ocean. (b) Condensation Figure 1. (a) 'T'U,,, 1 ilk s,,Ip durhng •tlantlc
SCIARE ET AL.' ATMOSPI-I•RIC SULFUR-CONTAINING GASES AND PARTICLES 14,435
to preserve chemical species against bacterial decomposition. Approximately 10% of the coated denuders were used as field blanks. The blanks have been obtained by exposing the coated denuders to the ambient air for few minutes and subsequently proceeded as for the samples. The extracts were stored in Nalgene opaque polyethylene bottles at +4øC. Analysis was performed by ion chromatography within 3 to 5 weeks after the campaign. SO2 was detected as sulfate and determined
with isocratic
elution
at 2.0 mL min'•of Na2CO3/NaHCO3
eluent. Field blank extracts contained nondetectable amountsof SO4. The method has been calibrated with aqueous standards. The detection limit for SO2, calculated as the total
sulfate (sea salt and nss sulfate) was 3.4 pptv, and the precision was 3% at detection limit.
extracts to avoid microbial consumption of DMSO. DMSO was reduced to DMS by NaBH4 and subsequently analyzed using a gas-chromatograph equipped with FPD. The reproducibility, determined by analyzing the same extract 5 times and different parts of the same filter was found to be better than 10%. Tests of conservation on the impacted filters did not show any significant variation of DMSO levels at least over a 6-month period. Preliminary tests of DMSOp stability on the filters performed by parallel sampling of two filters, one with a denuder in front impregnated with Na2NO3
to remove the oxidants and another without, did not reveal
any significant difference. More details concerning the analysis of DMSO are given by Sciare and Mihalopoulos
[2000].
The
detection
limit was
better
than
1.7 10
-3
pptv.
2.3. Aerosols Collection
Fine aerosol particles (d < 1.1 gm; N=31) were collected on 0.45 gm Gelman Zefluor PTFE filters placed behind the
denuder tubes (hereafter mentioned as "Low-vol") operated at
a flow of 9 sL min -•. The collection of the fine fraction of the particulate matter was attained by the use of an impactor, placed before the denuder device, with a cutoff diameter of 2.1 gm. In addition, size-segregated aerosols were collected on Whatman-41 filter paper over sampling periods of 12 to 24-hour by means of a six-stage cascade impactor (SiesTa- Andersen, Model 230 impactor; hereafter mentioned as "Hi- vol"). The Hi-vol impactor was placed near the denuder
system
and
operated
at a flow rate
of 85 m
3 h -•. At this
flow
rate the impactor separated the particles into the following aerodynamic equivalent diameter (Dp) ranges: Stage l: > 6.40 gm, stage 2:2.67-6.40 gin, stage 3:1.33-2.67 gm, stage 4: 0.84-1.33 gm, stage 5:0.44-0.84 gm. Particles with diameters lower than 0.44 gm were collected on the backup Whatman- 41 filter. A total of 29 sets of samples were collected using this cascade impactor from 57øN to 46øS. Filters were prewashed in the laboratory with 0.1 M HC1, rinsed four-five
times with Milli-Q water and dried in a clean-air hood. After
drying, filters were sealed individually in aluminum foil and polyethylene bags which were opened just before use. At least 5% of washed filters (per batch) were used as laboratory
blanks and 5 % as field blanks.
Teflon and Whatman-41 filters were extracted by 10 and 20 mL of Milli-Q water respectively, for 45 min in ultrasonic bath. The extraction efficiency with this method was higher than 98% for all compounds of interest. In sample extracts 50-100 !xL chloroform were added as a biocide and all the extracts were analyzed within a week using ion- chromatography. Details on the analysis are given at
Baboukas et al. [this issue]. Precision was 3-6%. For the
aerosol phase and the Low-vol sampling, the detection limits, were 2 and 1.2 pptv for sulfate and methanesulfonate respectively. For the Hi-vol setup the detection limits were better than 0.02 pptv for both compounds.
2.4. DMSO Determination in Aerosols
DMSOp determination in aerosols was performed from the Hi-vol impactor filters by extracting them with 50 mL Milli-Q water for 30 min in ultrasonic bath. As detailed by Sciare et al. [1998], particular attention has been paid on using "DMSO-free" Milli-Q water for the extraction step. Following the recommendation of Andreae [1980], 20 pL of fuming hydrochloric acid (HC1, 37%) were added to the
2.5. Condensation Nuclei
Measurements of condensation nuclei (CN) were
performed during the campaign by the Juelich-KFA group using a 3010 TSI Model with a lower detection limit of 10 nm, and a measuring frequency of a minute. This counter was located also on the working deck.
3. Results and Discussion 3.1. Meteorological Parameters
Meteorological parameters such as wind speed, wind direction, air and seawater temperature and relative humidity (RH) were continuously recorded from the instruments on board the R/V Polarstern. The height of MBL was estimated from the daily ozone radio soundings and Lidar mea- surements performed on board (R. Weller and P. Rairoux, personal communication, 1999). Very good agreement was found between the first aerosol layer height determined by Lidar measurements and the inversion height (in RH, and air temperature) observed by ozone radio soundings and defined here as the MBL height (report to Figure 2a).
To identify the periods of pure marine conditions f¾om those under continental/polluted air masses influence, we reported condensation nuclei measurements as a function of date and in conjunction with the track (Figures la and lb). In conjunction with atmospheric NO, NO2, black carbon measurements as well as back trajectories, we were able to identify periods under continental/polluted air masses influence (gray areas displayed on the track; Figures la and
lb).
3.2. DMS Sea-to-Air Flux Fires Calculation
DMS concentrations in surface seawater measured during
the whole cruise with a resolution of 10-15 km ranged from
0.15 to 6.6 nM. Details on the seawater DMS measurements
are given by Belviso et al. [this issue]. On the basis of these high spario-temporal resolution DMS observations in seawater, sea-to-air DMS fluxes were calculated using the following equation described by Liss and Slater [1974]'
FDMS = Kw Cw
where Cw is the DMS concentration in seawater and K w is the DMS gas-transfer velocity.
The K w was calculated
by using
the relationship
proposed
by Liss and Merlivat [1986] relating K w with wind speed and seawater temperature. Wind speed and seawater temperature were obtained continuously while underway from the equipment available aboard of R/V Polarstern.14,436 SCIARE ET AL.' ATMOSPHERIC SULFUR-CONTAINING GASES AND PARTICLES 400 300 200 lOO 2OOO
1600
8OO 4OO 30 25 2O 15 10 i 2OO 150 100 5o 5oo • 400 0 r,/) 300 = 200 • 100 0 O, -50 ... :•::::::•:: S02 + nss-S04 -40 -30 -20 -10 0 10 20 30 40 50 60 Degree of latitudeFigure
2. Latitudinal
variation
of (a) atmospheric
DMS
and
MBL,
(b) DMS
sea-air
fluxes,
(c) aerosol
MSA
and DMSO, and (d) nss-SO4 and SO2 during the AlbaU'oss cmise.3.3. Factors Controlling the Distribution of Atmospheric DMS
A total of 130 atmospheric samples was collected and analyzed for DMS during the cruise. DMS concentrations ranged from 29 to 396 pptv (with arithmetic mean of 120_+ 68
pptv).
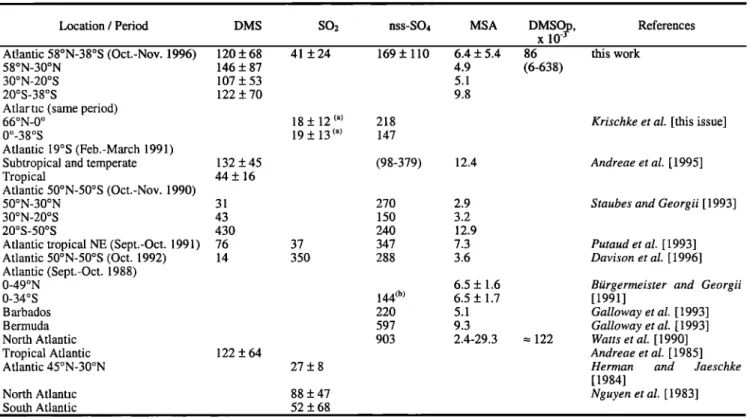
Table 1 compares our DMS measurements during the Albatross cruise with those reported in literature for the same area. Our mean DMS concentration of 120 pptv is found to be in relatively good agreement with reported atmospheric DMS observations. For instance, our mean value of 122 pptv mea- sured in the temperate Atlantic Ocean is in excellent agreement with the value reported by Andreae et al. [ 1995] in
SCIARE ET AL.: ATMOSPHERIC SULFUR-CONTAINING GASES AND PARTICLES 14,437
Table 1. Sulfur
Species
Atmospheric
Mol Fraction
Observed
During
This
Cruise
and
Compared
to Literature
Data
for the
Atlantic OceanLocation / Period DMS SO2 nss-SO4 MSA DMSO, p, References
x10 -•
At!,antic 58øN-38øS (Oct.-Nov. 1996) 120 + 68
58øN-30øN 146 + 87
30øN-20øS 107 + 53
20øS-38øS 122 + 70
Atlartic (same period)
66øN-0 o 0ø_38øS
Atlantic 19øS (Feb.-March 1991)
Subtropical and temperate 132 + 45
Tropical 44 + 16
Atlantic 50øN-50øS (Oct.-Nov. 1990)
50øN-30øN 31
30øN-20øS 43
20øS-50øS 430
Atlantic tropical NE (Sept.-Oct. 1991) 76 Atlantic 50øN-50øS (Oct. 1992) 14 Atlantic (Sept.-Oct. 1988) 0-49øN 0-34øS Barbados Bermuda North Atlantic Tropical Atlantic 122 + 64 Atlantic 45øN-30øN 41 + 24 169 + 110 6.4 + 5.4 4.9 5.1 9.8 18 + 12 (a) 218 19 + 13 (a) 147 (98-379) 12.4 270 2.9 150 3.2 240 12.9 37 347 7.3 350 288 3.6 27+8 6.5 + 1.6 144 © 6.5 + 1.7 220 5.1 597 9.3 903 2.4-29.3 North Atlantic 88 + 47 South Atlantic 52 + 68
Units are in pptv. The ranges of concentrations are shown in parentheses. a SO2 background concentration ([SO2]<100 pptv [see Krischke et al., this issue]).
b Only between 17 ø and 29øS.
86 this work
(6-638)
122
Krischke et al. [this issue]
Andreae et al. [ 1995]
Staubes and Georgii [ 1993]
Putaud et al. [1993] Davison et al. [1996]
Biirgermeister and Georgii [1991]
Galloway et al. [ 1993] Galloway et al. [1993] Watts et al. [ 1990] Andreae et al. [ 1985]
Herman and Jaeschke
[1984]
Nguyen et al. [1983]
the same area. Our mean value of 107 pptv measured in the tropical and subtropical area falls between the 76 and 122 pptv reported by Putaud et al. [1993] and Andreae et al. [1985], respectively. Changes in F•)•ts and/or MBL height can
account for the about a factor of 2 difference between our measurements and those of Andreae et al. [1995] and Staubes
and Georgii [1993] for the tropical Atlantic Ocean. Indeed, as depicted in Figure 2a, during the Albatross cruise the MBL height around the equator was 500 m, comparable to the values observed in equatorial regions [Yvon et al., 1996; Bandy et al., 1996]. In addition seawater DMS concentrations during the Albatross campaign [Belviso et al., this issue] were about a factor of 2 higher than those of 1.1-1.4 nM reported by Staubes and Georgii [1993], suggesting that the experimental conditions were different during these two cruises. This is also reflected on the particulate MSA concentrations which are a factor of 2 higher during the Albatross cruise than during the cruise reported by Staubes and Georgii [1993] (Table 1).
As shown in Figure 2a, strong variations in atmospheric DMS were observed along the track. To explain such variability in DMS, the major factors expected to control it, such as its sea-to-air flux, OH diurnal variation, MBL height and air mass origin (back trajectories) available during the campaign, were analyzed. From the DMS and F•ms over the whole cruise, depicted in Figures 2a and 2b, several
conclusions can be made:
The DMS variations coincide most of the time with the
F•)•ts variations over the cruise, thus, we can assume that the
major parameters controlling atmospheric DMS concentration during this cruise were local (strength of the source (F•)•ts) influenced by the local wind). However, this covariation is not quantitative. When FD•ts is plotted as a function of DMS
(Figure
3), the
correlation
coefficient
r 2 for a linear
regression
is weak (0.28). Even if the two apparent "outliers" are
removed
the r 2 remains
weak
(0.36).
We can
thus
assume
that
sea-air exchange of DMS can account for only one third of the observed variability in the atmospheric DMS
concentration.
To understand such low accordance, we chose the two
"outliers" of the Figure 3, as a case study. The first cor- responds to an event occurred at 42øN and is associated with
14 12 -• 8 E • 6 • 4 2 r 2 = 0.28
ß
ß .o .-• ß ; ß _ •, ß
'
".7
'
'
1 O0 200 300 400 DMS, pptvFigure 3. Regression between DMS sea-to-air flux and atmospheric DMS during the Albatross cruise.
14,438 SCIARE ET AL.: ATMOSPHERIC SULFUR-CONT•G GASES AND PARTICLES
2OO IO0
,-O--DMS ... Wind direction
c:) c:) .e 8o 25O 'o
60
..-- -100 -80 • .I I I, •
.d October
ß . i14,
lZ00
' ßOT
- 100 -80 -40 LONGITUDE -4O -20 . •i.:•:i::•{.!½:;f•: ... --o--DMS ... FDMS 400 il200
fi
•'
i {iiil
,
...
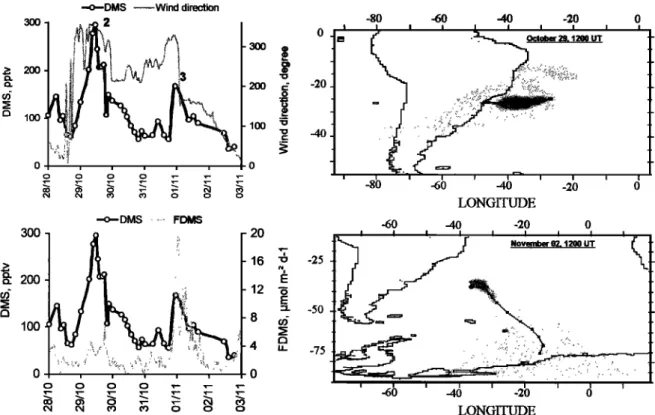
o • 40 E -60 -40 -20 0 -60 -4O -20 0 LONGITUDEFigure 4a. Atmospheric DMS, sea-air flux, wind direction, and 5-day back trajectory analysis for the period October 13-17, 1996.The shaded areas in the trajectory plots correspond to the region from which the air mass originates. Darker areas show higher probability than lighter areas. The continuous line corresponds to the center of gravity of the air mass calculated every 12 hours.
an increase in DMS by more than 300 pptv (from 89 to 397 pptv) within at least 4 hours (event marked by '1' in Figure 2a). The decrease of the MBL height by 40% observed on October 14-15, is not sufficient to explain such increase in DMS. On the basis of 5-day back trajectory analysis and the local wind direction, this event could be partly explained by a change in the origin of air masses reaching the ship as illustrated in Figure 4a. As displayed in this figure, changes both in the wind direction and the air mass origin (as shown by the 5-day back trajectories) provided pure southerly marine
conditions on October 15 after an event of continental air
masses from North America occurring on October 14. Changes in source strength and/or oxidation lifetime of DMS
(lower in continental air masses due to elevated NO3 levels)
can account for this difference. Similar change in air masses was also observed during an event (marked by '2' in Figure 2a) occurring on October 29, around 24øS and was associated with a decrease in DMS by nearly 200 pptv (from 295 to 108 pptv) within 8 hours (Figure 4b).
The second "outlier" corresponds to an event occurred around 31.5øS (event marked by '3' in Figure 2a). Figure 4b depicts the origin of the sampled air-mass during this event. Although the local DMS flux reached values up to 15 !xmol
m
-2 d
'l, DMS concentrations
remained
low. Long-range
transport from "low productive DMS areas" of the southern
ocean can account for this situation. The enhancement of the
MSA/nss-SO4 ratio occurred during this event (13%, i.e., the highest value observed during the whole cruise) is an additional indication of important influence from colder areas. All the above cases indicate that transport can also significantly influence atmospheric DMS concentrations.
The last interesting situation (event marked by '4' in Figure 2a) was observed during a 2-day period between roughly 0 ø and 10øS. During this period important day-m-day DMS changes occurred without any significant change in DMS flux, air masses origin and/or MBL height. At these latitudes, photochemistry could be responsible for the observed DMS daytime variations. This period will be discussed in more details in section 3.6 to highlight the diurnal variation of DMS and its oxidation products.
3.4. Atmospheric SO2
Atmospheric SO2 concentrations were determined during the campaign using the annular denuder technique and the results are displayed in Figure 2d. High values of SO2 have been recorded during the cruise at the latitude bands 55-60øN,
45-35øN and below 30øS. These values are associated with
high CN values (Figure lb) and denote continental influence. Except these strong events with SO2 up to 300 pptv, the recorded atmospheric SO2 concentrations (average 41 + 24 pptv) were of the order of those reported for clean marine atmosphere (de Bruyn et al. [1998] and Ayers et al. [1997] for
southern Pacific and references in Table 1 for Atlantic). SO2
has been also measured during this cruise by means of a filter technique using an aqueous solution of tetrachloromercurate (ID as absorbents [Krischke et al., this issue]. Unfortunately, no quantitative comparison can be performed between these two data sets for two reasons: First, the sampling strategy and sampling step were different: (1) 45 min sampling and no samples during most of the nights by Krischke et al. [this issue], (2) 12-22 hours and continuous sampling (this work). Second, the mean value reported by Krischke et al. [this
SCIARE ET AL.: ATMOSPHERIC SULFUR-CO••G GASES AND PARTICLES 14,439
ß -o--DMS ... Wind direction 300 , •. •. 2
,lOO
I
o o o o •-- •-- o • • O• O• 0 0 300 ß -o--DMS ... FDMS 200 100 0 o o O0 O0 0 0 0 - 20 '7 16 "o E 12 '• E 8 4 ,, 0 . -20 -40 -25 -50 -75 -80 ' -gD ' ' -60 -6O -40 -20 ß ctober 29,1200 UT • I I I I -6 -40 -20 LONGITUDE -40 -20 o November O• t200 UT -60 -40 -20 0 LONGITUDE 0Figure
4b. Atmospheric
DMS, sea-air
flux, wind
direction
and
5-day
back
trajectory
analysis
for the period
October 28 to November 3, 1996 (see explanation of Figure 4a).
issue] excludes concentrations higher than 98 pptv as they could be influenced by anthropogenic sources through long- range transport. Our integrated continuous sampling can not
allow elimination of short-term events (few hours) with
concentrations above 100 pptv (and less than about i ppbv) which certainly influence our mean values. These reasons could account for the "apparent" difference of about a factor
of 2 between the two data sets shown in Table 1. Therefore
our mean SO2 values agree reasonably with those reported by Krischke et al. [this issue; Table 1]. In the following discussion, we will use the SO2 data set collected by Krischke
et al. [this issue] which has the best time resolution.
3.5. Sulfur-Containing Atmospheric Aerosols
3.5.1. The nss-SO4. The measurements of total nss-SO4
(sum of the six stages of the cascade impactor) during the Albatross campaign are reported in Table 1 and compared to observations reported in literature. Our mean value of 169 pptv __+ 110 observed during the experiment is in good agreement with the mean values of 147 and 218 pptv reported by Krischke et al. [this issue] for the southern and northern hemisphere respectively. The particulate nss-SO4 measured during the Albatross campaign is among the lowest recorded over the Atlantic Ocean, suggesting, in agreement with previous observations on atmospheric SO2, that pure marine conditions occurred during the major part of the cruise.
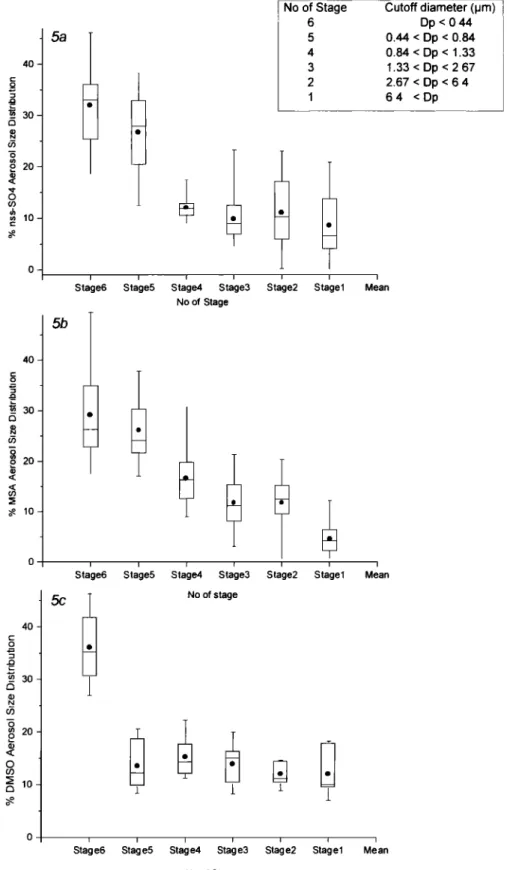
The size fractionation of nss-SO 4 in 6 different segregated stages is reported in Figure 5a. Nss-SO4 is mainly distributed in the fine mode (diameters smaller than 1.3 gm; i.e., stages 4
to 6) since this mode accounts for about 70% of the total nss-
SO4 concentration. Krischke et al. [this issue] by using an impactor for separation in two aerosol classes, reported
partition of nss-SO4 in the fine mode (<1.0 gm) of the order of 64%, in very good agreement with our observations. The origin of nss-SO4 in the coarse mode can be explained by absorption of SO2 on the basic particles (mainly sea salt). On the other hand, the nss-SO4 presence in the fine mode is probably due to gas-to-particle conversion.
3.5.2. MSA. MSA measured on the back filters of the
denuders (particles with diameters smaller than 2.1 pm) agreed quite well in absolute terms with the MSA collected on the two last stages of the cascade impactor, particles with diameters smaller than 0.84 pm. This indicates a good agreement between these two aerosol sampling devices. Total particulate MSA (MSAp) concentrations, sum of the six stages of the cascade impactor, as given in Table 1, ranged from 0.73 to 29.3 pptv (mean = 6.4 + 5.4 pptv) and agree well with previous observations. The general trend of MSAp over the cruise (Figure 2c) was found to follow the FDMS (Figure
2b) with its maximum south of 40øS, which was consistent
with the previous observations in this area [Staubes and Georgii, 1993; Davison et al., 1996].
The size fractionation of MSA in six different segregated stages is depicted in Figure 5b. The fine mode (diameters smaller than 1.3 •tm; i.e., stages four to six) accounts for about 71% of the total MSA concentration. A significant part
of MSA does
exist
in the 4 th stage
compared
to nss-SO4,
indicating a more significant adsorption of MSA onto preexisting particles.
3.5.3. Aerosol MSA/nss-SO4 ratio. Several,studies
investigated the factors controlling the MSA/nss-SO4 ratio variability [Bates et al., 1992; Ayers et al., 1996, and references therein] and reported a negative temperature dependence. In order to study such dependencies, MSA/nss- SO4 ratios have been calculated from the cascade impactor
14,440 SCIARE ET AL.' ATMOSPHERIC SULFUR-CONTAINING GASES AND PARTICLES 4O t- • 3o ._ o 20 0 • 10 4o õ • 3o ._ • 20 • lO 4o _½ 30 N o ½ 20 o o • 10 5a 5b 56 i Stage6
No of Stage Cutoff diameter (pm)
6 Dp < 0.44 5 0.44 < Dp < 0.84 4 0.84 < Dp < 1.33 3 1.33 < Dp < 2.67 2 2.67 < Dp < 6.4 1 6.4 <Dp
Stage5 Stage4 Stage3 Stage2 Stage1 Mean
No of Stage
I
Stage6
1
I I I I I I
Stage5 Stage4 Stage3 Stage2 Stage1 Mean
No of stage
Stag e6 Stag e5 Stag e4 Stag e3 Stag e2 Stag e 1 Me an
No of Stage
Figure 5. Size fractionation
of (a) nss-SO4,
(b),MSA,
and (c),
DMSO as a function
of diameter
during
the
cruise.
The box
plots
contain
the 10
th,
25
th,
50
m,
75
th
and
90
m percentiles.
The square
inside
the box
plots
corresponds to the mean value.
data along the track during periods of background marine conditions as indicated by the 5-day back trajectories. High values ranging between 0.08 and 0.12 (mean 0.10 + 0.02) were recorded in the temperate south Atlantic (27-36øS), whereas low values ranging between 0.019 and 0.044 (mean
0.028 + 0.009) was found in the equatorial Atlantic (20øN - 20øS). Such observations are in agreement with the work of Bates et al., [1992] also reported a strong latitudinal de- pendence in this ratio. Our mean value of 0.028 reported for the equatorial Atlantic is in good agreement with the value
SCIARE ET AL.: ATMOSPHERIC SULFUR-CONTAINING GASES AND PARTICLES 14,441 derived from Bates et al. [ 1992] equation and observations at
the same area [Putaud et al., 1993]. For the temperate Atlantic our mean value of 0.10 is lower compared to the value derived from Bates et al. [1992] equation. Anthropogenic influence on the nss-804 concentrations can account for this low values. Indeed, despite the fact that air masses back trajectories indicate pristine marine conditions, isotopic sulfur analysis performed by Patris et al. [this issue] indicate a nonnegligible anthropogenic component at this area
(around 30%).
3.5.4. DMSOp. Particulate DMSO (DMSOp) measure- ments were performed on the back up filter of the cascade impactor (aerodynamic equivalent diameter <0.44 [tm) with
concentrations
ranging
from 2.2 x 10
-3 to 211 x 10
-3 pptv
(mean = 32.10
-3 + 49.10
-3 pptv). All the DMSOp
determinations for the last stage of the cascade impactor were reported in Figure 2c and similarly to MSAp, were found to be in good accordance with Frms, with the highest values
(211.10
-3
pptv)
recorded
south
of 40øS.
However
the stronger
variability of DMSOp (maximum differences of a factor of 100) when compared to the MSAp variability (maximum differences of a factor of 20) could be explained by a shorter lifetime of DMSOp compared to MSA in the aerosol phase.
From a first approach, such good agreement between DMSOp and Frms parameters could suggest that DMSOp in particles sized less than 0.44 [tm is produced from local sources of DMS and has a relatively short lifetime. Such
behavior cannot nevertheless be attributed to the whole cruise
since very low DMSOp values were found around the equator, whereas DMS and Frms did not present such pattern. Several parameters such as atmospheric DMSO production, gas-to-particle conversion and DMSO stability in the aerosol phase may influence the concentration of DMSOp. The latitudinal dependence of these parameters is discussed
below.
1. Strongly dependent on atmospheric temperature, the addition reaction of OH on DMS leading to DMSO production is favored at low temperatures [Hynes and Wine, 1996]. Thus, gas phase DMSO formation is expected to be enhanced at the highest latitudes.
2. In addition, as suggested by Davis et al. [1998], gas phase DMSO has a longer lifetime with respect to OH reaction at high than at low latitudes. Therefore, gas-to- particle conversion of atmospheric DMSO could represent its major sink at high latitudes.
Indeed during Albatross campaign, the highest DMSOp levels were found at the highest latitudes. Even higher DMSOp concentrations (up to 4.9 pptv) have been observed at higher latitudes at a coastal site in Antarctica (J. Sciare, unpublished data, 1999), supporting the previous analysis.
DMSOp analysis in six complete sets of six-stage impactor
fractions revealed that 36.1% + 6.7 of the collected DMSOp
was in the final filter (Figure 5c). No significant difference in DMSOp levels has been observed between the other stages.
DMSO has been detected in seawater, at levels that
sometimes exceed those of DMS [Andreae, 1980; Kieber et
al., 1996; Simo et al., 1997]. The low DMSOp partition observed at stages 1-2 indicates that sea spray is not an important source of aerosol DMSO. Thus gas-to-particle conversion seems to be the main process governing the DMSOp formation.
Given the small standard deviation of the mean of DMSOp
in the final filter, the total DMSOp concentration in the
remaining 25 cascade impactor filters was calculated using the above average (36.1% + 6.7) and the corresponding DMSOp value in the final filter. DMSOp total concentrations,
thus
calculated,
ranged
from
(6-638)
x 10
-3
pptv
(mean
of 86
X 10
'3 pptv).
Our mean
total
DMSOp
is in good
agreement
with the only DMSOp measurements ever reported in
literature (Table 1).
An enhancement in DMSOp production compared to MS A as a function of latitude was observed during the campaign with higher DMSOp/MSA ratio values at high latitudes than at lower latitudes. Indeed the DMSOp/MSA ratio increases
from 3.4.10
-3 in the equatorial
Atlantic
(20øN-20øS)
to
10.5.10
-3 in the temperate
south
Atlantic
(27-36øS);
that
is a
factor of 3, comparable to the enhancement of MSA relative to nss-SO4 (3.5; see paragraph 3.5.3). Such enhancement in the DMSOp/MSA ratio at low temperatures has been also
observed in rainwater collected at Amsterdam Island during a
2-year period $ciare et al. [1998]. Although the behavior of DMSOp (enhancement at low temperatures) is in line with the previous discussion, further studies are required to elucidate its fate in the particulate phase.
3.6. Photochemical Processes Controlling the DMS
Oxidation Scheme: Comparison With a Simple 0-D
Chelnical Model Simulation
3.6.1. Observations. Owing to unstable weather con- ditions (change in wind speed and direction, MBL height, insolation), no clear diurnal variations for atmospheric DMS were observed during the track, except for a 2-day period (October 25-26, roughly between 0 ø and 10øS) when clean marine air (report to Figure 1) and quite stable weather conditions (insolation and wind speed) occurred. MBL height observed in this tropical area (October 23-26) remained quite stable and averaged 539 + 49m. Owing to stable wind speed and DMS seawater concentrations, Frms remained also quite
stable
during
these
days
and
averaged
4.0 + 0.9 [tmol
m
-2
d -•.
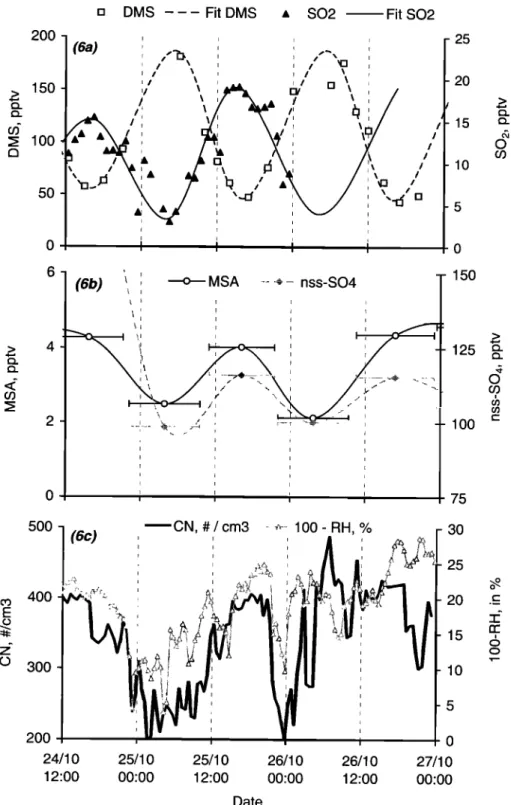
As depicted in Figure 6a, atmospheric DMS exhibits during these 2 days clear diurnal variations with a maximum of around 175 pptv in the early morning (0800 local time,
around 1 hour after the sunrise) and minimum of around 45
pptv in the late afternoon (1700 local time, around 1 hour
before the sunset). To examine whether DMS flux variations
can account for the observed atmospheric DMS trend, Frms was plotted as a function of DMS for the reported period (not
shown)
and
the
resulting
correlation
coefficient
r 2 for a linear
regression
was
almost
0 (r2=0.016).
Atmospheric
SO2
derived
from the high frequency sampling of Krischke et al. [this issue], also reported in Figure 6a, shows as well clear diurnal variation, opposite in phase to the DMS pattern. These daytime variations are in line with the results reported by Bandy et al. [1996] and Yvon and Saltzman [1996] for equatorial and tropical Pacific Ocean respectively. MSA and nss-SO4 in aerosol phase, follow the same diurnal trend as SO2 and opposite in phase with that of DMS (Figure 6b). Such patterns are in agreement with the results reported for the same latitudes in the Pacific Ocean by Huebert et al. [1996]. Figure 6c presents the variation of condensation nuclei (CN) as well as the opposite of relative humidity (100 - RH) during the same period. CN follows quite well the variation of all DMS oxidation products, but is found also to be very sensitive to RH variation. Similar trend between CN and RH has been reported during ACE 1 experiment [Bates et
14,442 SCIARE ET AL.: ATMOSPI-•RIC SULFUR-CONTAINING GASES AND PARTICLES
[] DMS Fit DMS ß SO2 •Fit SO2
200
(6a)
,,...•,,
15ø
1
;,
',
,, ? "',
/
\
/r
%,/
,..
100
50
k•' a
o I I I • • MSA ... :.•,•,:½, nss-SO4 25 20 15 10 150 125 lOO 75 3OO 2OO 24/10 12:00 CN, # / cm3 25/10 25/10 26/10 26/10 00:00 12:00 00:00 12:00 Date - 30 - 20 -15 -10 -5 0 27/10 00:00Figure
6. Diurnal
variation
of (a) atmospheric
DMS and
SO2,
(b) particulate
MSA and
nss-SO4,
and
(c) CN
and relative humidity between October 25-26, 1996 during the Albatross cruise.
al., 1998]. Despite the apparent sensitivity of CN and RH and the apparent covariation CN - DMS oxidation products, the lack of physical characterisation of aerosols as well as the low frequency of our measurements of the DMS oxidation products do not allow any quantitative relationship between CN variations and DMS oxidation chemistry.
3.6.2. Chemical box model description. To analyze and improve our understanding on the photochemical processes
controlling DMS oxidation during this 2-day period, we used a chemical box model. The commercially available software FACSIMILE [Curtis and Sweetenham, 1988], which uses automatic time step selection and error control, was used to
solve
the differential
equations
with a high accuracy
required
for chemistry studies. The chemistry model is a condensed chemical mechanism, which, in addition to the background O3fNOx/OH/CO and CH 4 chemistry, also takes into accountSCIARE ET AL.: ATMOSPHE•C SULFUR-CONTAINING GASES AND PARTICLES 14,443
Table 2. Reactions and Corresponding Rates Used to Describe DMS Oxidation Chemistry in the
Chemical Box Model
Reaction Rate Reference
H Abstraction RS1 DMS + OH -} CH3SCH2 +H20 1.13E-11 a x exp(-253/T) RS2 CH3SCH2 +02 -} CH3SCH202 7.3E- 13 RS3 CH3SCH202 + NO --} CH3SCH20+NO2 8.E-12 RS4 CH3SCH20 --} CH3S + HCHO 1.E+ OH Addition RS5 DMS + OH -} DMSOH (1)
RS6 DMSOH +02 -} DMSO + HO2 2.E-12 KT96 RS7 DMSOH +02 --} CH3SOH + CH302 1.E-12 KT96 RS8 DMSOH+ 02 -} DMSOHO2 1 .E- 12 KT96
BrO Reaction With DMS b
RS9 DMS + BRO -} product 4.4E-13 CRO99
CH3S(OH)(OO)CH3 Chemistry CH3S(OH)(OO)CH3 + 02 -• DMSO2 + HO2
DMSO Chemistry
DMSO + OH -} CH3SO2H + CH302
CH3SO2H Chemistry
CH3SO2H + OH -} CH3SO2 + H20 CH3SO2H + NO3 --} CH3SO2 + H20 CH3SO2H + HO2 --} CH3SO2 + HNO3 CH3SO2H + CH302 --} CH3SO2 + CH3OOH
CH•SOH Chemistry
CH3SOH +OH -• CH3SO + H20 CH3SOH +NO3 --} CH3SO 4-HNO3 CH3SOH + HO2 --} CH3SO + H202 CH3SOH + CH302 --} CH3SO2 + CH3OOH
CH•S Chemistry
CH3S + 02 --• CH3SOO CH3SOO -• CH3S + 02
CH3SOO + HO2 -•' CH3SO2H + 02
CH3SOO + CH302 --} CH3SO + HCHO + HO2 CH3S + NO2 --} CH3SO + NO
CH•SO Chemistry
CH3SO --• SO + CH302 CH3SO + 02 --} CH3SOOO CH3SOOO --} CH3SO + 02 CH3SOOO +HO2 --} CH3SOO2H+O2
CH3SOOO + CH302 -• CH3SO2 + CH30 + 02 CH3SO + NO2 --} CH3SO2 + NO
CH3SO + 03 --} CH3SO2 + 02
CH•S02 Chemistry
CH3SO2 '-} CH302 4- SO2 CH3SO2 4- 02 --} CH3SO202 CH3SO202 --} CH3SO2 + 02 CH3SO2 + NO2 --} CH3SO3 + NO CH3SO2 4- 03 -• CH3SO3 4- 02 CH3SO2 4- HO2 --} CH3SO3 4- OH
CH•SO• Chemistry
CH3SO2 4- CH302 --} CH3SO3 4- HCHO + HO2 CH3S + 03 '• CH3SO +02
CH3SO3 --} SO3 4- CH302
CH3SO3 + HCHO -} MSA + HO2 + CO CH3SO3 + DMS -} MSA + CH3SCH2 CH3SO3 + HO2 --} MSA
CH3SO3 + H202 --} MS A + HO2 JPL97 YIN YIN YIN RS 10 1.2E- 12 CP 97 RS 11 8.7E- 11 HYN RS12 1.6E-11 CP 97 RS13 1.0E-13 CP 97 RS 14 1.0E- 15 CP 97 ROHMS3 1.0E- 15 CP 97 RS15 1.1E-10 RS16 3.4E-12 RS 17 8.5E-13 RS 18 8.5E- 13 RS19 5.8E-17 RS20 6.E+2 RS21 4.E-12 RS22 5.5E-12 RS23 6.1E-11 RS24 RS25 RS26 RS27 RS28 RS29 RS30 RS31 RS32 RS33 RS34 RS35 RS36 2.7E+32 x exp(-0.1/0.0019872/T) 7.7E-18 1.7E+2 3.E-12 5.5E-12 3.E-12 2.E-12 2.6E11 x exp(-9056/T) 2.6E-18 3.3 1.E-14 5.E-15 2.5E-13 2.5E-13 6.E-12 1.1El7 x exp(-12057/T) 1.6E-15 6.8E-14 5.E-11 3.E-16 RS37 RS38 RS39 RS40 RS41 RS42 RS43 YIN YIN YIN YIN YIN YIN YIN YIN YIN YIN YIN YIN YIN YIN YIN YIN AYE YIN YIN YIN YIN YIN YIN YIN AYE YIN YIN YIN YIN
14,444 SCIARE ET AL.: ATMOSPHERIC SULFUR-CONTAINING GASES AND PARTICLES
Table 2. (continued)
Reaction Rate Reference
$02 Chemistry
RS44 SO2 + OH • HSO3 (2) YIN
RS45 SO2 + HO2 • 803 + OH 1.E-18 YIN
RS46 SO2 + CH302 • HCHO + HO2 + SO3 5.E-17 YIN
RS47 HSO3 + 02 • 803+ HO2 1.0E-11 x exp(-1000/T) YIN
RS48 SO3 + H20 --• H2SO4B 9.1E-13 YIN
RS49 SO2 + 03 • PROD1 3.E-12 x exp(-7000/7) YVO96
S02 Heterogeneous Oxidation
RS50 SO2 (incloud) -• H2SO,B 1.1E-6 YVO96
RS51 SO2 (on sea-salt) • H2SO,P 8.3E-5 [Krischke et al., this issue]
SO Chemistry
RS52 SO + 02 • SO2 + O 1.4E-13 x exp(-4.52/0.0019872/7) YIN
RS53 SO + NO2 -• SO2 + NO 1.4E-11 YIN
RS54 SO + O3 • SO2 + 02 1.8E-15 x exp(-2.33/0.0019872/7) YIN
RS55 SO + OH • SO2 + HO2 1.1E-10 YIN
Note: T is air temperature in kelvins. a Read 1.1E-11 as 1.13 x 10⁴•. b Not included in the basic simulation. (1) ROHDMSA=
RX1/RX2, where RXI= 1.7E-42 x exp(7810/T) x AIR x 0.2197 and RX2=l+5.5E-31 x exp(7460/T) x AIR x 0.2197. (2)
ROHSO2= RX1/(1. + RX1/RX2) x (0.5)(1./(1. + [LOG10(RX1/RX2) ]2)), where RXI= 3.0E-31 x (T/300) -3'3 x AIR and RX2=
1.5E-12. References: JPL97, De More et al. [1997]; KT96, Koga and Takana [1996]; CRO99, Ingharn et al., [1999]; YIN, Yin et al. [ 1990]; AYE, Ayers et al. [ 1996]; YVO96, Yvon and Saltzrnan [ 1996]; CP 97, Capaldo and Pandis [ 1997].
the oxidation chemistry of NMHC including biogenic hydrocarbons and sulfur compounds. The C•-C5 hydrocarbon chemistry in this scheme has been validated against a detailed chemistry scheme (about 10,000 reactions [Poisson, 1997; Poisson et al., 1999]) and is also used in a global three-
dimensional model [Kanakidou and Crutzen, 1999].
3.6.2.1. DMS oxidation chemistry: For the present study, this scheme has been complemented to describe DMS oxidation chemistry initiated by OH radicals. The adopted DMS chemistry is presented in Table 2 and is structured following the DMS oxidation scheme published by Yin et al. [1990] and reduced as suggested by Capaldo and Pandis [1997]. For SO2, in-cloud oxidation occurs with a pseudo
first-order
rate of 1.1x10
'6 s
'•, whereas
for its loss
on sea-salt
aerosols
the value of 8.3 x 10
-s s
-1 has been adopted
(calculated from the second order constant estimated by Krischke et al. [this issue] during this cruise, and the particle number during these days).
The temperature-dependent rates of decomposition of CH3SO2 and CH3SO3, estimated by Ayers et al. [1996] following the laboratory observations by Good and Thynne
[1967] and Turnipseed and Ravishankara [1993], replaced the recommended by Yin et al. [ 1990] values.
3.6.2.2. Physical processes: A constant sea-to-air flux of
DMS of 4.0+0.9
pmol m
-2 d -•, experimentally
calculated
during this work, has been used in the model for the studied 2-day period. These emissions are assumed to be uniformly distributed in the mixed layer of 550 m and thus correspond
to a production
rate
for DMS of 6.34 104
molecules
cm
'3 s
4.
Vertical entrainment of air from the free troposphere to the mixed layer is also taken into account. This air is assumed to contain no sulfur compounds. An entrainment velocity of 0.168 cm/s is adopted for DMS, MSA and H2804, as suggested by Yvon et al. [1996] and in agreement with the range of 0.1 to 0.5 cm/s suggested by Lenschow et al. [1988].
In our model this correspond to a pseudo first-order loss rate of 3.05 10 '6 S -1.
Dry deposition Va, which is species specific, is taken into account in the model. In particular, deposition velocities have been used for DMSO and DMSO2 (0.5 cm/s), MSA and fine SO4 (0.1 cm/s), and for large SO4 particles (produced in our model by heterogeneous reactions of SO2 on sea-salt particles: 0.7 cm/s). For SO2 the empirical formula relating Va and wind
speed
U proposed
by Yvon
et al. [1996]
(Va
= 1.2 10
-3
x U) is
used.
3.6.2.3. Input parameters: Hourly mean observations of H20, pressure, temperature, photolysis frequencies of NO2
(JNO2)
and 03 to O•D (JOID), 03, NO, NO2, CO, C2H6,
C2H4, C3H8, H202, and HCHO were used as input to the box model every hour. Thus physical processes (emissions, deposition, transport) important for such relatively long-lived species are taken into account every hour in our box models. This approach would not be valid if transport processes were sufficiently rapid. In this case dilution would impact on the behavior of short-lived species. Indeed, this did not occur during the studied 2 days since no significant changes in the origin of sampled air masses took place that period. HNO3 concentrations were fixed to 10 pptv at the beginning of the simulations, which corresponds to the observed mean value over that period. CH4 concentrations were fixed to 1.8 ppmv at the beginning of the simulations. The photolysis rates of
reactions
other
than
photodissociation
of 03 to O(•D) and
NO2, were calculated by a radiative transfer model using the
two stream method [Brahl and Crutzen, 1988]. The model
results were adjusted to reproduce the measured photolysis frequencies of NO2 and 03.
3.6.2.4. Scenarios: To investigate the importance of OH
radical in DMS oxidation the first simulation of DMS diurnal
cycle has been performed with DMS chemistry scheme as shown in Table 2 but neglecting the reaction of DMS with
SCIARE ET AL.' ATMOSPHERIC SULFUR-CONTAINING GASES AND PARTICLES 14,445 • model OH A -- model OH B -- c• - model BrO a DMS experimental
.... OH
model
8E+6
6E+6 150 •4E+6
'•
10050
e' ©
- 2E+6
0 0E+0 0 0 0 0 0 0 0 0 0 0 0 0 0 0 0 0 0 0 0 ('0 f• (3') ('xl LO oO •- 0 0 0 0 0 •- •-- •- 04 0 Hour (GMT)Figure 7. Comparison
between
the model
results
and the
DMS observations during the Albatross cruise and for the period October 25-26, 1996.BrO. For this first simulation (reported as "OH A" in Figure 7), the rate of the OH addition and H abstraction pathways of
DMS with OH reaction are taken from Atkinson et al. [1997]
recommendations. A second simulation (reported as "OH B" in Figure 7) has been performed as above but by increasing the reaction rates of DMS with OH by 30% to fit the laboratory measurements by Barnes et al. [1996]. Finally, a third simulation (reported as "BrO" in Figure 7) has been performed by using the Atkinson et al. [1997] reaction rates and taking into account the depletion of DMS by BrO assuming that this reaction leads by 100% to DMSO [Ingham
et al., 1999]. For this simulation a constant BrO concentration
of 3 pptv has been used during the day from 0900 UT to 1800 UT. This value is almost 2 times higher than the model estimates by Vogt et al. [1999]. It is, however, close to the lower end of 4-17 pptv observed by Hausmann and Platt [1993] in the Arctic boundary layer air in spring and much lower than the observations by Hebestreit et al. [ 1999] at mid latitudes, where high values of BrO up to 80 pptv where measured. All three simulations have been performed twice: once by adopting the mean DMS sea-to-air flux calculated
experimentally
during
this cruise
of 4 pmol m
-2 d -1 and a
second time by adopting the upper limit of our DMS flux of 5
pmol
m
-2
d -1.
3.6.3. Chemical model results and discussion. When
adopting
the mean
DMS flux of 4 pmol
m
-2
d -1 in our
model,
the calculated evening recovery of DMS, which is modulated by the sea-to-air flux of DMS and starts when its chemical sink becomes negligible, is rather slow compared to the observations. A sharper recovery of DMS during the evening hours, similar to that observed, is simulated when adopting the upper limit of the experimentally calculated DMS sea-to- air flux. Therefore only the second set of simulations, using
DMS flux of 5 pmol
m
-2 d -1 will be further
presented
and
discussed.
The simulated mean diurnal variations of DMS for the
three scenarios are shown in Figure 7 and compared with observations. Focusing on the two first simulations named
"OH A" and "OH B". It is obvious that for both scenarios the
DMS simulated concentrations are significantly higher than the observations. Similar results have been obtained by Yvon et al. [1996], who pointed out the need of an increase of the photochemical oxidation rate of DMS by a factor of 2 to reproduce the observed atmospheric DMS diurnal cycle. On the other hand, the chemical model is able to approximately
simulate the diurnal trend of DMS with a maximum in the
morning hours and a minimum in the afternoon. However, the DMS recovery, that occurs in the evening when the chemical sink of DMS becomes very weak starts earlier in the simulation. It appears that the chemical sink of DMS in the model is rather weak by the end of the afternoon. In the model this sink is occurring by reaction with OH radical. In addition, the simulated by the model OH radical diurnal distribution agrees remarkably well with the observed OH radical levels (T. Brauers et al., unpublished manuscript, 1999). Note that
uncertainties in the DMS flux calculation are at least of a factor of 2. In our simulation DMS flux has been calculated
using the Liss and Merlivat [1986] parameterization. The use of one of the other two existent parameterizations for DMS flux calculation, that is, that proposed by Smethie et al. [1985] or Wanninkhof [1992], resulted in a DMS flux higher by a factor of 1.25 to 1.6 to our input value, respectively. Such high DMS fluxes are not consistent with our DMS
measurements since it would increase more the simulated DMS concentrations.
A possible explanation for the discrepancy between model results and observations is that other radicals like BrO might significantly contribute to the DMS sink and particularly to the morning and late afternoon DMS depletion. Indeed, according to model calculations by Toumi [1994] and Vogt et al. [1999], BrO radicals are expected to present a diurnal pattern different from that of OH, increasing sharply in the .morning, decreasing very sharply by the end of the day and in between showing a local minimum. Such a diurnal profile could correspond to the missing afternoon sink of DMS. Indeed, when assuming that BrO is present in the marine
o SO2 experimental .... Fit SO2 ß SO2 model
25 2O 15 ß ß /'ß
ß .
/'
ß
11
1
1
lllllllll
[ [ [ O O O O O O O O O O Hour (GMT)Figure 8. Comparison between the model results and the SO2 observations during the Albatross cruise and for the period