HAL Id: halshs-02872212
https://halshs.archives-ouvertes.fr/halshs-02872212
Preprint submitted on 17 Jun 2020HAL is a multi-disciplinary open access archive for the deposit and dissemination of sci-entific research documents, whether they are pub-lished or not. The documents may come from teaching and research institutions in France or abroad, or from public or private research centers.
L’archive ouverte pluridisciplinaire HAL, est destinée au dépôt et à la diffusion de documents scientifiques de niveau recherche, publiés ou non, émanant des établissements d’enseignement et de recherche français ou étrangers, des laboratoires publics ou privés.
Andrew E. Clark, Hippolyte d’Albis, Angela Greulich
To cite this version:
Andrew E. Clark, Hippolyte d’Albis, Angela Greulich. The Age U-shape in Europe: The Protective Role of Partnership. 2020. �halshs-02872212�
WORKING PAPER N° 2020 – 34
The Age U-shape in Europe: The Protective Role of Partnership
Andrew E. Clark Hippolyte D’Albis
Angela Greulich
JEL Codes: I38, J13, J18
1
The Age U-shape in Europe:
The Protective Role of Partnership
A
NDREWE.
C
LARK Paris School of Economics - CNRSH
IPPOLYTE D’A
LBIS Paris School of Economics - CNRSA
NGELAG
REULICH Sciences Po - OSC [email protected] June 10th 2020 AbstractWe here ask whether the U-shaped relationship between life satisfaction and age is flatter for those who are partnered. This is the case in cross-section EU-SILC data, where the drop in life satisfaction from the teens to the 50s is almost four times larger for the non-partnered than for the partnered, whose life satisfaction essentially follows a slight downward trajectory with age. However, the same analysis in three panel datasets (BHPS, SOEP and HILDA) reveals a U-shape for both marital groups, although still somewhat flatter for the partnered than for the non-partnered. We suggest that the difference between the cross-section and panel results reflects compositional effects: there is in particular a significant shift of the relatively dissatisfied out of marriage in mid-life. These composition effects will flatten the U-shape in age for the partnered in cross-section data.
Keywords: Age U-shape, Subjective Well-being, Marriage, EU-SILC. JEL Classification Codes: I38, J13, J18.
* We gratefully acknowledge financial support from Agence Nationale de la Recherche within the JPI MYBL framework (Award No. ANR-16-MYBL-0001-02). We thank Andrew Oswald, Nick Powdthavee and seminar participants at ISQOLS (Granada), the Age Well Accounts workshop in Vienna and the Demographic Aspects of Human Wellbeing Conference for helpful comments. We are very grateful to Anthony Lepinteur for help and advice with the panel data analysis.
2
1. Introduction
The shape of the relationship between subjective well-being and age has been one of the recurrent themes in the literature. While some contributions have suggested an essentially flat relationship (for example, Kassenböhmer and Haisken-DeNew, 2012), many have concluded as to a U-shape (recent examples using data from a variety of different can be found in Cheng et al., 2017, and Blanchflower, 2020). This literature is now voluminous, and useful summaries appear in three chapters in the recent book edited by Mariano Rojas (Blanchflower and Oswald, 2019, Clark, 2019, and Helliwell et al., 2019).
While there is majority agreement in the literature about the U-shape, there is much more debate about what lies behind it and whether it holds equally for all countries and all groups in society. We here contribute to the second of these discussions, and analyse whether the U-shaped relationship between life satisfaction and age is flatter for those who are partnered and for those with children.
We are not the first to consider this question. Helliwell et al. (2019) consider an interaction between marriage/cohabitation and age in subjective well-being regressions from both the US Gallup Healthways data and the UK Annual Population Survey. They find a substantially flatter U-shaped relationship between well-being and age in both of these cross-section datasets, which is only partly explained by control variables (sex, education, labour-force status, log income and the number of children). A flatter U-shape for the married is also found in an analysis of the Gallup World Poll data in Jebb et al. (2020), imposing a quadratic relationship between age and the Cantril ladder well-being question; however, the authors argue that the difference between the two curves is not large.
Using a very large-scale harmonised database covering 32 European countries, the EU-SILC, we first show that the U-shape holds in general in Europe, as is very standard in the empirical literature. Moreover, as in Helliwell et al. (2019), this U-shape is far flatter for the
3
partnered: the age U-shape is concentrated amongst those who are not partnered. However, this is not a general phenomenon of subjective evaluations, as this protective role of partnership is found in particular for overall life satisfaction, satisfaction with financial situation and satisfaction with personal relationships, but not at all for job satisfaction or satisfaction with time use. As such, being partnered seems to protect at least some domains of subjective well-being against the typical fall in well-being associated with middle age.
This first result is however less clear in panel data. Fixed-effect analyses using the BHPS (UK), the SOEP (Germany) and HILDA (Australia) uncover U-shapes in age for both the partnered and the non-partnered, although the U-shape for the partnered is again somewhat flatter. We consider a number of explanations of this gap between the cross-section and panel results. In particular, we do not believe that this reflects the different countries in the cross-section and panel analyses, nor differential mortality between the partnered and non-partnered. However, we do find some evidence of compositional effects that will flatten the U-shape in age for the partnered in cross-section: those who break up in their 40s and 50s are noticeably less satisfied with their lives than those who break up at younger or older ages.
The remainder of the paper is organised as follows. Section 2 describes the European data that we use and the hypotheses that we test. The main cross-section results then appear in Section 3, and an analysis of panel data in selected countries in Section 4. Last, Section 5 concludes.
2. Life Satisfaction, Age and Partnership: Cross-Section Analysis of
EU-SILC Data
Our main analysis of subjective well-being by age and gender is based on from the EU statistics on income and living conditions (EU-SILC) survey run by Eurostat, which provides
4
harmonised information on hundreds of thousands of respondents in over 30 different European countries. This annual survey is the reference source for comparative statistics on income distribution and social inclusion in the European Union (EU). It provides information on both households and individuals (micro-level) in terms of income and tax, material deprivation, housing conditions, employment, childcare, health and education.
Additional specific topics are covered in ad hoc annual modules. These complement the core variables that appear in every EU-SILC wave with supplementary information that highlights different aspects of social inclusion. Examples of the topics covered in these modules are the intergenerational transmission of poverty (2005 and 2011), social participation (2006 and 2015), indebtedness (2008) and the intra-household sharing of resources (2010). The EU-SILC 2013 ad hoc module provided information on well-being
for 350 000 individuals in 32 different European countries.1
EU-SILC is a panel dataset with four-year rotation (so that 25% of the sample are replaced each year). The 2018 EU-SILC wave repeated the well-being module, but the gap between the two waves is large enough that none of the 2013 respondents remain in the 2018 sample. We will therefore carry out a cross-section analysis of the 2013 data.
The well-being module aims to provide greater emphasis on individuals’ feelings of well-being, which are known to be highly correlated with social inclusion and integration into the labour market. The module includes subjects like satisfaction with different life domains, the emotional state of mind, social deprivation, and the possibility to ask for help if necessary. All questions are asked at the individual level (to household members aged 16 and over).
1 Austria, Belgium, Bulgaria, Switzerland, Cyprus, the Czech Republic, Germany, Denmark, Estonia, Greece,
Spain, Finland, France, Croatia, Hungary, Ireland, Iceland, Italy, Lithuania, Luxembourg, Latvia, Malta, Netherlands, Norway, Poland, Portugal, Romania, Serbia, Sweden, Slovenia, Slovakia and the United Kingdom.
5
Survey design can have an impact on individual replies. This can include the placement of the well-being module in the survey questionnaire (see Deaton, 2012) or the response scales used and the way in which respondents perceive them in different countries. As the order of questions within the module and the module questionnaire’s position in the survey were mostly standardised across countries, Eurostat considers the contribution of these parameters to the overall context–related bias to be minimal. For further details on the assessment of the implementation of the 2013 EU-SILC module on wellbeing, see Eurostat (2012a).
The main dependent variable in our analysis is ‘overall life satisfaction’, with replies on
a scale from 0 (not at all satisfied) to 10 (completely satisfied).2 Life satisfaction is intended
to capture a broad, reflective appraisal that the person makes of his or her life taken as a whole. The term ‘life’ is intended to be understood here as all of the areas of a person’s life at a particular point in time (Diener, 2006, Guidelines for National Indicators of Subjective Well-Being and Ill-Being). The variable captures the respondent’s opinion/feeling about how they are feeling “these days”, rather than specifying an explicit longer or shorter time period. The intent is thus not to measure the individual’s current emotional state (or affect) but for them to make a reflective judgement on their satisfaction with their life overall
(Eurostat, 2012b).3
The weighted average overall life-satisfaction score in the 2013 EU-SILC, covering all 32 European countries and considering respondents up to age 80, is 7. Table A1 in the Appendix shows the average life-satisfaction scores, as well as the percentage partnered, by the different age groups that we will analyse.
2 The validity of life satisfaction as a measure of well-being is discussed in Clark (2016).
3 Although (recent) mood and life satisfaction may be strongly correlated between themselves, and be
6
Average overall life satisfaction appears in the middle of the ranking of the more specific domain-satisfaction variables: satisfaction is lower for ‘trust in the political system’, ‘trust in the legal system’, ‘trust in others’, ‘satisfaction with the financial situation’, ‘trust in the police’ and ‘satisfaction with time use’; higher scores are found for ‘satisfaction with recreational or green areas’, ‘satisfaction with the living environment’, ‘job satisfaction’, ‘satisfaction with commuting times’, ‘meaning of life’, ‘satisfaction with accommodation’ and ‘satisfaction with personal relationships’. It should, however, be underscored that ‘overall life satisfaction’ comes from a question in its own right in the SILC questionnaire, and is not a calculated as a summary measure of the various domain satisfaction scores.
The cross-country distribution of life satisfaction is similar to that found in other surveys (see, for example, the distribution of the answers to the Cantril ladder question in the Gallup World Poll that is presented in the annual World Happiness Report). Overall life satisfaction is generally higher in the North of Europe and lower in the South, as illustrated in Figure 1’s heatmap.
7
Figure 1: Overall Life Satisfaction in 32 European Countries
Data source: EU-SILC 2013.
The lowest life-satisfaction score on the 0-10 scale is found in Bulgaria (4.8), followed by Serbia (4.9) and Portugal (6.1), and the highest in Switzerland (8.0), followed by Finland (7.9) and Denmark (7.87).
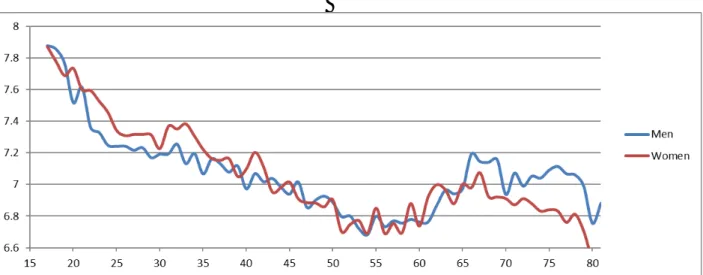
The relationship of life satisfaction to age and sex is depicted in Figure 2. As with all of the empirical analysis, we only consider respondents up to age 80. Combining all countries together, women are found to be unhappier at higher ages, and happier at younger ages compared to men.
Mean Life Satisfaction
8
Figure 2: Overall Life Satisfaction by Age and Sex
Notes. The figures here are weighted averages over 32 European countries. The points refer to three-year
(with respect to age) moving averages.
Data source: EU-SILC 2013.
However, we did not find any systematic gender gap in overall life satisfaction within couples, independent of the man’s age, the woman’s age and the size and direction of the age difference within the couple. The distribution of the absolute difference in life satisfaction between the two couple members is normally distributed around zero, with 40%
of couples reporting zero difference.4 This suggests that the gender gap in life satisfaction at
younger and older ages in Figure 2 reflects partnership status. We do indeed find that women are more likely to be partnered at younger ages and less likely to be partnered at older ages, as illustrated in Figure 3.
4 Guven et al. (2012) show that life satisfaction gaps between partners predict future separation in German
9
Figure 3: Partnership Status by Age and Sex
Notes. The figures here are weighted averages over 32 European countries. The points refer to three-year
(with respect to age) moving averages.
Data source: EU-SILC 2013.
To see if the gender difference in life satisfaction disappears once we control for partnership status, we estimate, in a first step, life satisfaction as a function of age, sex and partner status. We control for country fixed effects in order to focus on variations within-country only. The results presented in the following are based on OLS regressions.
The results appear in Table 1, with first a stripped down model controlling only for age (as 10-year age-group dummies) and country dummies, then a second specification with an additional control for sex, and a last specification controlling for both sex and partner status. An individual is considered as ‘partnered’ when observed to be cohabiting with a partner at the time of the survey. Note, however, that results are robust when considering only those who are married as being ‘partnered’.
10
Table 1. Life Satisfaction by Age, Controlling for Sex and Partnership Status
Overall Life Satisfaction
(1) (2) (3) Ages 15-19 1.149*** 1.149*** 1.648*** (56.01) (55.99) (78.51) Ages 20-29 0.644*** 0.643*** 0.959*** (51.35) (51.33) (74.62) Ages 30-39 0.477*** 0.477*** 0.503*** (41.40) (41.40) (44.11) Ages 40-49 0.225*** 0.225*** 0.217*** (20.81) (20.81) (20.36)
Ages 50-59 Ref. Ref. Ref.
Ages 60-69 0.160*** 0.160*** 0.180*** (14.86) (14.86) (16.88) Ages 70-80 -0.00444 -0.00427 0.134*** (-0.42) (-0.40) (12.54) Female -0.00494 0.0493*** (-0.75) (7.57) Partnered 0.670*** (92.52) Constant 7.613*** 7.616*** 7.084*** (361.22) (356.39) (323.53) N 370074 370074 370074 adj. R-sq 0.153 0.153 0.172
Notes. These are OLS regressions with country-fixed effects. Ages 15-80. T-statistics appear in parentheses.
* p<0.05, ** p<0.01, *** p<0.001.
Data source: EU-SILC 2013.
In column 1, life satisfaction is highest for teenagers and lowest for those in their 50s, and then again for those in their 70s. Column 2 then controls for sex, which does not much change the estimated age coefficients, while the difference in life satisfaction between men and women appears to be insignificant once we control for age. Last, in column 3 there is a
11
small but significant gender difference, with women being somewhat more satisfied than
men once we control for age and partnership.5 Partnership itself turns out to be highly
correlated with overall life satisfaction, with the partnered being significantly more satisfied than the non-partnered. The effect size here is large, at two-thirds of a life-satisfaction point, or almost a third of a standard deviation. Comparing columns 1 and 3 of Table 1 shows that controlling for partnership deepens the U-shape, suggesting again that partnership plays a role in the age-satisfaction relationship.
To see whether the age pattern of life satisfaction differs significantly between the partnered and non-partnered, we now run separate regressions for the two groups, and interact age, sex and partnership status. Table 2 shows the results, with the first two columns referring to the partnered and columns 3 and 4 to the non-partnered. Columns 1 and 3 control for age and country-fixed effects only, while Columns 2 and 4 also include sex. Column 5 last shows the estimation results when we analyse the whole sample together and introduce interactions between age, sex and partnership.
The results are very different by partnership status. In columns 1 and 2, there are no longer significant life-satisfaction differences between most of the age groups for the partnered. On the contrary, the estimated age-coefficients remain highly significant for the non-partnered, and continue to show a U-shaped relationship with life satisfaction, with those in their 50s being the least satisfied. The comparison of columns 2 and 4 show that the drop in life satisfaction from the teens to the 50s is almost four times larger for the
non-partnered than for the non-partnered.6 Last, women continue to report slightly higher life
satisfaction than men in both partnership groups.
5 The finding that women report higher life satisfaction than men is common in the literature: see
Nolen-Hoeksema and Rusting (1999).
6 Partnership is then not only associated with higher mean life satisfaction but also with lower within-person
12
Table 2. Life Satisfaction by Partner Status
Overall Life Satisfaction
(1) (2) (3) (4) (5)
Partnered Partnered Non-Partn. Non-Partn. All
Ages 15-19 0.492** 0.478** 1.772*** 1.778*** 1.873*** (2.68) (2.61) (69.75) (69.88) (52.75) Ages 20-29 0.506*** 0.499*** 1.224*** 1.231*** 1.248*** (25.46) (25.06) (61.35) (61.48) (43.82) Ages 30-39 0.490*** 0.487*** 0.540*** 0.545*** 0.649*** (37.94) (37.70) (23.49) (23.70) (19.92) Ages 40-49 0.235*** 0.234*** 0.148*** 0.150*** 0.184*** (19.79) (19.69) (6.55) (6.63) (5.47)
Ages 50-59 Ref. Ref. Ref. Ref. Ref.
Ages 60-69 0.130*** 0.132*** 0.312*** 0.308*** 0.313*** (10.85) (11.02) (14.36) (14.17) (8.95) Ages 70-80 0.0314* 0.0373** 0.311*** 0.304*** 0.462*** (2.43) (2.88) (16.04) (15.56) (14.02) Female 0.0554*** 0.0486*** 0.129*** (7.01) (4.15) (4.27) Partnered 0.867*** (32.47)
Ages 15-19, non-partnered, female -0.154**
(-3.19)
Ages 15-19, partnered, male -0.966*
(-2.46)
Ages 15-19, partnered, female -1.572***
(-6.99)
Ages 20-29, non- partnered, female 0.0205
(0.54)
Ages 20-29, partnered, male -0.766***
(-17.17)
Ages 20-29, partnered, female -0.772***
13
Ages 30-39, non-partnered, female -0.169***
(-3.84)
Ages 30-39, partnered, male -0.155***
(-4.04)
Ages 30-39, partnered, female -0.203***
(-3.48)
Ages 40-49, non-partnered, female -0.0562
(-1.29)
Ages 40-49, partnered, male 0.0851*
(2.23)
Ages 40-49, partnered, female -0.0122
(-0.21)
Ages 50-59, partnered, female -0.0378
(-1.09)
Ages 60-69, non-partnered, female -0.0118
(-0.27)
Ages 60-69, partnered, male -0.167***
(-4.26)
Ages 60-69, partnered, female -0.224***
(-3.74)
Ages 70-80, non-partnered, female -0.204***
(-5.11)
Ages 70-80, partnered, male -0.361***
(-9.57)
Ages 70-80, partnered, female -0.529***
(-8.92) Constant 7.811*** 7.783*** 7.031*** 7.002*** 6.913*** (310.97) (305.92) (190.46) (186.22) (226.26) N 232684 232684 137390 137390 370074 Adj. R-sq 0.172 0.172 0.158 0.158 0.175
Notes. These are OLS regressions with country-fixed effects. Ages 15-80. T-statistics appear in parentheses.
* p<0.05, ** p<0.01, *** p<0.001.
14
Figure 4 illustrates the estimated life satisfaction scores by age, sex and partner status from column 5 of Table 2. While life satisfaction is clearly U-shaped for the non-partnered, the pattern is relatively flat for the partnered individuals. The U-shape is the most profound for non-partnered men, who are the least satisfied at ages 50 to 59, and somewhat more satisfied than non-partnered women at ages 70-80. Note that the confidence intervals are large for partnered women and men at ages 15 to 19, as few respondents cohabit with their partners before the age of 20.
Figure 4: Illustration of the Predictive Margins
Notes. These are calculated from the OLS regression with country-fixed effects in column 5 of Table 2.
Ages 15-80.
Data source: EU-SILC 2013.
The results above come from a very stripped-down specification. However, they do not change in nature when we add more variables to look for potential confounders in the relationship between age, partnership and life satisfaction. We considered country of birth (Native, European, and Other), the degree of urbanization, living in a relatively rich country (as measured by GDP per capita in PPP terms), education, and both individual and household
6 6 .5 7 7 .5 8 8 .5 L in ea r P re di c ti on of O v er a ll L if e S a ti s fa c ti on 15-19 20-29 30-39 40-49 50-59 60-69 70-80 Age Categories
Non-Partnered Men Non-Partnered Women Partnered Men Partnered Women
15
income. Within each education and income group, the U-shaped pattern of life satisfaction remained much sharper for the non-partnered than the partnered.
We also considered different measures of subjective well-being, replacing life satisfaction by ‘meaning of life’, ‘satisfaction with financial situation’, ‘satisfaction with personal relationships’ and the ‘possibility to make ends meet’. We find a flatter U-shape for the partnered relative to the non-partnered for all four of these variables. The protection from partnership may then be partly financial. On the contrary, we find no significant
differences by age groups, sex and partnership status for job satisfaction.7 Last, for
satisfaction with time use, we find a U-shape in age, but with a minimum (at age 30 to 39) that is lower than the figure for overall life satisfaction in Table 2. The highest level of satisfaction with time use comes about at ages 60 to 69. There are few significant differences in satisfaction with time use between men and women or between partnered and non-partnered.
We might wonder whether our results for partnership reflect the presence of children in the household. We can only control for the number and age of children who are living in the household, which information becomes increasingly selective with respondent age as empty-nesting becomes more prevalent. We therefore controlled for children by limiting the sample
to individuals aged 16 to 44.8 Overall life satisfaction does not differ significantly by age for
men and women with children, whereas it drops significantly from age 16 to age 44 for both childless men and childless women. Within the group of partnered individuals, there is, however, no significant difference in life satisfaction by age between childless individuals
7 Helliwell et al. (20l9) suggest that the flatter U-shape for the married may come about as “together spouses
can better shoulder the extra demands that may exist in mid-life when career and other demands coincide”.
The fact that we do not find this for job or time-use satisfaction seems at odds with their hypothesis.
8 The Eurobarometer data used by Blanchflower and Clark (2020) also only records information on children
16
and those with children. The presence of children seems thus to play a less important role
for overall life satisfaction than does partnership status, at least for adults aged up 44.9
We last carry out a country-by country analysis. In each of the 32 European countries in our sample, the pattern of overall life satisfaction over age is relatively flat for the
partnered and U-shaped for the non-partnered, independent of their sex.10
Our cross-sectional analysis based on EU-SILC thus suggests that the U-shaped pattern of life satisfaction by age holds for non-partnered individuals but largely disappears for the partnered. Gender differences in overall life satisfaction then seem to be mainly caused by age-specific gender differences in the likelihood of being partnered. However, the results from cross-section analysis will not necessarily translate into panel data if there is selection into partnership. Not only is it possible that those who are more satisfied select into partnerships (as in Stutzer and Frey, 2006), but it also is quite likely that people who are not satisfied with their relationship (and therefore have lower overall life satisfaction scores)
select out of partnership.11 Once they find a new relationship that makes them happy, they
will re-enter our sample of cohabiting partners. Both of these sources of endogeneity make it more difficult to conclude that partnership protects against the U-shape, as it is not the same people who are partnered (and therefore not the same people who are non-partnered) at different ages.
To shed light on the causal impact of partnership on life satisfaction in a life-cycle perspective, we need to add panel data to our cross-sectional analysis. If partnership protects against the U-shape, we should find that the age profile of the partnered in panel data (i.e.
9
Only when we focus on satisfaction with time use do we find that partnered childless men and women report significantly higher satisfaction as compared to partnered men and women with children.
10 We in addition note that overall life satisfaction minimises at higher ages in Eastern and Southern Europe as
compared to Western and Northern Europe, conditional on partnership status and sex.
11 See the lags and leads analysis of life satisfaction around the time of marital separation using Australian,
17
within the same person) is flatter than that of the non-partnered. The EU-SILC data does not help us here, with its four-year revolving design (and with life satisfaction only being available in 2013 and 2018). We therefore turn to panel data from three of the longest-running panel datasets: HILDA (Australia), BHPS (United Kingdom) and SOEP (Germany).
3. Life Satisfaction, Age and Partnership in Panel Data
Our analysis of panel data uses the same kinds of specifications as the cross-section analysis above. The dependent variable, life satisfaction, is on a 0-10 scale in HILDA and
the SOEP, and a 1-7 scale in the BHPS.12 We standardise the life-satisfaction scores, so that
our correlations are in terms of standard deviations. We consider those aged 16-80, and split age up into dummies for the categories 15-19, 20-29, 30-39, 40-49, 50-59, 60-69 and 70-80. Partnered is a dummy for marriage or cohabitation. There is a vexed discussion in the literature regarding the controls that should be introduced when analysing the relationship between subjective well-being and age. We here take a minimalist approach, as in our analysis of the EU-SILC data above, and introduce no other controls. All of our regressions here include an individual fixed effect (which subsumes the effect of sex, plus any other variable that is time-invariant).
The regression to be estimated is
LSit,m = β’Ageit,m + μi + εit (1)
where LSit,m is the life satisfaction of individual i at time t in marital status m, Ageit,m is a set
of age dummies, and μi is the individual fixed effect. The presence of the latter implies that
the age coefficients, β, are identified by the same individual as he or she moves from one
age category to the next.
12 Appendix Table A1 shows the average life satisfaction scores and the percentage partnered, by age, in these
18
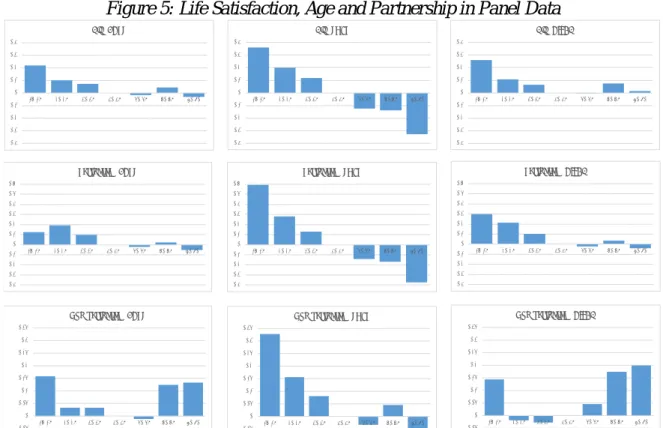
The estimated coefficients from these regressions on our three panel datasets are illustrated in Figure 5. The three columns refer to the BHPS, the SOEP and HILDA respectively. Within each column, the first graph shows the estimated age coefficients from a regression including the whole sample, while the second and third graphs depict those for the partnered and the non-partnered. The Y-axes are standardised within each row. It is immediately obvious that the largest age coefficients are found in the SOEP.
In the first row, the estimated age coefficients suggest something of a U-shaped relationship in both the BHPS and HILDA. On the contrary, the panel results for the SOEP produce a monotonically-negative relationship between life satisfaction and age.
The most important element of Figure 5 in the context of our work here is the comparison of the shapes of the estimated coefficients in the partnered and non-partnered graphs. A broad characterisation of the results here is that the age profile is more U-shaped for the non-partnered than for the partnered, as in EU-SILC. However, this distinction is somewhat less apparent in the SOEP, and in general there is still a noticeable age profile in life satisfaction for the partnered (whereas that for the partnered in the cross-section EU-SILC data was pretty much flat).
19
Figure 5: Life Satisfaction, Age and Partnership in Panel Data
Notes. These are OLS regressions with individual fixed effects. Ages 15-80. Data source: BHPS, SOEP and HILDA.
There is thus only partial agreement between our pooled EU-SILC results in Section 2 and those from the three panel datasets in Figure 5: the partnered continue to drop down the first arm of the U-shape in panel data at least as much as do the non-partnered. We below consider a number of potential explanations of the difference between the pooled and panel results.
3.1. Different Countries
There are 32 different countries in the EU-SILC, and only two of these appear in our panel analysis above. However, when we consider the EU-SILC results for the UK and Germany on their own, they are the same as those for all of the 32 countries in Section 2 above. -0.4 -0.3 -0.2 -0.1 0 0.1 0.2 0.3 0.4 16-19 20-29 30-39 40-49 50-59 60-69 70-80 All - BHPS -0.4 -0.3 -0.2 -0.1 0 0.1 0.2 0.3 0.4 16-19 20-29 30-39 40-49 50-59 60-69 70-80 All - SOEP -0.4 -0.3 -0.2 -0.1 0 0.1 0.2 0.3 0.4 16-19 20-29 30-39 40-49 50-59 60-69 70-80 All - HILDA -0.4 -0.3 -0.2 -0.1 0 0.1 0.2 0.3 0.4 0.5 0.6 16-19 20-29 30-39 40-49 50-59 60-69 70-80 Partnered - BHPS -0.05 0 0.05 0.1 0.15 0.2 0.25 0.3 0.35 16-19 20-29 30-39 40-49 50-59 60-69 70-80 Non-partnered - BHPS -0.4 -0.3 -0.2 -0.1 0 0.1 0.2 0.3 0.4 0.5 0.6 16-19 20-29 30-39 40-49 50-59 60-69 70-80 Partnered - SOEP -0.05 0 0.05 0.1 0.15 0.2 0.25 0.3 0.35 16-19 20-29 30-39 40-49 50-59 60-69 70-80 Non-partnered - SOEP -0.4 -0.3 -0.2 -0.1 0 0.1 0.2 0.3 0.4 0.5 0.6 16-19 20-29 30-39 40-49 50-59 60-69 70-80 Partnered - HILDA -0.05 0 0.05 0.1 0.15 0.2 0.25 0.3 0.35 16-19 20-29 30-39 40-49 50-59 60-69 70-80 Non-partnered - HILDA
20
3.2. Data Comparability
Alternatively, there could be some design issues in the BHPS, SOEP and HILDA that make the results from an analysis of life satisfaction and age there not comparable to the 2013 cross-section data in EU-SILC. But these three datasets have been very widely-analysed in the literature, and when we look at these panel datasets in a cross-section manner we find exactly the same kind of U-shaped patterns as in Figure 4 above: there is a U-shape
in age for everyone, for the partnered and for the non-partnered.13
3.3. Mortality
The U-shape between life satisfaction and age is (of course) estimated using data on the living. This is one potential explanation of the upward-sloping arm of the U-shape: the
dissatisfied die off, leaving an increasingly-selected sample of the (satisfied) living.14 As
such, were mortality and subjective well-being to be unrelated, the well-being profile of the older would be skewed downwards somewhat.
Can mortality explain the different well-being age profiles for the partnered and the non-partnered in cross-section analyses? For this to be the case, we would require first that there is excessive mortality amongst the partnered (relative to the non-partnered), and then that this excessive mortality be especially pronounced in middle age. Neither of these appear likely.
First, UK death rates suggest that there are “not enough” deaths to explain the U-shape: the cumulative death rate from 16 to 55 is only 11 per 1000; that from 16 to 75 is 63 per 1000. Even taking the extreme position of assigning a value of life satisfaction of zero to these missing people reduces average life satisfaction by less than 0.1 of a point at age 55,
13 This cross-section U-shape minimises at age 40-49 in the BHPS and HILDA, and at 50-59 in SOEP. 14 A well-known contribution here is Danner et al. (2001).
21
and by around 0.5 of a point at age 75: these figures are to be compared to the actual observed life-satisfaction gap of -1.2 points at both ages.
Second, we require that there be excess mortality among the partnered. But the existing evidence (see Kravdal et al., 2018) rather suggests a negative relationship between marriage and mortality: protecting the married from mortality means that the non-partnered are more selected, so that their life satisfaction scores are “too high”, which is the opposite of what we find in Figure 4.
3.4. Selection into Marriage
We last consider the role of selection into and out of partnership, and how this composition effect may explain the cross-section gap in life satisfaction between the partnered and the non-partnered in Figure 4.
It is first evident that the percentage partnered changes sharply with age. In the EU-SILC data the percentage of partnered is only 10% in the early 20s, but 80% by age 40. This figure tails off at older ages. One way of squaring the (flat) cross-section and (more U-shaped) panel results is selection into and out of marriage: each individual follows their own U-shape, but there are composition effects of different well-being types in and out of partnership at different ages.
Following our results above, this would require either that those who select into partnership in their 30s and 40s are more-satisfied types (in terms of Equation (1), their
average value of μi is higher) than those who become partnered in their 20s or 60s, and/or
those who select out of marriage in their 30s or 40s are unhappier types. Alternatively, we could allow for heterogeneity in the relationship between life satisfaction and partnership, with those who become partnered in their 30s and 40s experiencing a greater life-satisfaction boost from it than those who marry earlier or later.
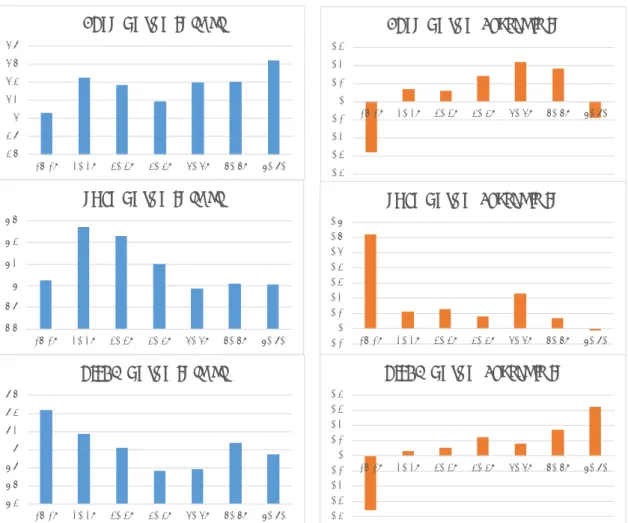
22
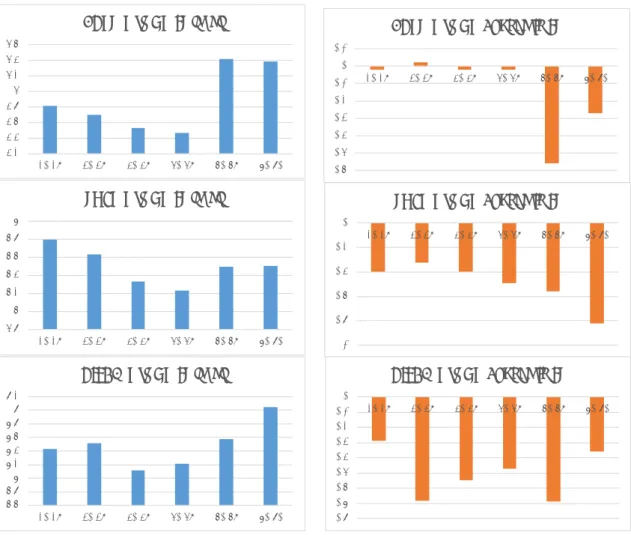
Figures A1 and A2 in the Appendix investigate both of the above possibilities. Figure A1 shows on the left-hand side the level of life satisfaction of those who move from non-partnership to non-partnership (this is the life-satisfaction score they report in the year before they make this move); the right-hand side shows the rise in life satisfaction reported by individuals as they move from non-partnered in wave t-1 to partnered at wave t. The three rows show these numbers for the BHPS, the SOEP and last HILDA.
To explain the difference between the pooled and panel results, we would require that those who move NP-P in their 30s and 40s be more satisfied types than those who make this transition earlier or later (on the left-hand side) or to enjoy a greater satisfaction boost from doing so (on the right-hand side): we should thus be looking for hump-shapes in age.
Figure A1 shows the results for the NP-P movers. There is some evidence of a hump-shape for the BHPS and SOEP in life satisfaction levels (although this occurs in the 20s and 30s, rather than the 30s and 40s). With respect to the change in life satisfaction, on the right-hand side, two points stick out. The first is the large negative change in life satisfaction associated with teen partnership in the UK and Australia, but the large positive change in Germany. The second is the larger rise in life satisfaction for those who become partnered in their 50s, except in Australia. This will flatten the cross-section age profile.
Figure A2 carries out the same exercise for those who leave partnership. There is no column for age 16-19 here, as there are so few people who separate before age 20. As noted above, we are here looking for a U-shaped relationship. There is no evidence of this in the change in life satisfaction around the time of transition on the right-hand side. However, the levels of life satisfaction on the left-hand side do reveal a distinct U-shape: those who move out of partnership in the 40s and 50s are notably less satisfied than those who leave at other ages. The flatter age profile for the partnered in cross-section may therefore partly be explained by a shift-share effect.
23
4. Conclusion
The U-shape relation between life satisfaction and age is a robust finding in the literature but has not yet been fully explored. In this article, we have analysed the possible role of partnership and asked whether it could help protect against the midlife fall in satisfaction. Our findings are mixed and depend strongly on the type of data analysed. The life satisfaction of the partnered appears to be rather flat with age in cross-section data but is U-shaped in the three panel datasets we consider. We believe this difference partly reflects a composition effect: those who leave partnerships in their 40s and 50s are noticeably less satisfied with their lives than those who break up at younger or older ages.
The study of the way in which key demographic, economic and psychological variables change over the life-cycle is dependent on the collection of reliable longitudinal datasets. As we have seen above, imputing life-cycle changes from cross-section data is hazardous. The development and support of panel datasets is a considerable investment for public funding agencies essential to understand the evolution of societies that are composed of individuals who change over time. These panel datasets also favour inter-disciplinary work, with the analysis of well-being arguably being a good example of fruitful cooperation between researchers in a number of different fields.
24
References
Blanchflower, D.G. 2020. “Unhappiness and Age”. Journal of Economic Behavior and
Organization, forthcoming.
Blanchflower, D.G., and Clark, A.E. 2020. “Children, Unhappiness and Family Finances”.
Journal of Population Economics, forthcoming.
Blanchflower, D.G., and Oswald, A.J. 2019. “Do Humans Suffer a Psychological Low in Midlife? Two Approaches (With and Without Controls) in Seven Data Sets”. In M. Rojas (Ed.), The Economics of Happiness: How the Easterlin Paradox Transformed
our Understanding of Well-being and Progress. New York: Springer.
Cheng, T., Oswald, A.J., and Powdthavee, N. 2017. “Longitudinal Evidence for a Midlife Nadir in Human Well-being: Results from Four Data Sets”. Economic Journal 127: 126-142.
Clark, A.E. 2016. “SWB as a Measure of Individual Well-Being”. In M. Adler and M. Fleurbaey (Eds.), Oxford Handbook of Well-Being and Public Policy. Oxford: Oxford University Press.
Clark, A.E. 2019. “Born To Be Mild? Cohort Effects Don't Explain Why Well-Being is U-Shaped in Age”. In M. Rojas (Ed.), The Economics of Happiness: How the Easterlin
Paradox Transformed our Understanding of Well-being and Progress. New York:
Springer.
Clark, A.E., Flèche, S., Layard, R., Powdthavee, N., and Ward, G. 2018. The Origins of
Happiness: The Science of Well-Being over the Life-Course. Princeton NJ: Princeton
University Press.
Clark, A.E., Flèche, S., and Senik, C. 2016. “Economic Growth Evens-Out Happiness: Evidence from Six Surveys”. Review of Income and Wealth 62: 405-419.
Danner, D., Snowdon, D., and Friesen, W. 2001. “Positive Emotions in Early Life and Longevity: Findings from the Nun Study”. Journal of Personality and Social
Psychology, 80: 804-813.
Diener, E. 2006. “Guidelines for National Indicators of Subjective Well-Being and Ill-Being”. Journal of Happiness Studies 7: 397-404.
Eurostat 2012a. EU-SILC MODULE ON WELLBEING. Assessment of the implementation.
Eurostat 2012b. EU-SILC 2013 MODULE ON WELL-BEING - DESCRIPTION OF SILC SECONDARY TARGET VARIABLES. Version 5 – March 2012.
Guven, C., Senik, C., and Stichnoth, H. 2012. “You Can’t be Happier than your Wife. Happiness Gaps and Divorce”. Journal of Economic Behavior & Organization 82: 110-130.
Helliwell, J., Huang, H., Norton, M., and Wang, S. 2019. “Happiness at Different Ages: The Social Context Matters”. In M. Rojas (Ed.), The Economics of Happiness: How the
Easterlin Paradox Transformed our Understanding of Well-being and Progress.
New York: Springer.
Jebb, A., Morrison, M., Tay, L., and Diener, E. 2020. “Subjective Well-Being Around the World: Trends and Predictors Across the Life Span”. Psychological Science 31: 293-305.
Kassenböhmer, S.C., and Haisken-DeNew, J. 2012. “Heresy or Enlightenment? The well-being age U-shape effect is flat”. Economics Letters 117: 235-238.
Kravdal, O., Grundy, E., and Keenan, K. 2018. “The Increasing Mortality Advantage of the Married: The Role Played by Education”. Demographic Research 38: 471-512.
25
Nolen-Hoeksema, S., and Rusting, C.L. 1999. “Gender Differences in Well-being”. In D. Kahneman, E. Diener, and N. Schwartz (Eds.), Well-being: The Foundations of
Hedonic Psychology. New York: Russell Sage Foundation.
Stutzer, A., and Frey, B.S. 2006. “Does Marriage Make People Happy, Or Do Happy People Get Married?”. Journal of Socio-Economics 35: 326-347.
26
Appendix
Table A1: Life Satisfaction, Partnership and Age: Summary Statistics
15-19 20-29 30-39 40-49 50-59 60-69 70-80 All EU-SILC N 10 795 39 256 51 365 65 139 69 543 65 418 68 410 369 926 Life satisfaction 7.80 7.37 7.20 6.98 6.77 6.96 6.84 7.02 (SD 2.06) % Partnered .008 .31 .69 .73 .71 .68 .51 .60 BHPS N 9 869 24 928 29 725 27 593 23 683 18 087 14 937 148 822 Life satisfaction 5.33 5.18 5.12 5.01 5.15 5.48 5.58 5.22 (SD 1.28) % Partnered .004 .21 .61 .69 .74 .72 .55 .54 SOEP N 25 982 91 993 113 673 121 915 96 842 76 424 52 106 578 935 Life satisfaction 7.52 7.25 7.19 7.03 6.88 7.09 7.05 7.10 (SD 1.79) % Partnered .009 .25 .68 .75 .77 .77 .64 .62 HILDA N 17 302 41 847 40 145 42 466 36 424 26 886 18 692 223 762 Life satisfaction 8.17 7.87 7.75 7.66 7.78 8.14 8.34 7.89 (SD 1.48) % Partnered .004 .19 .57 .63 .64 .67 .61 .49
27
Figure A1: The Life Satisfaction of Those Who Move into Partnership
4.6 4.8 5 5.2 5.4 5.6 5.8 16-19 20-29 30-39 40-49 50-59 60-69 70-80 BHPS. NP to P. LS level 6.6 6.8 7 7.2 7.4 7.6 16-19 20-29 30-39 40-49 50-59 60-69 70-80 SOEP. NP to P. LS level 7.4 7.6 7.8 8 8.2 8.4 8.6 16-19 20-29 30-39 40-49 50-59 60-69 70-80 HILDA. NP to P. LS level -0.4 -0.3 -0.2 -0.1 0 0.1 0.2 0.3 16-19 20-29 30-39 40-49 50-59 60-69 70-80 BHPS. NP to P. Change in LS -0.1 0 0.1 0.2 0.3 0.4 0.5 0.6 0.7 16-19 20-29 30-39 40-49 50-59 60-69 70-80 SOEP. NP to P. Change in LS -0.4 -0.3 -0.2 -0.1 0 0.1 0.2 0.3 0.4 16-19 20-29 30-39 40-49 50-59 60-69 70-80 HILDA. NP to P. Change in LS
28
Figure A2: The Life Satisfaction of Those Who Move out of Partnership
-0.6 -0.5 -0.4 -0.3 -0.2 -0.1 0 0.1 20-29 30-39 40-49 50-59 60-69 70-80 BHPS. P to NP. Change in LS 4.2 4.4 4.6 4.8 5 5.2 5.4 5.6 20-29 30-39 40-49 50-59 60-69 70-80 BHPS. P to NP. LS level 5.8 6 6.2 6.4 6.6 6.8 7 20-29 30-39 40-49 50-59 60-69 70-80 SOEP. P to NP. LS level 6.6 6.8 7 7.2 7.4 7.6 7.8 8 8.2 20-29 30-39 40-49 50-59 60-69 70-80 HILDA. P to NP. LS level -1 -0.8 -0.6 -0.4 -0.2 0 20-29 30-39 40-49 50-59 60-69 70-80 SOEP. P to NP. Change in LS -0.8 -0.7 -0.6 -0.5 -0.4 -0.3 -0.2 -0.1 0 20-29 30-39 40-49 50-59 60-69 70-80 HILDA. P to NP. Change in LS