HAL Id: hal-00786300
https://hal.archives-ouvertes.fr/hal-00786300
Submitted on 11 Feb 2013HAL is a multi-disciplinary open access archive for the deposit and dissemination of sci-entific research documents, whether they are pub-lished or not. The documents may come from teaching and research institutions in France or abroad, or from public or private research centers.
L’archive ouverte pluridisciplinaire HAL, est destinée au dépôt et à la diffusion de documents scientifiques de niveau recherche, publiés ou non, émanant des établissements d’enseignement et de recherche français ou étrangers, des laboratoires publics ou privés.
Antonio Stocco, David Carriere, Maximilien Cottat, Dominique Langevin
To cite this version:
Antonio Stocco, David Carriere, Maximilien Cottat, Dominique Langevin. Interfacial behaviour of Catanionic surfactants. Langmuir, American Chemical Society, 2010, 26 (13), pp.10663-10669. �10.1021/la100954v�. �hal-00786300�
Interfacial behaviour of Catanionic surfactants
Antonio Stocco,*,1,† David Carriere,2,3 Maximilien Cottat,1 Dominique Langevin1
1. Laboratoire de Physique des Solides, Université Paris-Sud, UMR CNRS 8502, Bâtiment 510, 91405 Orsay cedex, France.
2. CEA, IRAMIS, UMR 3299 SIS2M, LIONS, F-91191 Gif-sur-Yvette, France. 3. CNRS, IRAMIS, UMR 3299 SIS2M, LIONS, F-91191 Gif-sur-Yvette, France.
Abstract
We report a dramatic increase of foam stability for catanionic mixtures (myristic acid and cetyl trimethylammonium bromide, CTABr) with respect to pristine CTABr solutions. This increase was related to the low surface tension, high surface concentration and high viscoelastic compression moduli, as measured with rising bubble experiments and ellipsometry. Dialysis of the catanionic mixtures has been used to decrease the concentration of free surfactant ions (CTA+). The equilibrium surface tension is reached faster for non dialysed samples, due to the presence of these freeions. As a consequence, the foamability of the dialysed solutions is lower. Foam coarsening has been studied using multiple light scattering: it is similar for dialysed and non dialysed samples and much slower than for pure CTABr foams.
Keywords: catanionics, dynamic surface tension, multiple light scattering, foam.
1. Introduction
Aqueous mixtures of anionic and cationic surfactants (catanionic mixtures) show strongly synergetic behaviour due to mutual electrostatic attraction.1 This leads in particular to deviation from ideal mixing,2 for instance a dramatic decrease in interfacial tension at peculiar ratios has been reported.3, 4 Additional peculiarities such as a two-dimensional gas/condensed phase transition5 and an adsorption energy barrier6 were also observed at the air-water interface. Although some points remain to be elucidated, such behaviours are essentially captured by using or adjusting thermodynamic theories.7 The hypothesis for thermodynamic equilibrium is essentially met in catanionic systems where at least one of the surfactant molecules is “short”, i.e. typically up to 8-12 carbon atoms, and holds even if the other surfactant molecule is significantly longer.8, 9 In such systems, surfactant aggregates, in particular vesicles, form spontaneously,10 their size distribution arises from a competition between energetic and entropic contributions11 and they adapt quickly to the outer conditions (ionic strength, temperature, pH if applicable etc.).12, 13
However, some catanionic systems do not achieve equilibrium within an experimental timescale which can reach several months. For instance, mixtures of linear fatty acids and linear cationic surfactants (e.g. myristic acid and cetyl trimethylammonium bromide or hydroxide) form bilayers which are in a quasi-solid state (gel phase) at room temperature.14-16 As a consequence, the aggregates in solution (discs, icosehedra, lamellar phases etc.17) are quenched at room temperature, which is illustrated e.g. by a size distribution of vesicles which is dependent on sample history instead of final composition.18 This restrained dynamics, combined with strong local electrostatic constraints,19 probably accounts for the high rigidity of the bilayers at zero frequency, as measured by atomic force microscopy on vesicles.20
We expect these peculiar dynamic and mechanical properties of the bilayers to provide original interfacial behaviours, and outstanding properties to systems where adsorption processes and monolayer elasticity are critical. In particular, it has been shown before that such catanionic systems stabilize oil-in-water emulsions with no significant coarsening over several months, and it has been suggested that the adsorption of rigid bilayer fragments - a Pickering-like effect - accounts for these properties.21
Here, we focus on the interfacial properties of air/water interfaces prepared from solutions of rigid catanionic bilayers below the melting point of the surfactant chains (classically referred to as “gel-phase”). With respect to the above-mentioned properties, the most relevant points to
investigate are not only the static interfacial properties as determined at large timescales (Sec. 3.2), but also the dynamics of the adsorption process which show very peculiar two-step processes (Sec. 3.3). This allows us to propose a first explanation for both the foamability and the remarkable foam stability that we report on these systems (Sec. 3.4).
2. Material, preparation and methods 2.1. Materials
Myristic acid (C13COOH, Fluka; Mw = 228 g mol-1) was recrystallized twice from hot
acetonitrile, and cetyl trimethylammonium bromide (CTABr, Mw = 364 g mol-1, cmc = 0.36 gL-1) was purchased from Sigma and used as such. Solutions were prepared with MilliQ water.
2.2. Solution preparation
The catanionic mixtures have been prepared as described previously:22 suitable amounts of C13COOH and CTABr are mixed with water at a typical weight fraction of surfactant of 1%
and heated at 50°C ± 0.1°C for 3 days. The resulting mixture is dialyzed against a 100-fold volume of water (SpectraPor regenerated cellulose membranes, 10 kDa cutoff). In a typical preparation, the dialysis water is changed after 1 hour, 4 hours, 24 hours, 48 hours and 5 days. The effective composition of the mixtures is controlled by the initial composition and the time of dialysis.22 The compositions of the various samples investigated here and their conditions of preparation are summarized in table 1.
2.3. Foam production
Foam samples were prepared by vigorous hand shaking. We produced foams in cylindrical plastic containers (27 mm internal diameter, 120 mm height) filled with 20 mL of surfactant solution at the bulk concentration c = 1 gL-1.
2.3. Tensiometry
We measured the surface tension by using the Wilhelmy plate method and the pendant drop/rising bubble tensiometer apparatus (Teclis, France). In the first method, the air-water
interface is created in a home-made Teflon circular trough (diameter = 8 cm, depth = 3 cm) and the surface tension is monitored up to a time t = 105 s by a pressure transducer (Nima, UK); always reaches a constant value at long times, called e afterwards.In the pendant
drop/rising bubble method, the surface tension is calculated by image analysis from the shape of the drop or bubble using the Laplace equation.23 Usually, we monitored the change of surface tension during adsorption up to a time t = 104 s. Above the latter time, liquid evaporation and non-Laplacian shape may introduce artefacts in the surface tension evaluation. Initial volumes for bubble and drop changed from 6 to 12 µL and no feedback control for volume or area was selected since it perturbed the adsorption kinetics. As a result, bubbles/drops tend to detach as surface tension drops significantly.
2.4. Ellipsometry
We performed multiple angle of incidence (MAI) measurements24 using an imaging ellipsometer (Nanofilm, Germany) working with green laser light ( = 532 nm). A fixed compensator (= 45°) and 4-zone averaging nulling scheme were adopted. Solutions were prepared in a circular trough (diameter = 8 cm, depth = 3 cm). We waited from one to four hours (after preparation) before measuring the ellipsometric angles Ψ and Δ (around the Brewster angle B = 53.1° for the air-water interface).24 Measured ellipsometric angles and
at a given incident angle are related to the ratio of the Fresnel reflection coefficients r in p
and s polarization by rp/rs = tan exp(i. Ψ and Δ were measured from = 52° to 54.5° in
steps of 0.1°. The data were fitted with a single homogeneous layer model, characterized by a refractive index nl and a thickness d, between the air (nAir = 1) and water (nH2O = 1.333) bulk
phases (see Supporting Information).
2.5. Multiple light scattering
In order to study the foam evolution we measured the multiply scattered light intensity Is
during foam aging. This technique is also known as diffusing wave spectroscopy (DWS).25, 26 In this study we adopted an optical scheme detecting the multiply scattered light in transmission. The source of radiation was a laser (Coherent, Compass 315M-100) working at = 533 nm. The foam cell was a plastic cylinder of 120 mm height and with an internal diameter of 27 mm. The diffused transmitted light was collected by an optical fibre (Oz
Optics) equipped with a focus lens designed to collect a spot size of the same order than the laser speckle. A photomultiplier (Hamamatsu) and a correlator (Correlator.com, Flex2k-12x2) were used together with the software Flex2k. In order to follow the foam evolution in time (usually up to 105 s), we performed 10 measurements of duration = 10 s, followed by 10 measurements of 120 s and measurements of 7200 s until the foam bubbles became too large for the validity conditions of the method to be fulfilled.
From the static intensity, we could gain information on the bubble size evolution. In fact, the intensity Is is proportional to l*/L,25 where l* is the mean free path of light photons and L is
the thickness of the foam sample; l* depends on the mean bubble radius R in the foam and on the foam liquid fraction , i.e. Is ~ R/
Results presented in this article were obtained within 10 days after solution preparation. The experiments were conducted at room temperature, being 20 ± 2 ºC.
3. Results and Discussion
3.1 Brief summary of the known behaviour of the studied systems
The co-solubilisation of myristic acid (C13COOH) and cetyltrimethyl ammonium bromide
(CTABr) at 50°C, and the subsequent dialysis have been studied recently by Michina et al.22 and Kopetzki et al..18 Upon association, both amphiphilic molecules form gel phase (solid-like) mixed bilayers of CTA+, C13COOH and C13COO- and release their counter-ions H+ and
Br- ions.15, 19 The initial composition and the time of dialysis td determine their effective
composition, the nature of the aggregates (possible presence of mixed micelles in addition to the bilayers), their morphology and their properties. If we define the molar fraction of myristic acid f as:
C COOH
CTABr
COOH C f 13 13 ,then the general behaviour of these mixtures is summarized as follows:
(i) Upon dialysis, f increases (CTA+ is extracted from the mixture) until a value of f ≈ 0.66 is reached (in typically 25 days). No CTA+ extraction occurs in mixtures prepared at an initial fraction f0 = 0.66 and above.
(ii) Mixtures prepared at an initial fraction f0 < 0.66 form ill-defined aggregates of bilayers.
Mixtures prepared at f0 = 0.66 form elongated vesicles prior to dialysis, which swell to
spherical vesicles upon dialysis
(iii) Upon dialysis, H+Br- ions released upon association of both amphiphilic molecules are extracted. The extraction remains incomplete if vesicles are present, as 30% of the ions remain encapsulated
(iv) The bilayers coexist with CTA+ ions with concentrations in the 10-4 – 10-2 mol·L-1 range, depending on composition, present either under the form of free ions or micelles. Upon dialysis, the amount of such free CTA+ decreases and reaches the minimal value of 10-4 mol·L-1 as f reaches the maximal value of f = 0.66.
The final pH is 6.5 (MilliQ water) and shows no noticeable dependency on composition. The effective compositions of the sample investigated here and their conditions of preparations are summarized in table 1 using estimated values from ref. 22.
f0 dialysis f [Br-]/[CTA+] [CTA+] outside
bilayers 0.33 NO 0.33 1 > 10 mM 0.55 NO 0.55 1 > 0.5 mM 0.66 NO 0.66 1 > 0.1 mM 0.33 48 hours 0.58 <0.05 0.4 mM 0.55 48 hours 0.62 <0.05 2.5 mM 0.66 48 hours 0.66 0.30 0.1 mM
Table 1. Initial and final values of f, dialysis time, final values of [Br-]/[CTA+] and concentration of [CTA+] outside the bilayers as estimated by Michina et al.[ref]
Once the dialysis is stopped, the samples show little evolution, except the CTA-rich samples (f < 0.5) that tend to phase separate.
We emphasize two characteristics of this system that are particularly relevant to the work presented afterwards : first, the bilayers are in the gel phase, i.e. are solid-like bilayers with slow lateral diffusion and exchange with the outer solution. In addition, these bilayers are in
coexistence with small concentrations of “free” CTA+
, present either under the form of monomers, or micelles in non-dialyzed samples at f0 = 0.33. It was shown that the
concentration of free CTA+ decreases upon dialysis (table 1). This was assigned to an increase in the cohesive energy of the bilayers as the composition approaches the optimum ratio of f = 0.66. The concentration of myristic acid outside the bilayers was below the detection limit (< 10-5 M). Upon dilution, these concentrations slowly equilibrate again with timescales far above the experimental times investigated here (weeks). We therefore consider that dilution will decrease equally the total bulk concentration and the concentration of free surfactants in solution.
3.2. Equilibrium surface tension and interfacial profile
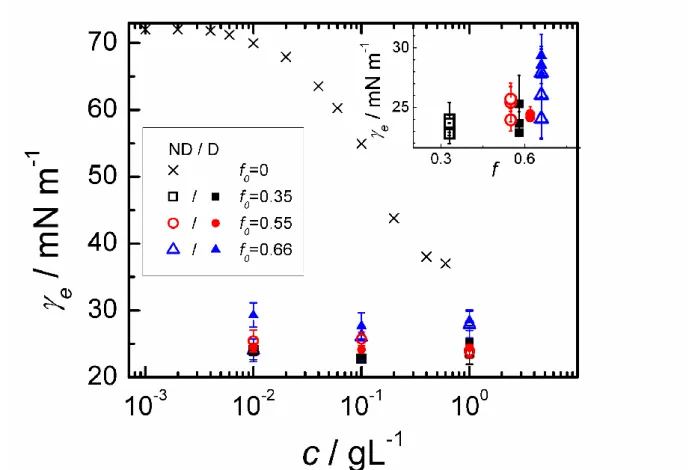
Fig. 1 presents the equilibrium surface tension e as determined by the Wilhelmy plate
method for CTABr (f = 0) and for the six surfactant mixtures. For CTABr, at c = 0.01 gL-1e
begins to deviate significantly from the air-water value ( = ca 72 mN m-1) and saturates
around 35 mN m-1, at the solubility limit, in good agreement with the literature data.28 Using the Gibbs equation before saturation, we determine the surface concentration in CTABr as a function of the bulk concentration cCTABr (see solid line in Fig. 2):
) (ln 2 1 ) ( CTABr e CTABr c RT c , (1)
where R is the ideal gas constant is and T is the absolute temperature. This yields values of that increase with the bulk concentration up to about 1 mg/m² (corresponding to a surface area of 62 Ų per molecule), which is well above the mean surface per molecule in the C13COOH/CTABr bilayers (around 20 Ų at f > 0.50).15, 18, 22
Contrary to CTABr, no significant differences in e were observed for catanionic
mixtures as the bulk concentration was changed. Typically, e 25 mN m-1 was found,
significantly lower than for CTABr even at the highest concentration studied and comparable to the surface tension of pure myristic acid above the melting point, i.e., 27.9 mN m-1 at 343 K.29 The small surface tension of the mixtures can be assigned to the strong attractive interaction between polar heads which enhances significantly the surface coverage as compared to CTABr alone (as confirmed by the ellipsometry measurements, see below).
Furthermore, it is worth noting (inset of Fig. 1) the small increase of e with increasing f,
independently on the residual amount of bromide ions.
Fig. 2 shows ellipsometric results for catanionic mixtures in the same range of concentrations. We fitted the thickness d of the layer keeping constant the refractive index nl
= 1.45, being close to the refractive index of CTABr and C13COOH (see Supporting
Information). In a first approximation, this analysis allows to evaluate the surface concentration30 = d (nl-nH2O)/(n/c), where n/c (n/c = 0.12 mL g-1) is the refractive
index increment. A clear increase of from ca 0.2 to 0.7 mg m-2 (from ca 277 to 87 Ų) was observed for CTABr between 0.01 and 0.1 gL-1in agreement with the values calculated from Eq. 1 (see solid line in Fig. 2). For catanionic mixtures, the surface concentrations are higher than for CTABr, and remains close to 1 mg m-2. If one assumes that the layer composition is similar to that of the most stable bilayers, i.e. f=0.66, the value of the average area per molecule drops to 45Ų.
3.3. Adsorption and surface relaxation
For non ionic surfactant systems a plateau value in the dynamic surface tension curves ( vs. t) is reached after a complete surfactant adsorption onto the interface. Diffusion-limited adsorption shows the following asymptotic behaviours: for short times t~t1/2, whereas for long times t~t-1/2. By contrast, adsorption limited by a energy barrier can be described by simple exponential function t ~ exp(-t/), where is a characteristic relaxation time.31 When the adsorption barrier is due to electrostatic effects, Bonfillon et al.32 described the adsorption of charged surfactants as a combination of diffusion and adsorption barrier processes. In the first adsorption stage, diffusion brings molecules and charges at the interface creating a repulsive potential, hence depletion and accumulation of surfactant below the interface. However, the latter surfactant can overcome this barrier in a final adsorption stage when the concentration is large enough, leading to t ~ t.32 This process has been modelled later by Diamant et al.33
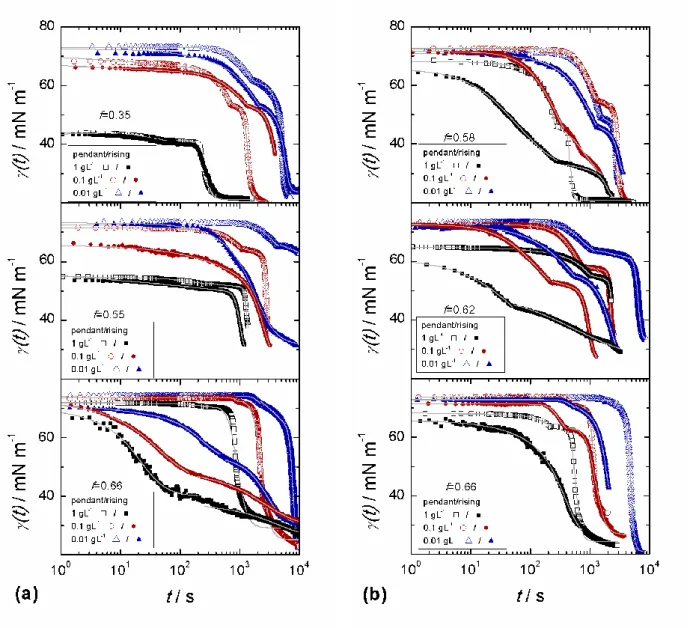
Dynamic surface tension curves for the catanionic mixtures, are shown in Figs. 3a, 3b. Note that for each tcurve, the experimental data correspond to surface tensions evaluated in a region where the Laplace equation could be safely applied, far before bubble/drops
detachment or observation of a non Laplacian shape. The following observations can be made:
i) asymptotic values are in good agreement with the equilibrium surface tensions measured by the Wilhelmy plate method,
ii) two distinct relaxations are usually observed,
iii) significant differences between the pendant drop and rising bubble data are observed, with relaxations for pendant drop experiments slower than for rising bubble ones,
iv) a singularity in the first derivative of tbetween the two relaxations is usually observed,
v) within the same method, the relaxation rates increase with the bulk concentration.
At t = 1 s, values for (t) shown in Fig. 3 could be related to the adsorption of free CTABr. This can be clearly observed for ND catanionic mixtures focusing on c = 1 gL-1 at increasing CTABr content (i.e. decreasing f). For f = 0.66, (t) > 60 mN m-1; for f = 0.55, (t) = ca 55 mN m-1; and for f = 0.35, (t) = ca 43 mN m-1. Indeed, it has been shown before that the gel-phase bilayers are in coexistence with free CTABr molecules and with CTABr-rich micelles when f is small enough. The concentration of free monomers decreases as the effective molar fraction of myristic acid f increases, due to the increase in the interaction with CTABr molecules as f approaches fcritical = 0.66.22 If we assume that the adsorption of the
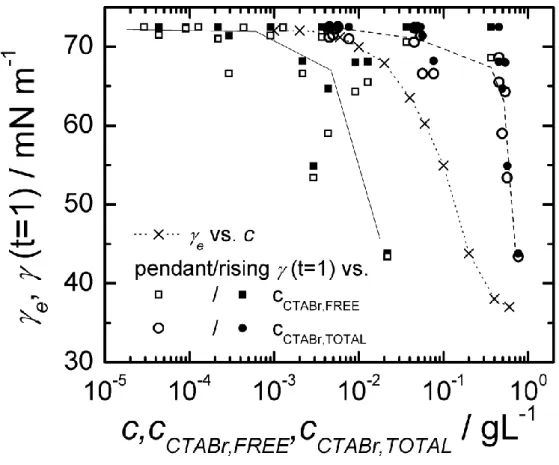
amphiphiles forming the bilayers is much slower than the adsorption from the free molecules and micelles, we can explain why the surface tension at short times is larger for larger f. More quantitatively, the dynamic surface tension at t = 1 s, (t=1) (Fig. 3), can be plotted as a function of the concentration cCTABr,FREE of the surfactants which are not inserted in the
bilayers estimated from the data of Michina et al.22 (Figure 6 in reference 22) or as a function of the concentration cCTABr,TOTAL considering all CTABr molecules in solution and calculated
as: f f Mw CTABr Mw c cCTABrTOTAL 1 ) COOH C ( ) ( 1 / 13 , .
In Fig. 4, we present the comparison between (t=1) (data from Fig. 3) vs cCTABr,FREE and
cCTABr,TOTAL) with the equilibrium surface tension e of pure CTABr solutions (data from Fig.
1). The e curve lies between the two estimated plots. This comparison confirms the
(t). The free CTABr concentration underestimates the amount of surfactant contributing to adsorption at the surface. This means that there is a small but significant extra contribution due to the dissolution of surfactant from the micelles or the less stable vesicles (with f < 0.66).
In turn, for dialyzed catanionic mixtures, when the amount of free CTABr is reduced, (t) remains larger than 60 mN m-1 for 0 < t < 10 s. This is also observed for ND solutions with f = 0.66, which contain the most stable vesicles.
In order to quantify the observations made in the whole time range studied, we fitted (t) curves considering two time intervals (before and after a singular point) using the empirical function introduced recently by Moorkanikkara and Blankschtein:34
m i n i e t t t t 2 1 ) ( ) ( 0 (2)
where n, m are two adimensional parameters and i is a characteristic relaxation time. For
n = m, Eq. 2 correspond to the function introduced by Rosen and Gao to describe (t) curves of ionic surfactants and their mixtures.35 We fitted 5 parameters (e, i, n, m) in each time
interval where a relaxation was observed (see Supporting Information). In most of the cases, two relaxation times 1 and are needed to describe experimental (t) curves shown
in Fig. 3. For f =0 .55, rising bubble experiments could be fitted by one relaxation. Typical values for n and m are in the 0.1-5 range. In Fig. 5 we plotted the characteristic times 1 and
. In the first interval at low concentrations, fitted values are in good agreement with the literature value of pure water (ca 72 mN m-1); and in the second interval, fitted e values are
in good agreement with the experimental values shown in Fig. 1 (ca 25 mN m-1).
Rising bubble and pendant drop experiments clearly differ from each other, especially for the ND samples with f = 0.66. In this case, which changes from ca 2000 to 200 s is almost ten times higher than for rising bubble experiments. These differences are usually due to the depletion of surfactants form the interface in the case of pendant drops, which is enhanced by electrostatic effects.36We will not discuss further these differences and focus afterwards on the rising bubble data.
For non dialyzed catanionic mixtures, 1 decreases by increasing the concentration : ~
c-1/2 (see Fig.5a). This is much slower than for diffusion-limited adsorption, for which the asymptotic behaviour of the surface tension is:31
2 / 1 0 2 4 ) ( t D c RT t e e , (3)
where R is the gas constant, T is the temperature, e is the equilibrium surface concentration
and D0 is the diffusion coefficient. This leads to a characteristic time ~ c-2. However, the
scaling predicted by eq. 3 applies to the concentration of free surfactant, or of surfactant rapidly available (in labile aggregates such as mixed micelles). It is very difficult to estimate the actual CTABr concentration contributing to 1. It lies probably between cCTABr,FREE and
cCTABr,TOTAL as discussed above. Moreover, adsorption is slowed down by the charges present
at the surfaces, which are progressively screened by increasing bulk concentration. Hence the adsorption rate may appear less dependent on the overall bulk concentration than predicted by equation 3.
For dialyzed mixtures, show the scaling ~ c-1/2 just for f = 0.58, 0.62 (see Fig. 5b). For f = 0.66, remain approximately constant as the concentration is changed. This indicates that no free surfactant is available in this case, and therefore suggests that the free surfactant molecules detected at this composition (table 1) are encapsulated in the vesicles and can not reach the interface during this initial step. Consistently, this concentration-independent behaviour is only observed when vesicles are present after dialysis.
For all mixtures does not vary much (remaining around ca 3000 s) when c and f are varied.
The relaxation time could correspond to the time needed to overcome the repulsive interfacial barrier.32 In fact, for f = 0.55, 0.58, 0.62 and 0.66(ND) we found n, m = ca. 1, t
~ t, as observed by Bonfillon et al.32 However, the model leads as for standard diffusion, to a characteristic time ~ c-2. It is again possible that the actual free concentration increases very slowly with the overall concentration as discussed above for 1.
Alternatively, may account for the dissolution time needed to free additional surfactant molecules from bilayers.37Chang et al. model the dynamic adsorption process of surfactants at the air-water interface by:
. ) , ( ) , ( 2 2 0 q x t x c D t t x c
where the term q = k1- k2·c, which is the aggregation dissolution rate, is added to the classical
aggregates. Chang et al. found good agreement with experiments on solutions of other catanionic surfactants, using only k1, i.e. a concentration independent rate of transfer. This
process would account for the limited concentration variation of 2 seen here.
3.4. Foam stability and foamability
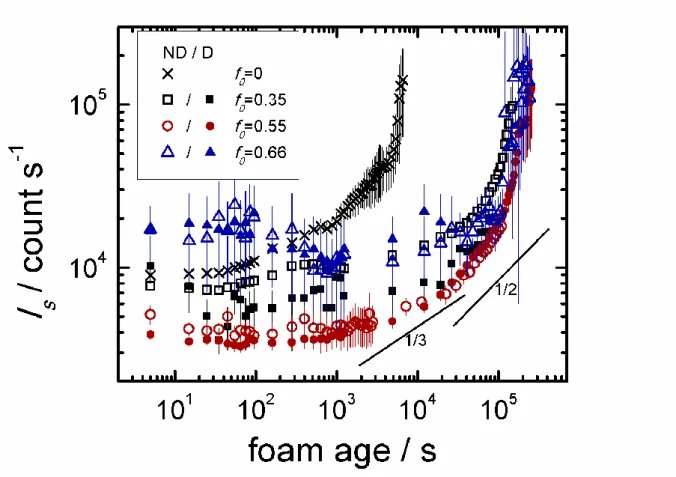
In Fig. 6, we show the average multiple scattered light intensity Is as a function of foam
age. The scattering volume is fixed in space and it lies above the macroscopic interface between the drained liquid and the foam. In the first stages of foam aging, drainage takes place followed by coarsening.27
Is ~ R/ increases monotonically with foam age for CTABr, whereas for the mixtures, a
small decrease can be seen in the first stages of aging. This decrease can be due either to a decrease of the mean bubble size R or to a local increase of the liquid fraction in the scattering volume.
In the first hypothesis, coarsening leads to a decrease of the size of many small bubbles and the increase of size of few large bubbles that in order to expand tend to move upwards. Thus, in the scattering volume an increasing concentration of small bubbles could explain a decrease of Is.
In the second hypothesis, the decrease of Is could be explained by a local increase in the liquid
fraction profile (z) of the scattering volume due to drainage. In fact, two boundaries for the liquid fraction profile can be considered. Just after foam production, we can suppose =
everywhere in the foam independently on the foam height. Whereas, at the equilibrium, (z) =
k (/ R)2 [pg - p0 - g(z-z0)]-2, where k is a geometrical constant, pg is the gas pressure in the
bubble, p0 is the liquid pressure at the top of the foam (z = z0) and g(z-z0) represents the
hydrostatic contribution to the liquid pressure.38 Being 0.36, there will be a significant liquid flow from the top to the bottom of the foam during equilibration; and this net flow, passing through the scattering volume, could generate a local increase of in time affecting Is.
For CTABr, after 102 seconds, drainage is almost completed (see Fig. 7) and Is follows a
scaling exponent of 1/3 typical of wet foam coarsening ( ≈ 0.12). After 103 seconds, the scaling exponent changes to 1/2 as it is expected for dry foam coarsening ( ≈ 0.07).39 After a foam age of 104 seconds, the bubbles are large as it can be seen by the photographic images in Fig. 7 and the validity conditions of the multiple scattering analysis (Is ~ R) are not fulfilled
(R/L > 0.1).27 Hence the fast time variation of R (faster than t1/2) seen in the figure cannot be regarded any more as the true time variation. Note that due to the very limited variation of R, the agreement with the scaling laws at shorter times can only be considered as indicative.
Foams prepared from catanionic mixtures solutions of 1 gL-1 last much longer than CTABr foams, foam collapse starting only after around 105 seconds. Note that when the intensity reaches the value around 105 count s-1, the foam is composed just by a few bubbles that can be stable even for longer time.
For f = 0.35, we observed that the volume of foam produced (= foamability) from non dialyzed solution is as high as for the pure surfactant solutions and much higher than for dialysed solution (see Fig. 7). This difference in foamability is due to the lower concentration of free CTABr in the non dialysed solutions as demonstrated in the previous section. Note also that the foams made with dialysed solutions are wetter (higher and lower Is).
For f0 = 0.55, dialyzed and non dialyzed foams behave similarly and the increase of Is is
monotonic in the last stages of aging, with a trend similar to CTABr foam but shifted towards a longer foam age. For f0 = 0.66, Is shows a minimum around 103 seconds followed by an
increase up to the foam collapse; as discussed before, the minimum is likely due to a local increase of the liquid fraction because of drainage, more important for these foams which are wetter just after production. From photographic images (Figs 7e, 7f), we noted the formation of a dense foam layer: at the top, the foam is similar to the other foams observed in the other cases; at the bottom layer, an accumulation of closely packed spherical bubbles in the liquid phase is observed. This dense foam layer is also present for the dialysed sample with f0 =0.55.
4. Conclusions and Outlook
In conclusion, the dramatic increase of foam stability for catanionic mixtures respect to pure CTABr can be related to the low surface tension and high surface concentration. The tension is low even at very low surfactant concentration and is similar for dialysed and non dialysed samples, ~ 25 mN m-1. The high surface concentration should be accompanied by high elastic and viscous compression moduli as confirmed by preliminary oscillating bubble experiments. The equilibrium surface tension is reached in two steps; the first one is related to the presence of CTABrmolecules, either free, or contained in labile aggregates. The second step is similar for dialysed and non dialysed samples, and may be controlled either by
a repulsive electrostatic barrier or by dissolution of surfactants from bilayers located in the subphase.
Foamability is related to concentration of free surfactants and is higher for non dialysed samples: for solutions with f = 0.35 that contain the largest amount of free CTABr, foamability is comparable to that of pure CTABr solutions. Multiple scattered light intensity
Is increases following the scaling laws predicted for wet and dry foam coarsening for f = 0.35
and f0 = 0.55. For f = 0.66 a minimum is observed at short times and it could be related to a
local increase of the liquid fraction due to drainage, the initial liquid fraction in these foams being very large. The rate of coarsening is similar for dialysed and non dialysed samples and much slower than for pure CTABr foams.
Interfacial rheology studies using oscillating bubble experiments and by an interfacial bicone rheometer are currently in progress, together with a confocal microscopy investigation of the surface of the solutions, which may elucidate the role played by aggregates located in the subphase near the air-water interface.
Supporting information:
In this file, we provide 1) ellipsometric data as a function of the angle of incidence for CTABr and a for a catanionic solution, and 2) all parameters of the fits of dynamic surface tension data. This information is available free of charge via the Internet at http://pubs.acs.org/.
Acknowledgements
We are grateful to Thomas Zemb for discussions on catanionic systems and to Arnaud Saint-Jalmes for sharing his expertise concerning multiple light scattering. Emmanuelle Rio and Wiebke Drenckhan are also gratefully acknowledged for numerous discussions. A.S. has benefited from a post-doctoral Marie Curie fellowship (RTN SOCON).
References
1. Khan, A.; Marques, E., Catanionic Surfactants. In Specialists Surfactants; Robb, I. D.,
Ed. Blackie Academic and Professional, an imprint of Chapman & Hall: London, 1997; p
37-76.
2. Goldsipe, A.; Blankschtein, D., Langmuir 2006, 22, 9894-9904.
3. Kurzendorfer, C.; Schwuger, M.; Lange, H., Berichte Der
Bunsen-Gesellschaft-Physical Chemistry Chemical Physics 1978, 82, 962-969
4. Day, J.; Campbell, R.; Russel, O.; Bain, C., J. Phys. Chem. C 2007, 111, 8757-8774. 5. Gilanyi, T.; Meszaros, R.; Varga, I., Langmuir 2000, 16, 3200-3205.
6. Estoe, J.; Dalton, J.; Rogueda, P.; Sharpe, D.; Dong, J.; Webster, J., Langmuir 1996, 12, 2706-2711.
7. Goldsipe, A.; Blankschtein, D., Langmuir 2007, 23, 5942-5952. 8. Marques, E., Langmuir 2000, 16, 4798-4807.
9. Marques, E.; Brito, R.; Silva, S.; Rodriguez-Borges, J.; do Vale, M.; Gomes, P.; Araujo, M.; Soderman, O., Langmuir 2008, 24, 11009-11017.
10. Kaler, E. W.; Murthy, A. K.; Rodriguez, B. E.; Zasadzinski, J. A. N., Science 1989, 245, (4924), 1371-1374.
11. Jung, H.; Coldren, B.; Zasadzinski, J.; Iampietro, D.; Kaler, E., PNAS 2001, 98, 1353-1357.
12. Brasher, L.; Herrington, K.; Kaler, E., Langmuir 1995, 11, 4267-4277.
13. Danoff, E.; Wang, X.; Tung, S.; Sinkov, N.; Kemme, A.; Raghavan, S.; English, D.,
Langmuir 2007, 23, 8965-8971.
14. Zemb, T.; Dubois, M.; Deme, B.; Gulik-Krzywicki, T., Science 1999, 283, 816-819. 15. Maurer, E.; Belloni, L.; Zemb, T.; Carriere, D., Langmuir 2007, 23, 6554-6560. 16. Michina, Y.; Carriere, D.; Charpentier, T.; Brito, R.; Marques, E.; Douliez, J.; Zemb, T., J. Phys. Chem. B 2010, (114), 1932-1938.
17. Zemb, T.; Carriere, D.; Glinel, K.; Hartman, M.; Meister, A.; Vautrin, C.; Delrome, N.; Fery, A.; Dubois, M., Colloids and Surf. , A 2007, 303, 37-45.
18. Kopetzki, D.; Michina, Y.; Gustavsson, T.; Carriere, D., Soft Matter 2009, 5, 4212 - 4218.
19. Carriere, D.; Belloni, L.; Deme, B.; Dubois, M.; Vautrin, C.; Meister, A.; Zemb, T.,
Soft Matter 2009, 5, 4983-4990.
20. Delorme, N.; Bardeau, J. F.; Carriere, D.; Dubois, M.; Gourbil, A.; Mohwald, H.; Zemb, T.; Fery, A., J. Phys. Chem. B 2007, 111, (10), 2503-2505.
21. Schelero, N.; Lichtenfeld, H.; Zastrow, H.; Mohwald, H.; Dubois, M.; Zemb, T.,
Colloids and Surf. , A 2009, 337, 146-153.
22. Michina, Y.; Carriere, D.; Mariet, C.; Moskura, M.; Berthault, P.; Belloni, L.; Zemb, Z., Langmuir 2009, 25, 698-706.
23. Benjamins, J.; Cagna, A.; Lucassen-Reynders, E. H., Colloids and Surf. , A 1996, 114, 245.
24. Azzam, R.; Bazhara, N., Ellipsometry and polarized light. Elsevier: Amsterdam, 1977. 25. Vera, M.; Durian, D., Phys. Rev. E 1996, 53, 3215-3224.
26. Pine, D.; Weitz, D.; Chaikin, P.; Herbolzheimer, E., Phys. Rev. Lett. 1998, 60, 1134-1137.
27. Saint-Jalmes, A., Soft Matter 2006, 2, 836-849.
29. Wohlfarth, C., Surface Tension of Pure Liquids and Binary Liquid Mixtures
(Supplement to IV/16) of Landolt-Börnstein Group IV Physical Chemistry. Springer: Berlin
Heidelberg, 2008; Vol. 24, p 244.
30. DeFeijter, J. A.; Benjamins, J.; Veer, F. A., Biopolymers 1978, 17, 1759.
31. Kralchevsky, P.; Danov, K.; Denkov, N., Handbook of Surface and Colloid Chemistry
(Third Edition) Edited by Birdi KS, Chapter 7. CRC Press: NW, USA, 2009.
32. Bonfillon, A.; Sicoli, F.; Langevin, D., J. Colloid Interface Sci. 1994, 168, 497-504. 33. Diamant, H.; Ariel, G.; Andelman, D., Colloids and Surfaces a-Physicochemical and
Engineering Aspects 2001, 183–185, 259–276.
34. Moorkanikkara, S.; Blankschtein, D., Langmuir 2009, 25, 6191-6202. 35. Rosen, M.; Gao, T., J. Colloid Interface Sci. 1995, 173, 42-48.
36. Yang, C. D.; Gu, Y., Langmuir 2004, 20, 2503-2511.
37. Chang, H.; Tsen, C.; Chang, C., Colloid Polym. Sci. 2006, 285, 57-63. 38. Weaire, D.; Hutzler, S., The Physics of Foams. OUP Oxford, UK, 2001. 39. Durian, D.; Weitz, D.; Pine, D., Phys. Rev. A 1991, 44, 7902-7905.
Figures
Fig. 1 Equilibrium surface tension e, measured by Wilhelmy plate method, of pure
CTABr (f 0= 0), non dialyzed ND and dialyzed D catanionic mixtures as a
Fig. 2 Thickness d and surface concentration evaluated from ellipsometric fits for a single homogeneous interfacial layer as a function of bulk concentration for pure CTABr (f0 = 0) and for non dialyzed ND and dialyzed D catanionic
mixtures. The solid line represents the (cCTABr) curve calculated from Fig.1
Fig. 3 Dynamic surface tension curves for non dialyzed (a) and dialyzed (b) catanionic mixtures. Solid lines are fits of the data using Eq. 2.
Fig. 4 Equilibrium surface tension e (dotted line) as in Fig.1 and surface tension
(t=1) extracted from Fig. 3 as a function of the free CTABr surfactant (solid line) and total CTABr surfactant (dashed line) concentration. Lines are guides to the eye.
Fig. 5 Relaxation times from the fits of (t) shown in Fig. 3 using Eq. 2 for non dialyzed (a) and dialyzed (b) catanionic mixtures. Lines are guides to the eye.
Fig. 6 Multiply scattered light intensity Is as a function of foam age. Foams were
made from non dialyzed (ND) and dialyzed (D) catanionic mixtures at the bulk concentration c = 1 g L-1. f0 = 0 corresponds to pure CTABr.
Fig. 7 Photographic images taken at foam age = 102 s (a,d), 103 s (b,e), 104 s (c,f). Foams were made from non dialyzed (a,b,c) and dialyzed (d,e,f) catanionic mixtures at the bulk concentration c = 1 g L-1. f0 = 0 corresponds to pure
![Table 1. Initial and final values of f, dialysis time, final values of [Br - ]/[CTA + ] and concentration of [CTA + ] outside the bilayers as estimated by Michina et al.[ref]](https://thumb-eu.123doks.com/thumbv2/123doknet/13051685.383093/7.892.105.780.582.900/table-initial-dialysis-concentration-outside-bilayers-estimated-michina.webp)