HAL Id: hal-00419904
https://hal.archives-ouvertes.fr/hal-00419904
Preprint submitted on 25 Sep 2009
HAL is a multi-disciplinary open access
archive for the deposit and dissemination of sci-entific research documents, whether they are pub-lished or not. The documents may come from teaching and research institutions in France or abroad, or from public or private research centers.
L’archive ouverte pluridisciplinaire HAL, est destinée au dépôt et à la diffusion de documents scientifiques de niveau recherche, publiés ou non, émanant des établissements d’enseignement et de recherche français ou étrangers, des laboratoires publics ou privés.
Biophysical modeling of NO emissions from agricultural
soils for use in regional chemistry-transport models
Marie-Noëlle Rolland, Benoit Gabrielle, Patricia Laville, Pierre Cellier,
Matthias Beekmann, Jean-Marc Gilliot, Joël Michelin, Dalila Hadjar, Gabriele
Curci
To cite this version:
Marie-Noëlle Rolland, Benoit Gabrielle, Patricia Laville, Pierre Cellier, Matthias Beekmann, et al.. Biophysical modeling of NO emissions from agricultural soils for use in regional chemistry-transport models. 2009. �hal-00419904�
Biophysical modeling of NO emissions from
agricultural soils for use in regional
chemistry-transport models
M.-N. Rolland
a,1, B. Gabrielle
a,∗, P. Laville
a, P. Cellier
a,
M. Beekmann
b, J.-M. Gilliot
a, J. Michelin
a, D. Hadjar
aand G. Curci
ca: INRA, AgroParisTech, UMR 1091 Environnement et Grandes Cultures,
F-78850 Grignon, France.
b: Laboratoire Inter-universitaire des Systèmes Atmosphériques
- CNRS, Universités Paris-Est and Paris 7, F-94 010 Créteil, France.
c: Dipartimento di Fisica - CETEMPS, Universita’ degli Studi dell’Aquila,
67010 Coppito - L’Aquila (Italy).
* Corresponding author:
Benoît GABRIELLE
INRA, AgroParisTech UMR1091 Environnement et Grandes Cultures, Route
de Thiverval BP 01, 78850 Thiverval-Grignon, France.
E-mail: Benoit.Gabrielle@agroparistech.fr
Phone: (+33) 1 30 81 55 51
Fax: (+33) 1 30 81 55 63
Abstract
1
Arable soils are a significant source of nitric oxide (NO), a precursor of tropospheric ozone,
2
and thereby contribute to ozone pollution. However, their actual impact on ozone formation is
3
strongly related to their spatial and temporal emission patterns, which warrant high-resolution
4
estimates.
5
Here, we combined an agro-ecosystem model and a series of geo-referenced databases to map
6
these sources over the 12 000 km2 administrative region surrounding Paris, France. The
mod-7
eled NO emission rates from agricultural soils ranged from 1.5 kg N-NO ha−1to 11.1 kg N-NO
8
ha−1for the 14-month simulation period, and averaged 5.1 kg N-NO ha−1. This corresponded
9
to a mean emission factor of 1.7% for fertilizer-derived NO emissions. These emissions were
10
characterized by a strong seasonal variability, being highest in May due to the fertilization of
11
spring crops and lowest in wintertime. Their simulation was strongly sensitive to soil type and
12
crop management practices, along with the resolution of the climate and soil input maps.
13
14
The use of an agro-ecosystem model at regional scale makes it possible to map the emissions
15
of nitric oxide from arable soils at a resolution compatible with tropospheric ozone models.
1
Introduction
1
Although agricultural soils have been recognized as a significant source of nitric oxide (NO),
2
their contribution is still uncertain, ranging from 10% to 23% of the global NOxbudget
(David-3
son and Kingerlee, 1997; Delmas et al., 1997). In Europe, they account for an estimated 15% of
4
NO (Simpson et al., 1999). In addition, agricultural soils may play a significant role in the
tropo-5
spheric chemistry of ozone (O3) in rural areas, where NOxemissions from combustion reactions
6
are relatively small. This also holds in the vicinity of urban areas, where arable soils are tightly
7
intertwined with other sources of ozone precursors (such as road traffic, forests, or residential
8
and industrial areas). Photochemical processes are highly dependent on the spatial and temporal
9
patterns of natural and anthropogenic sources of ozone precursors, and their simulation warrants
10
high-resolution estimates of these sources in both space and time.
11
In arable soils, NO is produced through the microbial processes of nitrification and
denitrifica-12
tion. Nitrification is an oxidation of NH+4 to NO−2 and NO−3, which requires the availability of
13
molecular oxygen, while denitrification is an anaerobic reduction of NO−
3 to gaseous forms of N
14
(N2O and N2). The nitrification pathway predominates in temperate zones (Laville et al., 2005),
15
accounting for 60% to 90% of total NO emissions (Godde and Conrad, 2000), and is regulated by
16
environmental and agronomic factors, including cropping practices, soil characteristics and
cli-17
mate. Crop management influences the dynamics of soil ammonium content, which is a substrate
18
for nitrification, while the latter influence soil temperature and water-filled pore space (WFPS),
19
which is a proximate for soil oxygen concentration and a driver for gaseous diffusivity (Linn and
20
Doran, 1984).
21
Given the complexity of the microbial processes driving the exchanges of reactive N (Nr)
be-22
tween soils and the atmosphere, estimates of biogenic sources remain highly uncertain at
re-23
gional to global scales. National inventories of Nr sources from ecosystems currently mostly
24
rely on sets of emission factors derived from field-scale experiments, assuming Nr emissions to
be a fixed fraction of Nr inputs or dependent solely on soil temperature. Such is the case for the
1
widely-used EMEP/CORINAIR methodology (Skiba et al., 2001; Stohl et al., 1996).
2
3
In recent years, biophysical ecosystem models have been used to develop more realistic,
spatially-4
explicit inventories of gaseous Nr emissions from soils, based on specific geographical
informa-5
tion systems (GIS) and databases (Butterbach-Bahl et al., 2001, 2004, 2009; Li et al., 2004;
6
Gabrielle et al., 2006b). Such models make it possible to simulate the temporal and spatial
7
dynamics of emissions, typically on a daily basis. Geo-referenced databases are used to
local-8
ize the sources of Nr emissions, as well as to map model inputs, including soil characteristics,
9
land-use and management, and weather data. They are used in a wide range of scientific fields,
10
including climatology and climate change studies, agriculture, forestry and ecology (Chapman
11
and Thornes, 2003). For instance, the DNDC and PnET-N-DNDC models were used to develop
12
regional inventories NO and N2O emissions from cropland and forests in various parts of the
13
world (Butterbach-Bahl et al., 2001; Li et al., 2004; Butterbach-Bahl et al., 2004; Kiese et al.,
14
2004). Similarly, a rice crop model was coupled with GIS databases to simulate the emissions
15
of methane from rice paddocks in Asia (Matthews et al., 2000). In these studies, the spatial
16
generalization at the regional scale was based on plot-scale simulations at the nodes of a regular
17
grid involving particular sets of crop management, soil, and climate data. Spatial interpolation
18
of the grid points to cover the entire domain was either not considered (implying the points were
19
representative of the whole grid cell), or done using kriging techniques. The density of the grid
20
points (with a grid resolution of 4 to 20 km) was generally too low to adequately capture the
21
short-range variations in agricultural field properties, which are in the 0.1-1 km range.
22
23
An alternative approach consists of using over vectorial contours, delineated by the geographical
24
borders of soil and land-use classes, as well as administrative zones.This makes it possible to
25
encompass the range of soils, land-uses and climates occurring over the entire geographical zone
considered, and not only their particular realizations at the nodes of a regular grid. Such was
1
the basis of the N2O inventory developed by Gabrielle et al. (2006b) for wheat-cropped soils in
2
northern France, which resulted in principle in a more accurate localization of emission sources
3
compared to grid-point simulations. The spatial distribution of meteorological data, which are
4
input to biophysical models, is also an issue given their short-range variability. They are mostly
5
taken from ground-based stations (Monestiez et al., 2001), and less frequently from global or
6
meso-scale meteorological models (Bardossy and Plate, 1992). The latter allow a higher
resolu-7
tion in time and space, typically down to the hourly and 6 km scale, and provide a more regular
8
rendering of weather patterns over a given area (Faivre et al., 2004).
9
10
Achieving a vectorial, high-resolution inventory for NO emissions from arable soils is paramount
11
to understanding and predicting their effects on tropospheric chemistry, especially in urbanized
12
areas where the sources of precursors are tightly intertwined. This is clearly not the case in
cur-13
rent chemistry-transport models (CTM), which rely on fixed, biome-specific emission factors,
14
such as the Stohl et al. (1996) algorithm in the CHIMERE model (Schmidt et al., 2001), or on
15
simplified, algorithms with regional parameterizations (Rolland, 2008). These models may thus
16
benefit from the recent progresses in the prediction of NO inventories by ecosystem models.
17
However, none of the earlier above-mentioned studies in that direction had a spatial resolution
18
compatible with the short-range variations of arable soils and crop management.
19
20
Here, we intended to set up a high-resolution inventory of NO emissions from agricultural soils
21
with the environmentally-oriented crop model CERES-EGC (Gabrielle et al., 2006a,b), coupled
22
with a set of regional GIS databases. The domain area was the Ile de France administrative region
23
(12 072 km2
), surrounding Paris, in northern France, which faces significant tropospheric ozone
24
pollution (Deguillaume et al, 2008). Our main objective was thus to improve the prediction of
25
photochemical ozone formation in chemistry-transport models (CTM) via a finer estimation of
agricultural sources. Sensitivity tests were also carried out to determine the influence of climate
1
variability, soil properties, and crop management on NO emissions.
2
2
Material and methods
3
2.1
The CERES-EGC model
4
CERES-EGC was adapted from the CERES family of soil-crop models (Jones and Kiniry, 1986),
5
with a focus on the simulation of environmental outputs such as nitrate leaching and gaseous
6
emissions of ammonia and nitrogen oxides (Gabrielle et al., 2006a). CERES-EGC contains
sub-7
models for the major processes governing cycles of water, carbon and nitrogen in soil-crop
mod-8
els. A physical module simulates the transfer of heat, water and nitrates down the soil profile
9
as well as soil evaporation, plant water uptake, and transpiration in relation to climatic
condi-10
tions. A microbiological module simulates the turnover of organic matter in the plough layer,
11
involving both mineralization and immobilization of mineral N (denitrification and nitrification).
12
CERES-EGC includes a submodel that simulates the production of NO through the nitrification
13
pathway (Rolland et al., 2008). Nitrification is modeled as a Michaëlis-Menten reaction, with
14
NH+4 as substrate, as modulated by soil water content and temperature. The fraction of
nitri-15
fied ammonium evolved as NO is considered fixed for a given crop type (Laville et al., 2005).
16
CERES-EGC runs on a daily time step, and requires daily rain, mean air temperature and Penman
17
potential evapo-transpiration as forcing variables.
18
2.2
Regional simulations
19
2.2.1 Geographical database
20
We simulated NO emissions from agriculture over the Ile de France region (12072 km2
), ie an
21
approximately 150 km × 150 km square area surrounding Paris, France. The region is
character-22
ized by a variety of land-uses, among which the share of agricultural and forest soils is 55% and
23
23%, respectively. A GIS database was constructed with available geo-referenced data on the
region, including administrative borders, localization of emission sources (arable lands),
man-1
agement for the major crops in the Ile de France region, soils and climate. The various layers of
2
spatial information (mostly in vector format) were super-imposed to delineate elementary spatial
3
units representing unique combinations of soil types, weather pattern, and agricultural
manage-4
ment. These units were subsequently used in the CERES-EGC simulations at the field-scale, in
5
a bottom-up approach to map the emissions.
6
2.2.2 Land-use and crop management
7
Geographical information concerning land-use in Ile de France were taken from the Corine Land
8
Cover database (thereafter referred to as CLC2000 - UE-Ifen CLC (2000)), which includes 44
9
classes, with a 150 m positioning accuracy and a minimum mapping unit of 25 ha. It thus
10
allowed a precise localization of arable fields. Agricultural statistics on the area of arable crops
11
on a county (’canton’) basis were taken from the statistics and survey bureau of the French
12
Ministry of Agriculture (SCEES), as obtained from a comprehensive census carried out from
13
October 2000 to March 2001. Informations of agricultural cropping practices were available at
14
the regional scale, from a detailed survey (Agreste/SCEES, 2001), including statistics on sowing
15
dates, the dates, forms and rates of fertilizer applications, and crop yields.
16
The agricultural statistics showed that six crop types and fallow soils accounted for 91.5% of the
17
total area of arable land (573 590 ha) in the Ile de France region in 2001. Table 1 summarizes their
18
management, as taken from the above-mentioned surveys. Winter wheat crop was the dominant
19
crop with 44.8% of the total area.
20
2.2.3 Soils
21
Soils were parameterized based on a 1:250 000 scale map and attached thematic database (Fig.
22
1). The map is organized into geographical soil map units (SMU), containing a mixture of soil
23
typological units (STU), following the model of the soil map of the European Union (King et al.,
24
1994). In order to reduce the number of soil units to be parameterized, we first selected the
dominant ones in Ile de France, as determined from their percentage of land-cover on a county
1
basis. Secondly, we grouped STUs according to their drainage class, geological substrate, and
2
their texture class. These characteristics were considered particularly influential in the prediction
3
of NO emissions, as evidenced by the sensitivity analysis. We ultimately obtained 14 groups of
4
soils, as listed on Table 2 and mapped out on Fig. 1. They were parameterized based on previous
5
tests against field experimental data with CERES-EGC, involving similar soil classes in Europe
6
(Table 2). When such prior information was unavailable, the CERES-EGC soil input file was
7
created from the information listed in the soil database, using pedo-transfer functions and expert
8
knowledge (Gabrielle et al., 2002).
9
2.2.4 Climate
10
CERES-EGC was supplied with gridded weather data generated by the meso-scale model MM5
11
(Dudhia, 1993), with an horizontal resolution of 5 km.Each CERES-EGC elementary spatial
12
simulation unit was associated with the closest MM5 grid point for weather data. Potential
13
evapo-transpiration (PET) was calculated from the MM5 data using the Penman relationship
14
(Penman, 1948).
15
16
CERES-EGC was run from 1 November 2000 to 31 December 2001 for each elementary spatial
17
simulation unit representing a given set of soil type, climate and crop management (Fig. 1). This
18
period encompassed the growing cycles of both winter and spring crops, and the interval between
19
harvest and sowing of the following crops.
20
2.3
Sensitivity analysis
21
As the data used in the GIS database were simplified or aggregated compared to their original
for-22
mat, some uncertainty is likely to have been produced during the upscaling process
(Butterbach-23
Bahl et al., 2004; Li et al., 2004). We addressed it by examining the sensitivity of the simulated
24
NO efflux to soil, meteorological, and crop management inputs.
Sensitivity tests were first run at the plot-scale, using a complete experimental design to
simulta-1
neously vary crop type, fertilizer N rate, soil type, soil microbiological parameters, and weather
2
data. The crop and soil types corresponded to those occurring in Ile de France (Table 2), while
3
two climatic locations were tested: Grignon (west of Ile de France) and Auradé (Southwestern
4
France). Two values for the microbiological parameter Vmax (maximum nitrification rate) were
5
taken from a previous modeling study on NO emissions (Rolland et al., 2008). They were varied
6
independently of soil type since they had a strong influence on predicted NO emissions and little
7
relation to soil pedological class (Cortinovis, 2004). The sensitivity of the yearly NO efflux to
8
the above factors was assessed using boxplots, which provide a graphical representation of the
9
distribution of model outputs, and variance analysis. The latter breaks down the total variance of
10
model outputs into fractions attributable to individual factors and their interactions, based on the
11
statistical theory of linear models (Monod et al., 2006).
12
At the regional-scale, the sensitivity of NO emissions to the resolution of input data was also
13
investigated by comparing emission maps obtained for a short period of April 2001 with: i/
14
spatially-distributed meteorological and soil data, ii/ uniform weather data (from the Grignon
15
meteorological station) and soil map, and iii/ distributed meteorological data and uniform soil
16
(Neoluvisol; Table 2). Lastly, the response of year-round NO emissions to N fertilizer rates was
17
also investigated by varying the latter from 0 to 200 kg N ha−1 in 50 kg N ha−1 increments,
18
encompassing the range of rates applied in Ile de France.
19
3
Results
203.1
Sensitivity analysis
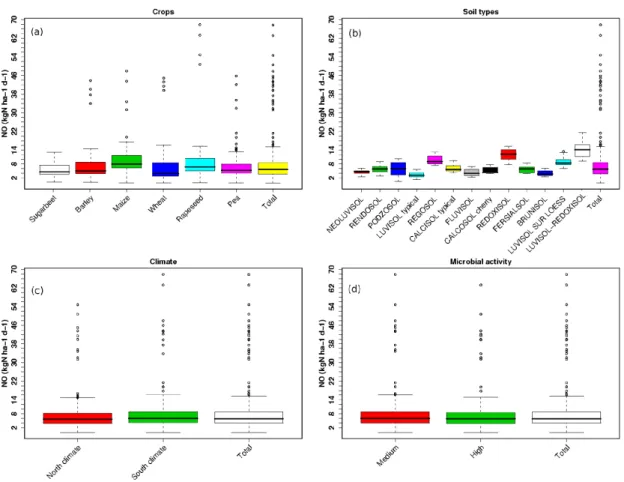
21 3.1.1 Plot-scale tests 22The simulated NO emissions were sensitive, by increasing order: to soil type, crop type
(includ-23
ing fertilizer N rates), climate and soil microbiological parameters. The marginal distributions
24
of NO emissions with fixed climate or crop type were relatively homogeneous, and resembled
the overall distribution of this variable (see boxplots of Fig. 2 a-c). Conversely, the marginal
1
distributions related to soil types were more dissimilar and differed from the overall distribution,
2
evidencing a strong influence of this factor on NO emissions (Fig. 2 b). In particular, emission
3
rates were markedly higher with the Luvisols, which tended to have higher water contents than
4
sandy Podzosols. The analysis of variance allowed us to quantify the weights of the main factors
5
and their interactions (Monod et al., 2006), and its results are presented in Table 5. The
sensi-6
tivity indices of the main factors explained 82.5% of the total variance of NO emissions, while
7
first-order interactions between factors accounted for 17.4% of it (the residual variance was thus
8
negligible). Soils were by far the most influential factors, and its interactions with crops was the
9
most significant term. Crop type explained 4% of total variance, and the other factors appeared
10
negligible since they only explained 1% of the variance.
11
3.1.2 Regional scale
12
Regarding the sensitivity of NO fluxes to fertilizer N rates, there was a notable difference between
13
winter and spring crops, the latter releasing more NO due to higher soil temperatures during their
14
growth period and to the fact that they were fertilized at sowing, some weeks before crop demand
15
for N became significant. The response of NO emissions to fertilizer rates was remarkably well
16
fitted by a linear regression (with R2
values above 0.99), whose slopes (the emission factors)
17
were higher for the maize crop (2.6%) than for the wheat (1.9%). For both types of crops, the
18
background NO emissions were around 2.6 kg N ha−1over the 14 month simulation period.
19
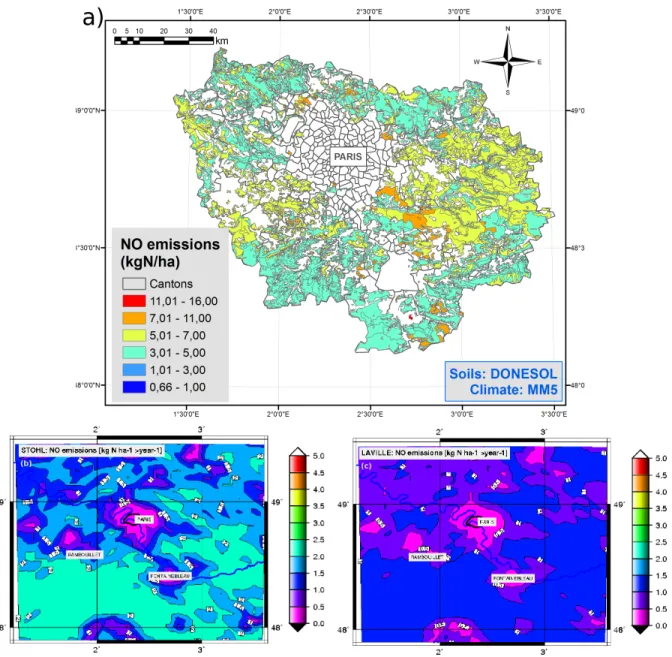
The regional distribution of soils appeared as a major driver in the spatial patterns of NO fluxes
20
(Figures 3 a-c). Two zones to the East and to the South-West of Paris were characterized by
21
high NO emission rates, due to their higher proportion of arable crops and the predominance
22
of Luvisols, which are prone to emit NO, as mentioned earlier (Fig. 1). In the simulation with
23
uniform soil type (Neoluvisol) across the region, the spatial distribution of NO emissions was
24
nearly homogeneous, implying that climate variability only exerted a marginal effect on NO
emissions.
1
3.2
Drivers of NO emissions in Ile de France
2
In the CERES-EGC model, NO emissions are driven by the 3 environmental variables: soil
3
temperature, soil moisture and ammonium contents (Laville et al., 2005), whose regional
distri-4
butions are depicted on Fig. 4. Soil moisture content was markedly heterogeneous across the
5
region, as a result of the heterogeneity in soil types and rainfall. The Podzosols, with sandy
6
texture, presented the lowest levels of soil moisture, appearing as red and orange spots to the
7
South-East of Paris on Fig. 4a. Intermediate levels of soil moisture were simulated for the
vari-8
ous types of Luvisols around Paris, with a drier fringe along the southwestern limit. In these soils
9
the average moisture content was close to the optimum for nitrification and thus NO production.
10
Neoluvisols had the highest moisture contents, ranging from 28 to 35 % (v/v). Spring crops
11
generally resulted in drier soil conditions than winter crops, with a relative difference reaching
12
up to 15% over the simulation time period.
13
3.3
Time course of NO emissions
14
Figure 5 a-b compares the dynamics of NO emissions under winter and spring crops, and for
15
5 soil types with contrasted hydrodynamic regimes. Soil and crop types had a clear impact on
16
the emission patterns, as a result of strong differences in some of their environmental drivers
17
(Figure 5 c-i). First, the magnitude of NO emissions under the maize crop was higher than the
18
wheat crop after fertilization due to higher soil temperatures and optimal soil moisture content
19
(corresponding to 60% water-filled pore space - Linn and Doran (1984)). Fertilizer was applied
20
earlier on the wheat crops, at a time when soil moisture was above the optimum for nitrification,
21
which strongly reduced its activity. However, towards the end of the summer, both crops had
22
similar NO emissions, due to the mineralization of soil organic matter and similar soil
environ-23
mental conditions (see Fig. 5). Throughout autumn and winter, mineralization slowly decreased
due to decreasing soil temperature, and NO emissions reached a stable background level of few
1
g N-NO ha−1 d−1. There were further reduced by sub-optimal soil moisture content, the latter
2
being either too low in autumn or too high in winter.
3
The sensitivity to soil types is mostly related to differences in their soil water-filled pore space
4
(WFPS) dynamics (Fig. 5). Typical Luvisols produced higher NO peaks than the hydromorphic
5
soils (hydromorphic Luvisols and Planosols), or than the cherty Calcosols, because they were
6
well-drained and their water balance led to optimal soil moisture content for nitrification upon
7
fertilizer applications in spring. The WFPS of hydromorphic soils tended to remain above the
8
optimum for nitrification, which hampered this process at that time. However, during the rest
9
of the simulation period, the hydromorphic Luvisols emitted more NO than the other Luvisols
10
whatever the crop, due to higher WFPS, and their efflux totaled 8.6 g N-NO ha−1 d−1compared
11
to 6.2 g N-NO ha−1 d−1for the latter.
12
3.4
Spatial distribution of NO emissions over Ile de France
13
Figures 6 and 7 map the NO emissions for the various crops considered, as cumulated over the
14
14-month simulation time-frame. Emissions were larger over spring crops (maize and
surgar-15
beet) than winter crops (wheat, barley and rapeseed), pea-cropped and fallow soils being the
16
weakest emitters due to the absence of mineral fertilizer application. A large heterogeneity in
17
NO emissions may be noted on all maps: the fluxes ranged between 2.8 and 16.5 kg N-NO
18
ha−1 for the spring crops, with a median value of 4.9 kg N-NO ha−1, whereas the range was
19
2.3-10.1 kg N-NO ha−1 for winter crops, with a median of 3.8 kg N-NO ha−1. Lastly, for the
20
crops without fertilizer application values are comprised between 0.66 and 9.3 kg N-NO ha−1,
21
with a median value of 2.8 kg N-NO ha−1. There were consistent emission pattern across the
22
maps, with largest emissions occurring to the East of the domain, and to a lesser proportion in
23
its Southern and the South-Western parts. This pattern was strongly linked with the spatial
24
distribution of soils at a regional scale (Fig. 1). The largest emitters corresponded to Luvisols,
due to their texture and their hydrodynamic characteristics (well-drained), which create topsoil
1
water contents conducive to nitrification.
2
3.5
Comparison with other estimates
3
According to our simulations, NO emissions from agricultural soils averaged 5.1 kg N-NO ha−1
4
between November 2000 and December 2001, and ranged from 1.47 to 11.1 kg N-NO ha−1.
5
Since the mean fertilizer application rate was 150kg N-NO ha−1, we could estimate an
aggre-6
gated emission factor of 1.7% for Ile de France, after subtracting the background flux of 2.6 kg
7
N-NO ha−1. Figure 8 compares our NO emission maps with those currently implemented in
8
the chemistry transport model CHIMERE, based on either the Stohl et al. (1996) NO algorithm
9
or the Laville et al. (2005) model. For the same time period, these models yielded emissions
10
ranging from 0.5 and 2.5 kg N-NO ha−1, and from 0.5 and 1.5 kg N-NO ha−1, respectively. An
11
explanation for these rates being lower than ours may be that background NO emissions (i.e.
12
emissions in the absence of fertilization) are smaller in magnitude with these algorithms. The
13
spatial distribution of cropland sources was more homogeneous with the CHIMERE algorithms
14
than with ours, because the latter are only based on a single landcover class (arable land) which
15
does not take soil type into account (Fig. 8). In our approach, as showed in the previous section,
16
the variability of soil types had a strong effect on NO emissions.
17
18
We compared the regional total of 2761.0 t N-NO simulated by CERES-EGC over the 14-month
19
time-frame with other inventories. The national inventory of atmospheric pollutants in France
20
(CITEPA, 2008) provides an estimate of the contribution of agricultural soils, based on
emis-21
sion factors specific to N-fertilizer forms FAO/IFA (2001), and on the delivery data supplied
22
by the French association of fertilizer manufacturers. The resulting estimate for Ile de France is
23
404.3 t N-NO yr−1, which may be compared to our estimate by adding the background emissions
24
(1328.4 t NO2 yr−1), yielding a total of 1838.2 t N-NO yr−1 it i.e. 33% lower than our estimate
(albeit for a 2-month shorter period). Using an approach similar to ours, Butterbach-Bahl et al.
1
(2004) predicted average NO emission rates of 8.6 kg N-NO ha−1 yr−1 for arable crops in the
2
Saxony region of Germany, which is of similar magnitude as our regional mean. A more recent
3
EU-wide simulation with the same methodology resulted in a much lower range for the Ile de
4
France area, with soil emission rates varying from 1 to 1.5 kg N-NO ha−1yr−1(Butterbach-Bahl
5
et al., 2009), ie 4 times less than our average. This may have been an effect of inter-annual
cli-6
mate variability, since the simulations were run for the year 2000, compared to mostly 2001 in
7
our case, but both years had similar annual rainfall (869 and 765 mm, resp.) and mean air
tem-8
perature (11.4 and 11.1◦C). This gap is more probably due to the DNDC model under-estimating
9
the mean observed NO fluxes by a factor of 4 in the Grignon experimental test site, located in
10
western Ile de France.
11
Lastly, we checked our bottom-up estimate of N fertilizer inputs to arable crops against the total
12
input that may be approximated from the fertilizer delivery data in Ile de France. In 2001, the
13
latter amounted to 70229 t of fertilizer N. In our approach, based on agricultural statistics and
14
field surveys of management practices, the average fertilization rate was about 150 kg ha−1 (see
15
Table 1), and arable crops covered 573590 ha. Thus, the total fertilizer input was estimated at
16
86038 t N, which is within 18% of the UNIFA estimate. This means that the dominant crops we
17
selected in the region enabled us to account for the overall use of fertilizers in agriculture.
18
4
Discussion
19
4.1
Uncertainties in data inputs
20
Land-use or land cover information is usually obtained by remote-sensing satellite imaging,
21
which enables a comprehensive monitoring at high resolution. However, it comes with the
disad-22
vantage that it is only valid for the year considered. Since arable crops are rotated, they change
23
from one year to the other on a given field. To correct for the possible biases associated with the
24
use of such landcover information systems, we compared to area of arable soils in Ile de France
provided by two different sources: the CLC2000 database (UE-Ifen CLC, 2000), which was
1
used as input in our inventory, and French agricultural census data at the county level (RGA).
2
According to the latter, arable soils covered 573590 ha in 2000, whereas the figure was 694423
3
ha for CLC2000. This 21% relative difference occurring between the two land-cover databases
4
introduced significant uncertainties in the magnitude and spatial distribution of the NO sources,
5
along with the cumulative emissions from agriculture at the regional level.
6
4.2
Relevance of emission maps to the photochemical modeling
7
Although biogenic NO emissions may significantly contribute to photochemical processes in
8
rural and urban areas (Stohl et al., 1996), few studies have tested or discussed the possible
in-9
fluence of a finer-scale description for them in the context of atmospheric chemistry modeling.
10
Here, the use of an agro-environmental model made it possible to achieve a more realistic
predic-11
tion of NO emissions as related to its main drivers: soil and crop types, agricultural practices and
12
meteorological conditions. Moreover, the model was able to account for environmental
condi-13
tions year-round, and to simulate background NO emissions, due to the mineralization of organic
14
N inputs, before and after the fertilization period. Since background emissions represent several
15
grams of N-NO ha−1d−1all year long, they make up a significant part of the soils source strength
16
and should not be ignored, as they are in current NO emission inventories.
17
Solmon (2001) predicted fine-scale scenarios of biogenic VOC emissions from forests at the
re-18
gional level, with a similar resolution as ours for NO. Different spatial distributions of sources
19
were tested with a chemical transport model. An heterogeneous spatial distribution of VOC
20
sources, such as patches of forests or other concentrated sources in a much larger zone with little
21
background emissions, induced heterogeneous patterns of ozone production in the vicinity of
22
these sources, compared to an homogeneous spatial distribution of sources.
23
The maps on Fig. 8 show that a finer spatial resolution of biogenic NO sources has the potential
24
for bearing a similar influence on photochemical pollution: when only one soil type is assumed
over the whole Ile de France region, the emissions are relatively homogeneous, as is the case
1
with the Stohl et al. (1996) and the Laville et al. (2005) approaches. Taking into account the
2
diversity of soil types occurring on this domain results in a marked spatial differentiation, with
3
higher emission rates to the East and the South-West of Paris. These areas may contribute all the
4
more to the production of ozone in modifying the chemical regimes. The ozone plume is mostly
5
localized at distances between 25 and 110 km from downtown Paris (Tulet et al., 1999), and
6
often to the Southwest of Paris (Menut et al. , 2000).
7
5
Acknowledgments
8
M.-N. Rolland was supported by the French Environmental Agency (ADEME) and the French
9
National Institute for Agricultural Research (INRA).
10
References
11
Agreste - Service Central d’Enquêtes et d’Etudes Statistiques, 2001. Enquête sur les Pratiques
12
Culturales en 2001. Chiffres et données. Série Agriculture 159, French Ministry of
Agricul-13
ture, Forestry and Fisheries, Paris.
14
Baize, D., Girard, M.-C., 1998. A sound reference base for soils : the Référentiel Pédologique.
15
Text in English. Translation by Hodgson, J.M., Eskenazi, N.R., Baize, D. INRA Éditions,
16
Paris.
17
Bardossy, A., Plate E.J., 1992. Space time model for daily rainfall using atmospheric circulation
18
patterns. Water Resources Research 28, 1247-1259.
19
Butterbach-Bahl, K., Strange, F., Papen, H., Li, C., 2001. Regional inventory of nitric oxide and
20
nitrous oxide emissions for forest soils of southeast germany using the biogeochemical model
21
PnET-N-DNDC. Journal of Geophysical Research 106, 155-166.
Butterbach-Bahl K., Kesik M., Mielhe P., Papen H., Li, C., 2004. Quantifying the regional source
1
strength of N-trace gases across agricultural and forest ecosystems with process-based models.
2
Plant and Soil 260, 225-243.
3
Butterbach-Bahl, K., Kahl, M., Mykhayliv, L., Werner, C., Kiese, R., Li, C., 2009. A
European-4
wide inventory of soil NO emissions using the biogeochemical models DNDC/Forest-DNDC.
5
Atmospheric Environment 43, 1392-1402.
6
Chapman, L., Thornes, J.E., 2003. The use of geographical information systems in climatology
7
and meteorology. Progress in Physical Geography 27, 313-330.
8
Centre Interprofessionnel Technique d’Etudes de la Pollution Atmospherique (CITEPA), 2008.
9
Inventaire des Emissions de Polluants Atmosphériques en France - Séries Sectorielles et
Anal-10
yses Etendues. CITEPA, Paris.
11
Cortinovis, J., 2004. Field-monitoring and modeling of biogenic emissions of nitrogen oxides
12
and isoprene from natural and managed ecosystems: impact on tropospheric ozone. Ph.D.
13
dissertation, Paul Sabatier University, Toulouse, France (in French).
14
Davidson, E.A., Kingerlee, W. 1997. A global inventory of nitric oxide emissions from soils.
15
Nutrient Cycling in Agroecosystems 48, 37-50.
16
Deguillaume, L., Beekmann, M., Derognat, C., 2008. Uncertainty evaluation of ozone production
17
and its sensitivity to emission changes over the Ile-de-France region during summer periods.
18
J. Geophys. Res. 113, D02304, doi:10.1029/2007JD009081.
19
Delmas, R., Serça, D., Jambert, C., 1997. Global inventory of NOxsources. Nutrient Cycling in
20
Agroecosystems 48, 51-60.
21
Dudhia, J., 1993. A nonhydrostatic version of the Penn State/NCAR mesoscale model :
tion tests and simulation of an Atlantic cyclone and cold front. Monthly Weather Review 121,
1
1493-1513.
2
Faivre, R., Leenhardt, D., Voltz, M., Benoît, M., Papy, F., Dedieu, G., Wallach, D. 2004.
Spa-3
tialising crop models. Agronomie 24, 205-217.
4
Food and Agriculture Organization (FAO) / International Fertilizer Industry Association (IFIA),
5
2001. Global estimates of gaseous emissions of NH3, NO and N2O from agricultural land.
6
Rome, Italy.
7
Gabrielle, B., Denoroy, P., Gosse, G., Justes, E., Andersen, M. N., 1998. A model of leaf area
8
development and senescence for winter oilseed rape. Field Crops Research 57, 209-222.
9
Gabrielle, B., Roche, R., Angas, P., Cantero-Martinez, C., Cosentino, L., Mantineo, M.,
Langen-10
siepen, M., Hénault, C., Laville, P., Nicoullaud, B., Gosse, G., 2002. A priori parametrisation
11
of the CERES soil-crop models and tests against several European data sets. Agronomie 22,
12
25-38.
13
Gabrielle, B., Laville, P., Hénault, C., Nicoullaud, B., Germon, J.C. 2006. Simulation of nitrous
14
oxide emissions from wheat-cropped soils using CERES. Nutrient Cycling in Agroecosystems
15
74, 133-146.
16
Gabrielle, B., Laville, P., Duval, O., Nicoullaud, B., Germon, J.-C., Hénault, C., 2006.
Process-17
based modelling of nitrous oxide emissions from wheat-cropped soils at the sub-regional scale.
18
Global Biogeochemical Cycles 20, GB4018.
19
Garrido, F., Hénault, C., Gaillard, H., Perez, S., Germon, J.-C., 2002. N2O and NO emissions by
20
agricultural soils with low hydraulic potentials. Soil Biology and Biochemistry 34, 559-575.
21
Godde, M., Conrad, R., 2000. Influence of soil properties on the turnover of nitric oxide and
nitrous oxide by nitrification and denitrification at constant temperature and moisture. Biology
1
and Fertility of Soils 32, 120-128.
2
Hermel, K., 2001. Comparaison des bilans environnementaux entre différents systèmes
3
d’agriculture. M.Sc. dissertation, Ecole Nationale Supérieure des Mines de Paris, Paris.
4
Institut Français de l’Environnement (IFEN), 2005. CORINE land cover 2000 for France.
Tech-5
nical report, Orléans, France.
6
Jones, C.A., Kiniry, J.R., 1986. CERES-N Maize: a simulation model of maize growth and
7
development. Texas A&M University Press, College station.
8
Kiese, R., Li, C., Hilbert, D.W., Papen, H., Butterbach-Bahl, K., 2004. Regional application of
9
Pnet-n-DNDC for estimating the N2O source strength of tropical rainforests in the wet tropics
10
of Australia. Global Change Biology 11, 128-144.
11
King, D., Daroussin, J., Jamagne, M., 1994. Proposal for a spatial organization model in soil
12
science (the example of the European Communities soil map). Journal of American Society
13
for Information Science 45, 705-717.
14
Laville, P., Hénault, C., Gabrielle, B., Serça, D., 2005. Measurement and modelling of NO fluxes
15
on maize and wheat crops during their growing seasons: effect of crop management. Nutrient
16
Cycling in Agroecosystems 72, 159-171.
17
Li, C., Mosier, A., Wassmann, R., Cai, Z., Zheng, X., Huang, Y., Tsuruta, H., Boonjawat, J.,
18
Lantin, R., 2004. Modeling greenhouse gas emissions from rice-based production systems:
19
Sensitivity and upscaling. Global Biogeochemical Cycles 18, GB1043.
20
Linn, D.M., Doran, J.W. 1984 Effect of water-filled pore space on carbon dioxide and nitrous
21
oxide production in tilled and nontilled soils. Soil Science Society of America Journal 48,
22
1667-1672.
Matthews R.B., Wassmann, R., Arah, J., 2000. Using a crop/soil simulation model and GIS
tech-1
niques to assess methane emissions from rice fields in Asia. I. Model development. Nutrient
2
Cycling in Agroecosystems 58, 141-159.
3
Menut, L., Vautard, R., Flamant, C., Abonnel, C., Beekmann, M., Chazette, P., Flamant,
P.-4
H., Gombert, D., Guédalia, D., Kley, D., Lefebvre, M.-P., Lossec, B., Martin, D., Mégie,
5
G., Perros, P., Sicard, M., Toupance, G., 2000. Measurements and modeling of atmospheric
6
pollution over the Paris area: an overview of the ESQUIF project. Annales Geophysicae 18,
7
1467-1481.
8
Monestiez, P., Courault, D., Allard, D., Ruget, F., 2001. Spatial interpolation of air
tempera-9
ture using environmental context: application to a crop model. Environmental and Ecological
10
Statistics 8, 297-309.
11
Monod, H., Naud C., Makowski, D., 2006. Uncertainty and sensitivity analysis for crop models,
12
in: Wallach, D., Makowski, D., Jones, J.W. (Eds.), Working with Dynamic Crop Models.
13
Elsevier, Amsterdam, pp. 55-99.
14
Penman, H.L., 1948. Natural evaporation from open water, bare soil and grass. Proceedings of
15
the Royal Society of London, Series A, Mathematical and Physical Sciences 193, 120-145.
16
Roche, R., Gabrielle, B., Bouthier, A., Gosse, G., 2001. Modelling of nitrate leaching in
17
rapeseed-wheat rotations, in Donatelli, M. (Ed.), Modelling cropping systems. Proc. ESA
18
Congress, July 2001, Florence, Italy, pp. 175-176.
19
Rolland, M.-N., 2008. Biophysical modelling of NO emissions by crops, spatialization and
im-20
pact on photochemical ozone formation at regional scale. Ph.D. dissertation, Paris 6 University,
21
Paris (in French).
22
Rolland, M.-N., Gabrielle, B., Laville, P., Serça, D., Cortinovis, J., Larmanou, E., Lehuger, S.,
Cellier, P., 2008. Modeling of nitric oxide emissions from temperate agricultural soils Nutrient
1
Cycling in Agroecosystems 80, 75–93.
2
Schmidt, H., Dérognat, C., Vautard, R., Beekmann, M., 2001. A comparison of simulated and
3
observed ozone mixing ratios for the summer of 1998 in Western Europe. Atmospheric
Envi-4
ronment 35, 2449-2461.
5
Simpson, D., Winiwarter, W., Borjesson, G., Cinderby, S., Ferreiro, A., Guenther, A., Hewitt,
6
C.N., Janson, R., Khalil, M.A.K., Owen, S., Pierce, T.E., Puxbaum, H., Shearer, M.,
Stein-7
brecher, S., Svennson, B.H., Tarrason, L., Oquist, M.G., 1999. Inventorying emissions from
8
nature in Europe. Journal of Geophysical Research, 104, 8113-8152.
9
Skiba, U., Sozanska, M., Metcalfe, S., Fowler, D., 2001. Spatially disaggregated inventories
10
of soil NO and N2O emissions for Great Britain. Water, Air, and Soil Pollution: Focus 1,
11
109–118.
12
Solmon, F., 2001. Meso-scale modelling of biogenic emissions of volatile hydrocarbons in
13
France. Ph.D. dissertation, Institut National Agronomique Paris-Grignon, Paris.
14
Stohl, A., Williams, E., Kromp-Kolb, G.W.H., 1996. An European inventory of soil nitric oxide
15
emissions and the effect of these emissions on the photochemical formation of ozone.
Atmo-16
spheric Environment 30, 3741–3755.
17
Tiktak, A., De Nie, D., van der Linden, T., Kruijne, R., 2002. Modelling the leaching and the
18
drainage of pesticides in the netherlands: the GeoPEARL model. Agronomie 22, 373-387.
19
Tulet, P., Maalej, A., Crassier, V., Rosset, R., 1999. An episode of photo-oxidant plume pollution
20
over the Paris region. Atmospheric Environment 33, 1651-1662.
List of Figures
1
1 Soil map units as overlaid with administrative county limits and the presence of
2
arable crops in the Ile de France region. . . 21
3
2 Boxplots of marginal distributions for each class of data inputs: crop types (a),
4
soil types (b), weather stations (c) and microbiological parameters (d). The
box-5
plot of the overall distribution of NO emissions is also depicted, showing the
6
median (solid line), first and third quartile (limits of colored rectangles), and
7
10th and 90th percentiles (error bars). . . 22
8
3 Influence of physical input data on the simulated spatial patterns of NO emissions
9
over a short period (1-10 April 2001): (a) uniform weather data taken from a
10
ground meteorological station and soil map, (b) gridded MM5 weather data and
11
uniform soil type (Neoluvisol), and (c) MM5 data and soil map. . . 23
12
4 Emission drivers simulated by CERES-EGC: time-averaged soil moisture, in
vol-13
umetric percents (a), soil temperature (b), and soil ammonium content (c) under
14
a winter wheat crop. Map (d) displays the ratio of soil moisture contents under
15
spring maize and winter wheat. . . 24
16
5 Dynamics of NO emissions (a-b) and drivers: water-filled pore space (c-d),
am-17
monium (e-f), and net N mineralization (g-h), under a similar climate (Grignon
18
county), for a spring crop (maize) and a winter crop (wheat) and 5 soil types. . . 25
19
6 Maps of cumulated NO emissions from November 2000 through December 2001,
20
for 4 land-use types. . . 26
21
7 Maps of cumulated NO emissions from November 2000 through December 2001,
22
for 3 crop types. . . 27
23
8 Maps of cumulative NO emissions from arable soils (kg N-NO ha1
yr−1), as
24
estimated by our spatial inventory (a), by the Stohl et al. (1996) model (b) and by
25
the Laville et al. (2005) model (c), from November 2000 to December, 31st
2001. 28
Figure 1: Soil map units as overlaid with administrative county limits and the presence of arable crops in the Ile de France region.
Figure 2: Boxplots of marginal distributions for each class of data inputs: crop types (a), soil types (b), weather stations (c) and microbiological parameters (d). The boxplot of the overall distribution of NO emissions is also depicted, showing the median (solid line), first and third quartile (limits of colored rectangles), and 10th and 90th percentiles (error bars).
Figure 3: Influence of physical input data on the simulated spatial patterns of NO emissions over a short period (1-10 April 2001): (a) uniform weather data taken from a ground meteorological station and soil map, (b) gridded MM5 weather data and uniform soil type (Neoluvisol), and (c) MM5 data and soil map.
Figure 4: Emission drivers simulated by CERES-EGC: time-averaged soil moisture, in volumet-ric percents (a), soil temperature (b), and soil ammonium content (c) under a winter wheat crop. Map (d) displays the ratio of soil moisture contents under spring maize and winter wheat.
Figure 5: Dynamics of NO emissions (a-b) and drivers: water-filled pore space (c-d), ammonium (e-f), and net N mineralization (g-h), under a similar climate (Grignon county), for a spring crop (maize) and a winter crop (wheat) and 5 soil types.
Figure 6: Maps of cumulated NO emissions from November 2000 through December 2001, for 4 land-use types.
Figure 7: Maps of cumulated NO emissions from November 2000 through December 2001, for 3 crop types.
Figure 8: Maps of cumulative NO emissions from arable soils (kg N-NO ha1 yr−1), as estimated by our spatial inventory (a), by the Stohl et al. (1996) model (b) and by the Laville et al. (2005) model (c), from November 2000 to December, 31st2001.
List of Tables
1
1 Areas and management practices for the 6 dominant crop types and fallow soils
2
in the Ile de France region. Dates are given as days of year (year). . . 30
3
2 Groups of dominant soil types defined for the Ile de France region. . . 31
4
3 Sensitivity indices derived from the ANOVA table of the simulated NO emissions
5
as a function of the various factors included in the plot-scale sensitivity
analy-6
sis. They are calculated as the ratio of the marginal (main effect or first-order
7
interactions) to total variances of NO fluxes. Parameter Vmax is the maximum
8
nitrification rate in soil (2 levels). . . 32
Crop Area Management practices type (ha) Sowing Fertilizer application
Date Date Ratea Form Maize (Zea mays L.) 43 144 107(2001) 115 (2001) 140 UANb Wheat (Triticum aestivum L.) 256 974 295 (2000) 63 (2001) 60 UANb 93 (2001) 100 ANc Barley (Hordeum vulgare L.) 60 162 289 (2000) 54 (2001) 60 UAN
92 (2001) 100 UAN Rapeseed (Brassica napus L.) 52 015 251 (2000) 29 (2001) 60 AN
51 (2001) 120 AN Pea (Pisum sativum L.) 32 278 98 (2001) none
Sugarbeet (Beta vulgaris L.) 41 727 112 (2001) 29 (2001) 40 AN 58 (2001) 89 AN Fallow soilsd 38 711 240 (2000) none
Table 1: Areas and management practices for the 6 dominant crop types and fallow soils in the Ile de France region. Dates are given as days of year (year).
a
unit: kg N ha−1. b
UAN: nitrogen solution (50% urea and 50% ammonium-nitrate, in liquid form). c
AN: ammonium nitrate. d
Soil group Drainage characteristics Geological substrate Texture Reference (Baize and Girard, 1998)
Brunisol well-drained, hydromorphic variable sandy to clayey created
Calcisol well-drained limestone clay loam (Gabrielle et al., 2002) Calcosol, cherty well-drained limestone or chalk clay loam (Roche et al., 1999) Calcosol, sandy well-drained limestone silt sandy created
Calcosol, typical well-drained limestone or chalk silty created
Fluviosol well-drained alluvial deposits silty created
Luvisol on loess well-drained loess clay loam (Hermel, 2001) Luvisol, hydromorphic hydromorphic clay clay loam (Gabrielle et al., 2002) Luvisol, typical well-drained limestone clay loam (Gabrielle et al., 2002) Neoluvisol well-drained limestone clay loam (Gabrielle et al., 2002)
Pelosol very hydromorphic clay clay created
Planosol very hydromorphic clay silty or sandy/clayey created
Podzosol very well-drained sand sandy (Gabrielle et al., 1998) Rendosol well-drained limestone clay loam (Gabrielle et al., 1998)
Input Factors Sensitivity index Soil type 0.784∗∗∗,a
Crop type 0.039∗∗∗ Climate 0.001∗∗∗ Vmax 0.001∗∗∗ Soil:Crop 0.155∗∗∗ Soil:Climate 0.005∗∗∗ Soil:Vmax 0.002∗∗∗ Crop:Climate 0.001∗∗∗
Crop:Vmax 2.4E-5
Climate:Vmax 2.4E-11
Residual 0.011
a: significance level (F-test): 0.01%.
Table 3: Sensitivity indices derived from the ANOVA table of the simulated NO emissions as a function of the various factors included in the plot-scale sensitivity analysis. They are calculated as the ratio of the marginal (main effect or first-order interactions) to total variances of NO fluxes. Parameter Vmaxis the maximum nitrification rate in soil (2 levels).