DEVELOPMENT AND APPLICATION OF A METHODOLOGY FOR MEASURING ATMOSPHERIC MERCURY BY INSTRUMENTAL
NEUTRON ACTIVATION ANALYSIS by
Michael R. Ames
B.S. Nuclear Engineering, Massachusetts Institute of Technology (1984) M.S. Nuclear Engineering, Massachusetts Institute of Technology (1986)
Submitted to the Department of Nuclear Engineering in partial fulfillment of the requirements for the degree of
Doctor of Science in Nuclear Engineering
at the
Massachusetts Institute of Technology June 1995
© Massachusetts Institute of Technology 1995. All rights reserved. Signature of Author
Departme it/f Nuclear Engineering
.Mw-, 17 1QQCertified by ;
ila aOlmez,
T
is Advisor
Principal Research Scientist, Nuclear Reactor Lab Certified byMichaej. Driscoll, Thesis Reader Professor Emeritus, Nuclear Engineering Accepted by
.-- - ..--- --- --- --- -.--..- Allan F. Henry.-.---.
Chairman, Department Committee on Graduate Students
Science
MASSACHUSETS INSTITUTE OF TFufljnt nOG
DEVELOPMENT AND APPLICATION OF A METHODOLOGY FOR MEASURING ATMOSPHERIC MERCURY BY INSTRUMENTAL
NEUTRON ACTIVATION ANALYSIS
by
MICHAEL R. AMES
Submitted to the Department of Nuclear Engineering on May 17, 1995 in partial fulfillment of the requirements for the degree of
Doctor of Science in Nuclear Engineering ABSTRACT
A complete methodology has been developed and tested for the
collection of atmospheric vapor phase mercury by activated charcoal sorbents, and its measurement by instrumental neutron activation analysis (INAA). Automatic air samplers were constructed and used for two years to obtain four samples weekly at five locations across Upstate New York. A total of 1149 measurements were made from 2120 possible sampling dates. Mercury concentrations were found to be between 0.6 and 9.0 ng/m3, with a typical
analytical error of +0.3 ng/m3.
The vapor phase mercury concentrations at all five sampling sites
displayed similar, distinctive seasonal trends of higher winter and lower
summer levels. This commonality indicates that vapor phase mercury in the
region is affected by large, regional changes in either the relevant sources, orin atmospheric transformations. Though particulate phase mercury
concentrations also exhibited a maximum in the winter, the same temporal changes were not seen at all five sites, and these maxima did not coincide with those for the vapor phase. Thus particulate phase mercury
concentrations are being influenced by different nearer range source
variations or weather patterns.
Source identification was performed using multivariate factor analysis and by observing distinct elemental source profiles in particulate samples obtained on the same dates as the vapor phase samples. This analysis
indicated a strong impact on the area's mercury concentrations from smelters, precious metals works, and aluminum plants. Wind trajectories from
industrialized areas in Canada and the U. S. matched with the highest levels of these influences.
precious metals works, and aluminum plants. Wind trajectories from
industrialized areas in Canada and the U. S. matched with the highest levels
of these influences.An inverse relationship between vapor phase mercury and
tropospheric ozone measured at the sampling locations was also observed.
Though a causal link cannot be concluded from the available data, the
heterogeneous oxidation rate of metallic mercury by ozone is estimated to be large enough to account for this correlation.Thesis Supervisor: Dr. Ilhan Olmez
Title: Principal Research Scientist, MIT Nuclear Reactor Lab, and Department of Nuclear Engineering
Thesis Reader: Dr. Michael J. Driscoll
BIOGRAPHICAL SKETCH Name: Michael Richard Ames
Born: March 11, 1961; New York, New York Education:
Doctor of Science, in Nuclear Engineering, M. I. T., June 1995 Thesis Title: Development And Application Of A Methodology For
Measuring Atmospheric Mercury By Instrumental Neutron Activation
Analysis
Master of Science in Nuclear Engineering, M. I. T., February 1986 Thesis Title: A Characterization of the Post-Irradiation Properties of Copper Alloys for Fusion Applications
Bachelor of Science in Nuclear Engineering, M. I. T., June 1984 Thesis Title: Observations of the Soft X-Ray Emissions of the Versator II Tokamak During Lower Hybrid Current Drive
Secondary Education, Ossining Public Schools, Ossining New York, 1979
Employment:
M. I. T. Nuclear Reactor Lab September 1986 - September 1990 Research Engineer, Coolant Corrosion Loops
Universal Voltronics Corp., Mt. Kicso, NY Summer 1981 Harrick Scientific Corp., Ossining NY, July 1978 - August 1980 Affiliations:
Sigma Xi, Scientific Research Society, associate member since 1986. American Nuclear Society, student member since 1991. Alpha Nu Sigma, Nuclear Engineering Honor Society, member since 1992.
Health Physics Society, student member since 1993.
Publications and Proceedings:
"A Methodology for Determining Vapor Phase Mercury by Instrumental
Neutron Activation Analysis", M. Ames, I. Olmez, S. Meier and P. Galvin,Second International Conference on Managing Hazardous Air Pollutants,
Electric Power Research Institute, Washington, D.C, (1993)."Elemental Composition of Charcoal Sorbants", I. Olmez, M. Ames and J.
Che, Second International Conference on Managing Hazardous Air
Pollutants, Electric Power Research Institute, Washington, D.C, (1993)."Mercury Determination in Environmental Materials: Methodology for
Instrumental Neutron Activation Analysis" I. Olmez, M. Ames and N. K. Aras, The Measurement of Toxic and Related Air Pollutants, EPA, Durham, N. C. (1993)."In-Pile PWR Loop Coolant Chemistry Studies in Support of Dose
Reduction", G. E. Kohse, R. G. Sanchez, M. J. Driscoll, M. Ames and 0. K.
Harling, The Second JAIF International Conference on Water Chemistry,
Fukui City, Japan (1991)."Materials and Water Chemistry Research in Support of LWR Technology at MIT", O. K. Harling, M. J. Driscoll, G. E. Kohse, R. G. Ballinger, I. S. Hwang, M. Ames, S. Suzuki, S. T. Boerigter and P Stahle, The JAIF International Conference on Water Chemistry, Tokyo, Japan (1991).
"Neutron Irradiation Scoping Study of Twenty-five Copper-Base Alloys", O. K. Harling, N. J. Grant, G. E. Kohse, M. Ames, T. -S. Lee and L. W. Hobbs, Journal of Materials' Research, 2, No. 5 (1987).
"Progress in Developing DBTT Determinations from Miniature Disk Bend Tests", G. E. Kohse, M. Ames and 0. K. Harling, Journal of Nuclear Materials,
141 - 143, pp. 513 - 517. (1986).
"Microstructural Evolution and Swelling of High Strength, High
Conductivity RS-PM Copper Alloys Irradiated to 13.5 dpa with Neutrons", T. -S. Lee, L. W. Hobbs, G. E. Kohse, M. Ames, O. K. Harling and N. J. Grant, Journal of Nuclear Materials, 141 - 143, pp. 179 - 183 (1986).
"Mechanical Property and Conductivity Changes in Several Copper Alloys
after 13.5 dpa Neutron Irradiation", M. Ames, G. E. Kohse, T. -S. Lee, N. J. Grant and 0. K. Harling, Journal of Nuclear Materials, 141 - 143, pp. 174 - 178ACKNOWLEDGMENTS
This research was supported by the Empire State Electric Energy
Research Corporation (ESEERCO), the New York State Department of
Environmental Conservation (NYSDEC) and the Adirondack Lakes Survey
Corporation (ALSC). Special thanks are due to Sandra Meier of ESEERCO and Philip Galvin of NYSDEC.Without the careful and dedicated work of the NYSDEC and ALSC
field operators none of this would have been possible. Thanks are deeply
owed to Paul Aery and Tom Dudones of ALSC and to Hollis Potter, Terry Novak and Jim Wolfe of NYSDEC for two years of sample changing in wind, rain, and snow.As supervisor for this thesis Dr. Ilhan Olmez has been a teacher, a
colleague, and a friend. It has been an enriching and demanding pleasure to have worked with him on this and other projects.Professor M. J. Driscoll has been extremely helpful in preparing this document by employing his legendary skill as a thesis reader.
The operations staff of the MITR-II performed all of the irradiations for the analysis and testing used in this thesis, and deserve generous thanks for their consistent performance and accommodating efforts.
The other members of the ER&R lab have been helpful in their
technical discussions and for the way they have helped this lab function as a family. Additional particular thank you's to Jack Jec-Kong Gone, Xudong Huang, and S. Sinan Keskin, for late night sample changing; Jianmei Che forspectral peak fitting, and Giilen Giillii for help with the factor analysis.
For giving me the chance to prove myself at times when others might not have, thanks are due Professor O. K. Harling, MITR-II Director.
As this is the formal end of my career as a student, I would like to express my gratitude to those who began me on this path by expecting the best: Ms. Betty Davis. Dr. Arthur Margro, and Ms. Mirla Morrison of the Ossining Public Schools, and Dr. N. J. Harrick of the Harrick Scientific
Corporation.
I am most grateful for the eternal love and support of my family and especially my mother Dr. Rose G. Ames who has made all things possible.
For every day making my life full of happiness and hope, thank you to my wife Cynthia Woolworth and my daughter Charlotte Woolworth Ames.
This thesis is dedicated to the memory of my father Dr. Richard C.
Ames, from whom I have always learned the most important lessons.
TABLE OF CONTENTS ABSTRACT ... 2 BIOGRAPHICAL SKETCH ... 4 ACKNOWLEDGMENTS ...6 TABLE OF CONTENTS ... 7 LIST OF FIGURES ... 9 LIST OF TABLES ... 11 1. INTRODUCTION...12 1.1 Historical Perspective ... 12
1.2 Project Motivation, History and Objectives ... 15
1.3 Thesis Overview ... 17
2. ATMOSPHERIC MERCURY ... 19
2.1 Sources . ...20
2.2 Atmospheric Transformations ... 23
2.3 Fate ... 27
2.4 Overall Cycle and Budget ... 30
3. SAMPLING FOR ATMOSPHERIC MERCURY ... 36
3.1 Current Standard Methods for Vapor Phase Mercury Analysis ... 37
3.2 Sampling Requirements for INAA ... 41
3.3 Charcoal Testing for Composition ... 42
3.4 Charcoal Testing for Collection ... 47
3.5 Field Use of the Charcoal ... 50
3.6 Collection Efficiency Problems ... 52
3.7 Sampler Equipment Design . ...65
3.8 Field Operations . ...73
4. INSTRUMENTAL NEUTRON ACTIVATION ANALYSIS (INAA) ....79
4.1 Basic INAA Theory ... 80
4.2 The Past Use of NAA for Mercury Determination ...84
4.3 The Optimization of INAA for Mercury Determination ...91
4.4 Analytical Difficulties ... 96
4.5 The Analytical Methodology for Mercury Determination
by INAA ...
99
5. RESULTS AND DISCUSSION ... 112
5.1 Mercury Concentrations and Initial Interpretations ...113
5.2 Factor Analysis and Source Identification ...120
5.3 Atmospheric Transformations and Fate ...129
6. SUMMARY AND SUGGESTIONS FOR FUTURE RESEARCH ... 135
7. REFERENCES ... 140
APPENDIX A. APPENDIX B. APPENDIX C. ELEMENTAL CONCENTRATIONS OF ACTIVATED CARBON SORBENTS ... 145
SITE OPERATING PROCEDURES AND SAMPLE DATA SHEET ... 152
LIST OF FIGURES
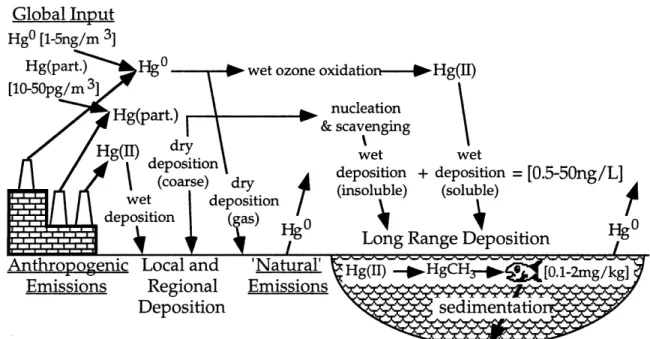
Figure 1. Local and regional atmospheric mercury cycle ...32
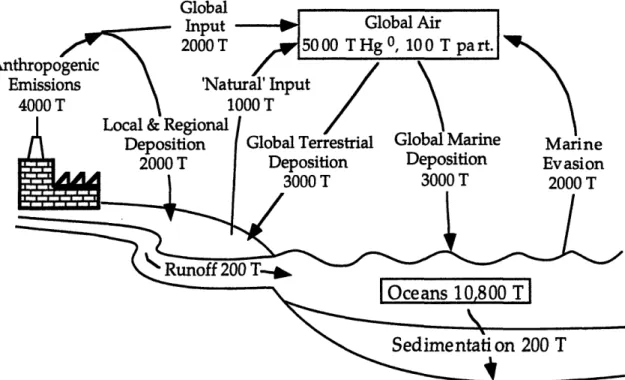
Figure 2. The global atmospheric mercury cycle and budget ...33
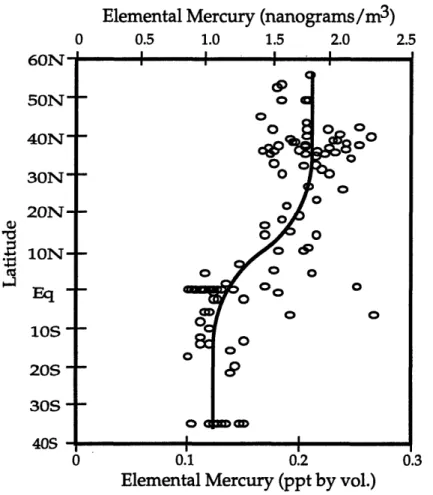
Figure 3. Elemental mercury over the mid-Pacific Ocean ...34
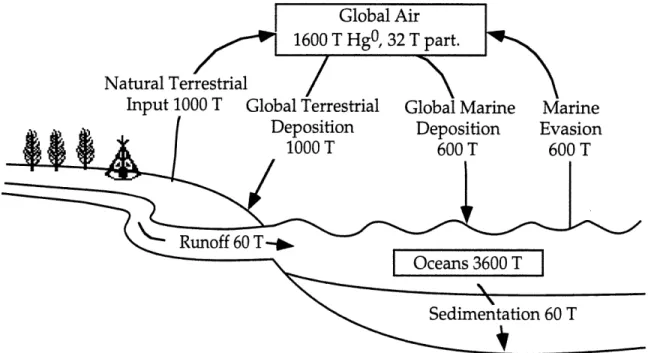
Figure 4. The pre-industrial global atmospheric mercury
cycle and budget ...
35
Figure 5. Concentrations of selected trace elements in 18 charcoal sorbent . s ...44
Figure 6. Concentrations of arsenic, selenium, and barium in 18 charcoal sorbents . ... 44
Figure 7. Concentrations of sodium and zinc in 18 charcoal sorbents ...45
Figure 8. Mercury concentrations in 18 charcoal sorbents ...46
Figure 9. Radioactive mercury tracer experiment, type 1 ...48
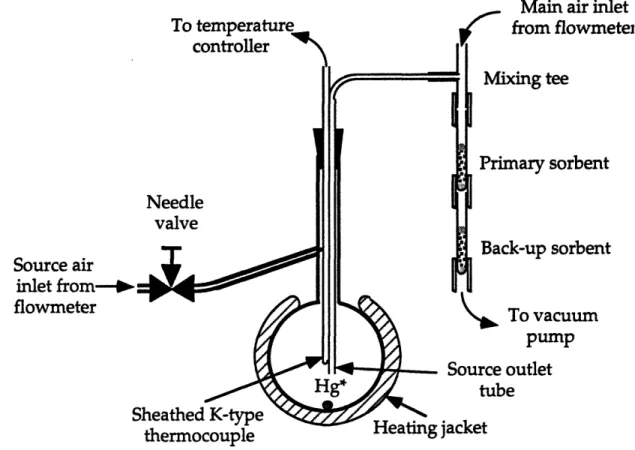
Figure 10. Sorbent collection tube for vapor-phase mercury sampling, ... 51
Figure 11 Radioactive mercury tracer experiment, type 2 ...54
Figure 12. Radioactive mercury tracer experiment, type 3 ...56
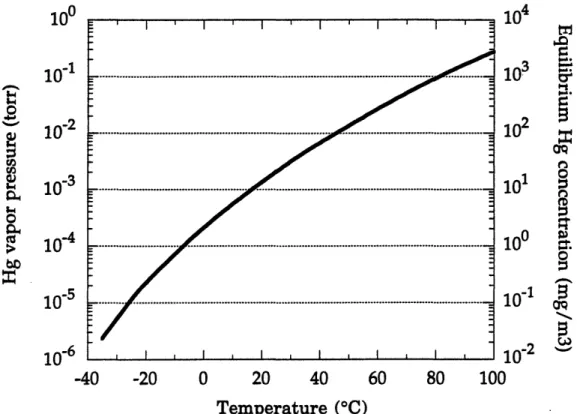
Figure 13. Mercury's vapor pressure in torr and its equilibrium concentration in mg/m 3 as a function of temperature ...58
Figure 14. Radioactive mercury tracer experiment, type 4 ...59
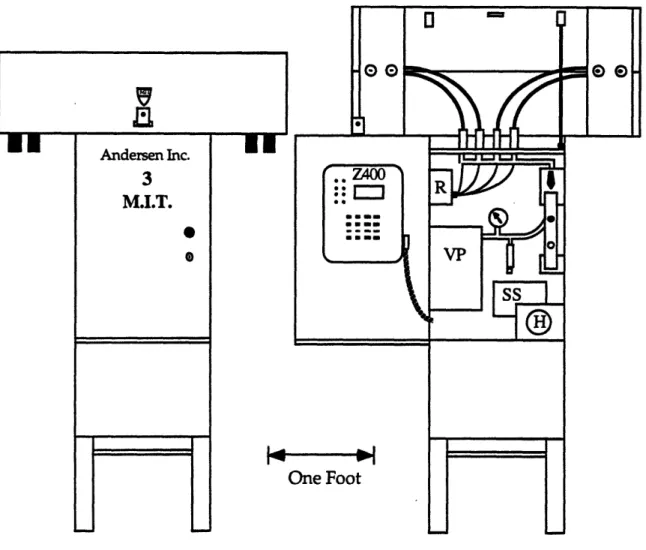
Figure 15. A front view of the complete vapor-phase mercury sampling system ... 67
Figure 16. Sample assembly ... 71
Figure 17. Schematic flow diagram of the vapor-phase mercury
sampling system .
...
72
Figure 18. Atmospheric sampling locations in Upstate New York ...74
Figure 19. Schematic spectrum of single, high energy gamma ray source obtained using a germanium detector ...83
Figure 20. The full collected INAA spectrum of an atmospheric mercury sample ... 86
Figure 21. INAA spectrum of an atmospheric mercury sample on 100 mg charcoal, expanded around the 77 keV ...87
Figure 22. INAA spectrum of an atmospheric mercury sample on 100 mg charcoal, expanded around the 279 keV ...88
Figure 23. Composite spectrum showing reduction of lead X-rays by lining detector's shielding ...93
Figure 24. Figure 25. Figure 26. Figure Figure Figure Figure Figure Figure Figure 27. 28. 29. 30. 31. 32. 33. Figure 34. Figure 35. Figure 36. Figure 37. Figure 38. Figure 39. Figure 40.
Schematic diagram of aluminum and copper
shielding liners ... 93
A schematic of the peak and background areas used in a gamma spectrum ... 95
Calculated error of 77 keV peak determination as a function of cooling time...95
Vapor phase mercury measurements at Belleayre ...115
Vapor phase mercury measurements at Moss Lake ...115
Vapor phase mercury measurements at Perch River ...116
Vapor phase mercury measurements at Westfield ...116
Vapor phase mercury measurements at Willsboro ...117
Smoothed average mercury measurements at all five sites ...117
Vapor phase mercury factor score plots for Belleayre, Moss Lake, Westfield, and Willsboro ...124
Perch River factor score plots for three identified source types ...127
Wind trajectories ending at Perch River and associated with high factor scores ...128
Smoothed vapor phase mercury, ozone , and particulate
mercury concentrations at Belleayre NY ...130Smoothed vapor phase mercury , ozone , and particulate
mercury concentrations at Moss Lake NY ...130Smoothed vapor phase, fine and coarse particulate
mercury concentrations at Perch River NY ...131Smoothed vapor phase mercury , ozone, and particulate
mercury concentrations at Westfield NY ...131Smoothed vapor phase, and particulate mercury
concentrations at Willsboro NY ... 132LIST OF TABLES
Table 1. Typical concentrations of mercury species in the atmosphere .... 24 Table 2. Chemical reactions of atmospheric Mercury ...25 Table 3. Selected efficiency tests of Calgon Carbon sorbents, type 3 ...62 Table 4. Selected efficiency tests of Calgon Carbon sorbents, type 4 ...63 Table 5. Efficiency test of Calgon Carbon charcoal using parallel
samples taken with iodated charcoals ...64 Table 6. Sample corrections for spectral interferences when using
279 keV for mercury determinations ... 91 Table 7. Seasonal and overall averages of vapor phase mercury
concentrations in ng/m 3at all sites ...114
Table 8. Seasonal and daily variations, and overall standard deviation in the mercury concentrations for two
1 INTRODUCTION
Mercury is familiar to almost everyone due to its use in thermometers,
electrical equipment, and perhaps from old high school chemistry
demonstrations. Indeed, though they probably don't realize it, most people
have a small amount in their mouths in the form of dental amalgams.
Mercury's toxicity is also widely known, though less understood, from
frequent warnings and restrictions on the consumption of fresh water fish
caught in certain areas. Over the past forty years it has moved from being along recognized occupational toxin to being an acutely poisonous local
industrial pollutant to its current status as a regional or even global publichealth hazard. This latest state was realized when relatively elevated levels
of mercury were found in areas very far from known sources.Mercury contamination in remote regions can occur through long
range atmospheric transport.
Existing in the air as an atomic vapor,
mercury's high vapor pressure and low solubility give it an atmospheric
lifetime of up to one year. The concentration in ambient air is however extremely low, and elevations above the natural background level are small.This makes the measurement and analysis of ambient atmospheric mercury
troublesome. The present work involves the development of a methodologyfor determining atmospheric mercury at levels which have caused great
difficulties for standard techniques. Through the use of activated charcoalsorbents and direct instrumental neutron activation analysis (INAA), vapor
phase mercury determinations can now be routinely and simply performed at
the natural background level of about one nanogram per cubic meter of air.1.1 Historical Perspective
Among the vast number of chemicals known to mankind, mercury is
one of the most unique due to its long history, its toxicity, and its chemicaland physical properties. It was known to the ancient Chinese and Hindus,
and has been found in Egyptian tombs from 1500 B. C. The Phoenicians
traded cinnabar (HgS, used as the pigment vermilion) from around 700 B. C. and the medicinal use of 'liquid silver' (Hydrargyrum in Latin) is described by Aristotle. Mercury's ability to separate precious metals such as gold and silver from their ores by amalgamation was known as early as 500 B. C. and is stillemployed today for gold extraction in the Amazon region. Through the
Middle Ages, alchemists regarded the metal as the key to transforming basemetals into gold (ironically the detection method developed in this thesis is
based on turning mercury itself into gold).Mercurialism as an occupational disease was recognized by the Romans who sentenced slaves and prisoners to work the mines of Almaden in Spain.
Mercury poisoning, either acute or chronic, affects the central nervous
system, with early signs ranging from tingling in the hands and feet, slurring of speech, loss of coordination, and difficulties in vision and hearing. In theorganic form (methyl mercury, CH
3Hg+) mercury can pass through the
blood/brain barrier and through the placenta (Lindqvist, 1985). With the
increased use of mercury and its compounds in crafts, industry and for the
treatment of such ailments as syphilis, the toxic effects of mercury becamemore common. The expression "mad as a hatter" stems from the use of
mercuric nitrate in the making of hat felts from rabbit fur. Mercuric chloride(the corrosive sublimate HgC12) was used as an antiseptic, but its toxicity was
further employed as a violent poison through the Middle Ages.
The modern realization of mercury as a public health hazard came
about because of the Minamata disaster of 1953-1956. Fifty-two deaths and
over seven hundred poisonings resulted in a year (and many more over the
next several years) when the fish which were the staple of the local
community's diet became contaminated with dimethyl mercury sulfide
(CH
3HgSCH3). It was not until 1958 that the mercury was found to be the
source of the poisonings and to have originated from a local chemical works where mercury salts were used inefficiently as a catalyst and discharged into the shallow Minamata Bay in an inorganic form (Kurland, 1960). The use of
mercury containing fungicides has also caused numerous deaths world wide
when treated seeds meant for planting were inadvertently consumed directly.
The most notable case here occurring in rural Iraq in 1971 when 459 deaths resulted from alkyl mercury poisoning.It is consumption of mercury contaminated fish as in Minamata which
continues to keep mercury pollution a matter of scientific interest, public
concern, and government regulation. As mentioned above, the general
airborne concentration of mercury is extremely low, well below any level
where it might be considered a direct hazard. However, once the mercury
reaches open waterways, it enters a complex web of chemical reactions andmicrobial activity where it may eventually be transformed into methyl
mercury. In this form, which is resistant to environmental degradation,
mercury is ingested and retained by aquatic organisms. In fish, the mercury
accumulates preferentially in the muscles with proportionately much less in
neural tissues than in birds or mammals. Traveling up the food chain,
through the process of bio-accumulation the concentration of mercury in
large fish can reach several micrograms per gram or ppm (the fish which
caused acute poisonings at Minamata contained an average of 50 ppm
mercury). The death of at least one Florida panther has been attributed to the consumption of raccoons who in turn consumed mostly fish (Douglas, 1994).Consumption of fish with this level of mercury constitutes a
significant health risk to humans, especially small children and developing
fetuses. Game fish in many areas exceed state, national, and international
public health guidelines for mercury levels. The U.S. Food and Drug
Administration removes fish from stores if its mercury level exceeds one
ppm. It is somewhat surprising though fortunate that this is the general
public's only source of exposure to hazardous levels of mercury. Public
knowledge of mercury contamination of local fish may be gauged by the fact that the subject is frequently covered by the press (e.g. The Boston Globe ran alengthy story including measured concentrations beginning on the front page,
September 2, 1992). General concern in industrial circles can be judged by thelevel of funding in mercury research by organizations such as the Electric
Power Research Institute (EPRI), which has been studying mercury for ten
years as part of the PISCES (Power Plant Integrated Systems: Chemical
Emissions Studies); MTL (Mercury in Temperate Lakes) projects (Moore, 1994;and Douglas,1994); and this study supported by the Empire State Electric
Energy Corporation (ESEERCO) and the New York State Department of
Environmental Conservation (NYSDEC) through the Adirondack Lakes
Survey Corporation (ALSC).Initial governmental reaction to elevated mercury levels in fish is
generally the issuance of warnings covering certain locations and some types of fish. The next step, aimed at reducing the amount of mercury in fish, is thereduction in the emissions of mercury into the environment.
Though
discharging mercury directly to waterways has been prohibited for about two
decades (Douglas, 1994), releases to the atmosphere continue and are nowestimated to exceed direct aquatic inputs by at least an order of magnitude
(Lindberg, 1986). The appearance of elevated mercury levels in remote waters
further indicates atmospheric transport as the means of contamination
(Nater, 1992; Slemr, 1985; and Sorenson, 1990). The Clean Air Act
Amendments of 1990 (CAAA) thus requires the EPA to perform major
studies regarding mercury's health risks, its deposition to large lakes, and its
emissions from electric utilities.
Mercury is one of only eight hazardous air pollutants for which the
EPA set emissions standards under the initial Clean Air Act of 1970, and it isamong the 189 hazardous air pollutants requiring maximum achievable
control technology (MACT) under Title III of the CAAA (BNA, 1991). This is where a better understanding of mercury transport and fate is essential. TheEPA's decisions regarding control measures will be based in part on the
results of studies such as those mentioned above. Knowing the significant
sources of atmospheric mercury and identifying the areas which have becomecontaminated is not enough. What is needed is to link the two so that
emissions reductions will indeed result in reduced human exposures.Further complicating the need for a cradle to grave understanding of
atmospheric mercury however are uncertainties in determining its
concentration. Historically, analytical errors and contamination of samples
have meant that many mercury measurements were of questionable merit.
Stack emissions quoted by the EPA in 1989 for bituminous coal plants varied by a factor of one hundred (Moore 1994). Measurements in natural watersduring the 1970's range from zero to one thousand nanograms per liter
(Lindqvist, 1985). Previous to 1985 anthropogenic emissions to the
atmosphere were thought to be small compared to natural sources based on
measurements of pre-industrial Greenland ice cores whose values turned out
to be too high by a factor of ten (Lindqvist, 1985). Even though there is
currently a much better appreciation of the need for clean sampling and
analytical protocols, the anthropogenic contribution to the atmosphere is
perhaps only known to within a factor of two (Expert Panel, 1994).1.2 Project Motivation, History, and Objectives
The central question with regard to mercury, is to find its pathways
from emissions, through the atmosphere, into wet and dry deposition, and
eventually to human (and wildlife) exposure. In order to help answer this
question several areas of research are in need of further development. These are well laid out in a recent EPRI report "Mercury Atmospheric Processes: A
Synthesis Report" (Expert Panel, 1994) which was prepared by an
international expert panel convened by EPRI in March 1994. Among thoseneeds the ones primarily addressed in this work are improvements in the
tools used for mercury determination, and in a long range, long term
monitoring program for identifying trends and improving current models.
Past problems in mercury sampling and analysis using standard techniques
have been somewhat overcome in recent years through the use of ultra-clean protocols, but INAA is still one of the most sensitive methods for mercurydetermination in many samples, and the refinements developed here have
kept this methodology in the forefront of the mercury field. There is also agreat need for improved source sampling capabilities, and this methodology
has been successfully applied in a number of stack sampling inter-laboratorycomparisons, as well as in the analysis of coal and various oil samples
(Olmez, 1995). Interestingly, these 'dirtier' samples are more difficult for
other analytical techniques, but are generally easier to analyze than
environmental samples when using INAA.
In 1990 the M.I.T. Nuclear Reactor Lab's Environmental Research &
Radiochemistry group (NRL-ER&R,
then known as the Trace Analysis and
Radiochemistry or TAR division) began taking samples of atmospheric
particulates and wet deposition across upstate New York and analyzing them for trace elements. The work was sponsored by the Empire State Electric Energy Research Corporation (ESEERCO) and the Adirondack Lakes Survey Corporation (ALSC). The primary goal of this research was to determine theimpact of various anthropogenic sources on the region by using elemental
markers and source signature profiles.
The analysis of atmospheric
particulates by INAA allows up to forty elements to be determined routinely.Sampling was performed daily at five sites using automated PM-10
dichotomous samplers. These follow the U.S. EPA's standards for collection of particulates less than ten microns in size, and further segregates the particle into fine (< 2.5 gm) and coarse (2.5 gm - 10 jgm) fractions. The significance of these sizes is that particles smaller than ten microns are considered inhalable, and those less than 2.5 m are more generally of anthropogenic origin and are also able to travel greater distances through the atmosphere.It was soon recognized that a better understanding of the sources,
transport, and fate of atmospheric mercury could be an important part of thisresearch. The need for this information was evidenced by the general public
awareness of the problem, the impending re-evaluation of federal regulation
of mercury emissions, and by a call in the literature for better measurements
of long term and regional mercury concentrations as mentioned above.
However, the determination of mercury in these particulates was not initially
undertaken due to the special precautions needed; the problems of mercury
analysis by INAA or by other methods was mentioned specifically in the
original project's proposal. Although mercury determination by INAA is
extremely sensitive, mercury's high volatility and nuclear recoil energy
typically require that samples be encapsulated in quartz tubes for irradiation.
This would be expensive and extremely time consuming if it were required
for all of the samples involved in this study.Additionally, of the total mercury in the atmosphere, only a few
percent of it is associated with particulate matter, the vast majority is in the
vapor phase and so is not collected by the PM-10 sampling systems.
Therefore, a separate study was proposed in 1991 to develop a complete
program for determining particulate and vapor phase mercury at the five
New York locations. The collection of particulate samples was covered by the above mentioned trace elements program, but the need for special handlingand preparation of the samples was specifically outlined. The collection of
vapor phase mercury would require a new sampling system and analytical
procedures. The design of this system, the development of the analytical
methodologies, and the implementation of these for samples from Upstate
New York, is the work covered by this thesis.1.3 Thesis Overview
This thesis is comprised of six chapters. As an introduction, chapter
one has offered a brief history of mercury, particularly as it pertains to the
environment and public health, followed by an account of the beginnings ofthis project.
Chapter two provides a background in the current
understanding of atmospheric mercury's sources, transport, and fate, with
particular emphasis on the role this thesis' research will provide in
identifying and quantifying these. Chapter three covers the details of the
design, testing and operation of the sampling system, especially the use of
activated carbon as a collection medium. Chapter four will discuss the
development of a methodology for the routine determination of mercury at
trace levels by instrumental neutron activation analysis (INAA). Chapter
five will then present the results of the mercury measurements made at the
five New York sampling sites and discuss their significance. Chapter six willconclude with a summary of the thesis, offer some improvements to the
current methodologies, and outline some proposals for future research.2 ATMOSPHERIC MERCURY
As mentioned above, the general concern with mercury in the
environment is due to its tendency to accumulate to hazardous levels in fish.If consumed in sufficient quantities mercury causes neurological disorders in
humans and other carnivores (deaths of rare Florida panthers and large fish
eating birds of the Atlantic have been attributed to mercury poisoning,
Douglas, 1994). The previous cause of such contamination was the direct
discharge of mercury to waterways. Though such practices have been reducedor eliminated, mercury continues to be found at elevated levels in many
areas. Some of this may be residual contamination from previous episodes, and some due to the changing chemistry or topography of waterways (e.g. the damming of the Colorado River). The presence of mercury in remote andundisturbed waters, and the increase in measured mercury emissions,
concentrations, and deposition indicate that long range atmospheric transport
of mercury is responsible for some of the current contamination problems
(Keeler, 1992; Nater, 1992; and Sorenson, 1990).In order to lessen the impact of anthropogenic sources of atmospheric
mercury on the environment the initial regulatory response is to require
reduced emissions from the larger identifiable point sources (BNA, 1991).
However, the relative contributions of local, regional, and global sources is both location and site specific. Emissions of mercury bearing particulates may deposit locally if they are of sufficient size, or may travel hundreds of miles.Soluble species have a widely variable lifetime depending on local
meteorological conditions. Vapor phase mercury, which in some cases (e.g. coal fired power plants) comprises the bulk of the emissions, has a lifetime ofup to one year, meaning that its local or regional impact may not be
significant. Local deposition may be made up of a particular form of mercury which is not a major part of the total, so even large reductions in emissions, if improperly targeted, may have little local effect. If the control technologiesare to provide a significant improvement in environmental and public
health, the sources, transformations, and fate of atmospheric mercury need to be well understood.2.1 Sources
As there is a significant abundance of natural mercury, both crustal and aquatic, there is of course a natural amount of mercury in the atmosphere as well. The mercury content of typical rocks range from a few up to several hundred parts per billion, with some common mineral ores as high as a few hundred parts per million. The levels near the sites of active mercury mines such as those near Almaden Spain are as high as 20% (D'Itri, 1972). The general worldwide distribution of mercuriferous belts tends to follow regions of geological activity. Natural waters, including the oceans and inland fresh
waters have on the order of 0.5 to 5 nanograms per liter with the mercury in
ocean waters being stabilized as HgC14
2- (Lindqvist, 1985) The natural
vaporization and evasion of these large mercury pools result in a globally
averaged atmospheric mercury concentration of about 1.6 nanograms per
cubic meter (ng/m3). The flux of mercury to the atmosphere is driven by its availability at the surface since at 200C its equilibrium vapor concentration is:20 ng/m
3.
It is somewhat misleading however to consider this as the natural
concentration level for atmospheric mercury because anthropogenic
emissions over the past one hundred years greatly outweigh the
pre-industrial abundance of available mercury. It is estimated that since 1890 twohundred thousand tons of mercury have been emitted to the atmosphere
(Expert Panel, 1994), whereas the current atmospheric burden is perhaps only five thousand tons (the troposphere is 3.1 x 10¹⁸ m3). Thus a great deal ofwhat may appear to be natural emissions of mercury especially from the
oceans is actually the re-emission of anthropogenically produced mercury. The specifics of this storage and re-emission will be addressed at the end ofthis chapter, but an estimate of the present 'natural' global emission rate is
one thousand tons from land and two thousand tons from the oceans
annually (ref Mason 1994).Anthropogenic sources can be categorized in a variety of ways, the first being to divide them into diffuse and point sources. Point sources constitute the largest mercury emissions, are the easiest to measure, and the most likely
to be addressed by regulation. World-wide mercury consumption is on the
order of ten kilotons [metric] per year; up to one half of this is lost to the environment though source estimates vary by as much as a factor of two (refExpert Panel). The EPA has recently attempted to inventory airborne mercury releases in the U. S. (for the first time in twenty years) with the intent of using these figures as a basis for new regulations on emissions (ref Raloff 1994a). Of a total 341 tons annually they ascribe 117 to coal fired and 4.4 to oil fired power
plants. The mercury released from these plants originates as naturally
occurring impurities in the fuels, and emissions are frequently estimated by
analyzing plant feed stocks. Municipal and medical incinerators are
estimated as annually contributing 64 tons each and commercial and
industrial boilers generating 30 tons. Presently, none of these sources are
under regulatory control and power plants are specifically exempt under the
1990 CAAA, though this may obviously be changing soon.
Globally, the largest source component is fossil fuel combustion for
industrial applications, which contributes about 1200 tons per year. Waste
incineration accounts for 600 tons and electricity production about 300 tons annually (about 60 tons from U.S. plants) (ref Douglas). The concentration of mercury at the outlet of a 500 MW coal fired power plant is on the order of afew micrograms mercury per cubic meter, which corresponds to about 200
kilograms of mercury per year. Industrial sources include chlor-alkali
production, metal ore roasting, refining and processing are also significant in some areas. Canadian base and precious metals recovery accounts for 45% of that country's emissions, and these sites are frequently upwind of the Upstate New York sampling locations in this work (Peterson, 1990).Diffuse sources are, in general, much harder to quantify, but some mass balance based estimates are possible and it appears that the global sum of these many small sources is up to 1000 tons per year. The EPA estimates from the emissions inventory cited above an annual U.S. release of 8.8 tons from the
breakage of fluorescent and other lamps, 4.4 tons from latex paints where
mercury has been used as a bio-cide, and one ton from dental uses including the release of mercury used in fillings of people who are cremated (Raloff, 1994b). Other common small scale sources include the disposal of dry cellbatteries and other electrical equipment. (Mercury levels in both paints and
batteries have been decreasing over the past years, partly through regulation
and partly through consumer preference.) The use of mercury compounds in agricultural and lumber fungicides, and its use in primitive gold extraction in the Amazon are possibly large but diffuse semi-industrial sources (Pfeiffer,1988). Finally the small amount of mercury present in motor fuel and
lubricating oils may be a significant and widespread source (Olmez, 1995).The physical size of the sources is not as critical in determining the fate of the mercury emissions as the chemical and physical form of the emissions. While many of the difficulties associated with measuring total mercury have been solved, the speciated measurements of mercury sources continues to be
problematic and rare despite the fact that this information is critical in
determining mercury's short and long range fate. Part of the difficulty in
making speciated measurements is the volatility of mercury which creates
problems of inter-species conversion during sampling periods. Generally
speaking, sources emit mostly gaseous elemental mercury. If significant
chlorine is present such as in incinerators, paper mills, and chlor-alkali plants a sizable fraction of mercury can be emitted as HgC12 which is volatile, butalso highly soluble. The amount of soluble mercury present in a plant's
emissions is important both in terms of the mercury's ultimate fate, and in
terms of the ability of current clean-up technologies to remove it from flue gasses. A pilot scale coal plant run by EPRI achieved almost total capture ofionic mercury using an electrostatic precipitator followed by wet limestone
flue gas desulphurization (Moore, 1994), though only a small fraction of theelemental mercury was removed. The proportion of ionic to elemental
mercury however varies with coal type, plant design and operation, and
location along the flue gas path. Central sewage facilities may be a significant source of organic mercury such as CH3HgCl and (CH3)2Hg (Soldano, 1975).The mercury likely enters the facilities as inorganic mercury having been
previously ingested and excreted by humans. The emission levels vary
widely and are dependent on the specific biological activity present and the population load on the facility.The other important characteristic concerning mercury emissions from a specific source is the percent mercury associated with airborne particulates
and also the size distribution of those particulates. As will be discussed
shortly, an aerosol's size drastically affects its atmospheric range (i.e. coarseparticles settle locally, while fine ones can travel hundreds of miles).
Measurements very close to the stack of a coal-fired power plant near Oak Ridge Tennessee indicate that mercury particulate emissions may be as high as 9% of the total, but drop to 3% and then 1% at seven and twenty-two kilometers respectively (Lindberg, 1980); 1 - 2% particulate is a usual ambientlevel. The fraction of mercury associated with particulates is also important because of how it affects control strategies. Emissions of particulates from coal
plants for example are usually controlled through the use of electrostatic
precipitators (ESP) and/or fabric filters which effectively reduce trace metalconcentrations in the plant's effluent.
The reduction in the mercury
emissions for these systems vary widely (0 - 60%) depending on the amount
of particulate mercury and the specific placement and temperature of the
control systems (Moore, 1994).2.2 Atmospheric Transformations
Atmospheric mercury may be operationally defined as existing in three states based on the primary mechanism by which it is removed from the air.
Particulate mercury is removed by gravitational settling or Brownian
diffusion depending on its size, or by inclusion into wet deposition as
insoluble species, gas phase mercury is removed by diffusion and surface
adsorption, and soluble mercury is removed by wet deposition. Because these removal processes occur at very different rates, the lifetimes and hence spatial importance of the associated mercury species are also very different. Asmentioned above, the settling of atmospheric particulates is dependent
almost entirely on their size. Further, though some solid phase reactions
have been identified, these particulates can generally be regarded as
chemically inert (Seigneur, 1994). Physically, the two changes which
particulate mercury can make are the desorption of vapor phase mercury, and
the inclusion of particulates into precipitation by either nucleation or
scavenging: the latter of these will be covered in the next section, 2.3
Atmospheric Fate. The physical loss of mercury from aerosols has been
inferred from measurements within the plume of a coal-fired power plant by
Lindberg (Lindberg, 1980). In this study the ratio of vapor phase to particulate mercury increased from eleven at 0.25 km downwind from the stack to 100 at 22 km. Total suspended particulates were also measured to compensate fordiffering dispersion rates between the particulates and the vapor phase
mercury. At the distance of 22 km the vapor phase to particulate ratio was thesame as for ambient samples at the same location indicating that further
conversion was unlikely. Though more study is perhaps necessary, one mayassume that particulate mercury behaves as a conserved species in the
atmosphere. Indeed this fact is put to use in the trace metals in airborne particulate study which the ER&R lab is also conducting.
What really drives the atmospheric part of the mercury cycle are the chemical reactions that make it more or less available for deposition, and the most important changes are the reduction reactions which convert elemental
mercury into soluble ionic mercury. This can be seen by comparing the
typical gas and liquid-phase concentrations of Hg(0) and Hg(II) (the liquid phase Hg(0) concentration is calculated by means of Henry's law (Seigneur,1994).
Table 1. Typical concentrations of mercury species in the atmosphere. Mercury Typical gas-phase Typical liquid-phase
species concentration (ng/m3) concentration (ng/L)
Hg(0) 2- 5 6 - 27 x 10-3
Hg(II) 0.09 - 0.19 3.5 - 13.3
The vast difference in concentrations of the two species in both media is of course due to solubility differences; what is really important however is the equally large difference in the atmospheric lifetime of the two. Elemental mercury has an atmospheric lifetime of about one year (as has already been
mentioned), while aqueous mercury has a tropospheric lifetime on the order
of days (Slemr, 1985). Thus Hg(0) may be thought of as a reservoir for the production of short-lived Hg(II) by various oxidation reactions. There are of course a large number of reactions, both gas and aqueous phase, oxidation andreduction. Table 2 lists the most significant reactions and equilibria, their
estimated rate or equilibrium parameters (or the upper limit of these,
Seigneur, 1994). It does not include reactions involving organic mercury
because these compounds are not generally produced anthropogenically, and
there is no information regarding their reaction products or kinetics.
Likewise solid-phase mercury reactions are not included because the
concentrations are very low and the reaction rates are not known at room
temperature (as mentioned above particulate atmospheric mercury is
generally considered a conservative species)Table 2. Chemical reactions of atmospheric Mercury Gas-phase reactions 1. Hg°(g) + 03(g) - Hg(II)(g) 2. HgO(g) + C12(g) -* HgC12(g) 3. Hg°(g) + H202(g) -4 Hg(OH)2(g) 4. Hg°(g) + S02(g) -4 products 5. HgO(g) + NH3(g) - products 6. HgC12(g) + hv -4 products 7. Hg(OH)2(g) + hv -4 HgO(g) Aqueous-phase reactions
8. Hg°(aq) + 03(aq) - Hg(ll)(aq) + 02(aq)
9. Hg°(aq) + H202(aq) - HgO(s) + Hg2 + + H20(1) 10. Hg2 + + SO32-<-+ HgSO3(aq) 11. HgSO3(aq) - HgO(aq) + S04 2-12. HgSO3(aq) + S032- -4 Hg(SO3)22 -13. Hg(SO3)22 - HgO(aq) 14. HgC12(s) <- HgC12(aq) 15. HgCl2(aq) - Hg2+ + 2C1-16. HgC12(aq) + 2C1- +- HgC4l
Rate (cm3 / molecule second)
<8 x 10-19 <4.1 x 10⁻¹⁶ <4.1 x 10⁻¹⁶ <6 x 10- 17 <1 x 10- 1 7
slow
not available
Equilibrium or Rate 4.7 x 10 7 M-ls-1 6.0 M-ls- 1 5 x 10¹² M- 1 0.6 s- 1 1.0 x 10- 4 s- 1 0.27 M 10-14 M2 70.8 M- 2Gas/liquid equilibria Henry's law constant (M/atm)
17. HgO(g) <-> HgO(aq) 0.11
18. Hg(OH)2(g) *- Hg(OH)2(aq) 1.2 x 10⁴
19. HgCl2(q) *-* HgC12(aq) 1.4 x 10⁶
20. CH3HgCl(g) - CH3HgCl(aq) 2.2 x 10³ 21. (CH3)2Hg(g) <4 (CH3)2Hg(aq) 0.13
Solid/liquid equilibria
Solubility (gg/L)
22. 23. 24. 25. HgO HgS Hg2C2 HgC12 5.3 x 10⁴ 10 2x 10³ 6.9 x 10⁷
Although the oxidation of mercury by ozone, reaction 1, was first
identified by P'yankov in 1949 it can be seen that the rates for the gas-phase
reactions (1-7) are only known as upper bounds due to the difficulty in ruling out surface effects in lab scale experiments. Reaction 2 is included primarily due to its importance in creating soluble mercury within the hot stack gassesof sources containing both mercury and chlorine such as incinerators.
Aqueous-phase reactions are much more critical, with the wet oxidation of
mercury by ozone, reaction 8, being by far the most important pathway for the removal of elemental mercury from the troposphere (Iverfeld, 1986). Though the concentration of HgO(aq) is extremely low, as it is removed by oxidation it is replaced by Hg0 entering from the gas-phase. The kinetics of this gas toaqueous dissolution are not well characterized, but as a heuristic model it
may be considered a rapid process. It has been noted that the solubility of Hg0is enhanced by the presence of 02 and low pH in rain (Lindberg, 1986). The
aqueous-phase oxidation of mercury by ozone may thus be thought of as a
chemical pump which takes mercury from the air where it is present as a gas and deposits it into water droplets as the soluble species Hg(II).Because these reactions occur in rain, cloud, or fog water the actual
rates at which they proceed in the atmosphere depends on the air's liquid
water content which ranges from 10-4 to 1 g/m3 (the reactions can also takeplace in the moisture associated with hygroscopic aerosols). However, this fact also means that the oxidized mercury is then in a phase which is directly deposited to the ground over a relatively short time scale. It is also worth noting that all of the information necessary to evaluate the importance of this
reaction in the field will be available after this project is completed.
Atmospheric ozone is routinely measured at NYSDEC sites, the Henry's law
constants for ozone and mercury can be used to calculate their aqueous-phase concentrations, and the concentration of the reaction's product, soluble Hg(II) in rain waters will soon be available.Balancing the oxidation of elemental mercury by ozone is the
reduction of mercury(II) by sulfite ions (S0
32-) shown in the successive
reactions 10 - 13. The presence of HC1 in the atmosphere stabilizes the Hg(II) by complexing it as HgC12, with HgCl4- only occurring at the high chlorine
levels present in the oceans. Recent computer simulations of atmospheric
mercury chemistry (Seigneur, 1994) indicate the sensitivity of the system to
several key variables, i.e., liquid water content, pH, SO02 concentration, andHC1 concentration. Computed Hg(0)/Hg(II) ratios range from 10 to 106 and the gas/liquid ratios for Hg(II) were from 3.5 x 10⁻³ to 36 for various realistic values of the parameters. However, because of the uncertainty of many of the equilibrium and rate parameters, and the scarcity of field measurements of all the necessary species, it is not clear how accurate these figures are.
2.3 Fate
As mentioned above none of the mercury species present in the
atmosphere are at levels where they are of direct concern; the only reason tomeasure their presence and study their interactions is to better understand
their deposition and transfer to the biosphere. Atmospheric deposition is
usually divided into dry and wet deposition, with wet deposition further
divided into rainout, which includes various in-cloud processes, and
washout, which is the below-cloud process of scavenging by falling
precipitation.
Dry deposition refers to the transfer of gaseous and particulate airborne
material to the earth's surface and its subsequent removal from the
atmosphere. It can be thought of as having three distinct stages. First there isthe aerodynamic stage which involves the turbulent diffusion and/or
gravitational settling through the bulk of the atmosphere. This is followed bythe diffusion of the material within the laminar sublayer directly adjacent to
the surface. Though this layer may be only 0.1 mm thick, action here candetermine the overall rate of deposition. Finally there is transfer of the
material to water, soil or vegetation at the surface. This final stage is verylocation and species specific, non-reactive gasses for example may not
undergo dry deposition at all because they are not absorbed at the surface,particulates are considered to have deposited once they reach the surface.
Because of the complexity of these processes dry deposition is empiricallydetermined and expressed as a proportionality constant between the
atmospheric concentration of a material and its vertical flux; this is called thedeposition velocity.
Dry deposition rates for aerosols are very sensitive to the particle's size.
Large particles (> 20gm) deposit mainly by gravitational settling, while very
small particles (< 0.lgm) behave aerodynamically like gasses and are
governed by Brownian diffusivity. Between 0.1 and 1.0 gm particles fall in avelocity trough, not being affected very much by either of these two
mechanisms. There is considerable uncertainty in the deposition velocity for these sizes though it is probably in the range from 0.1 to 1.0 cm/sec, with windvelocity and surface roughness being locally variable parameters which may
determine the actual rate.It should be mentioned here that on a weight per volume basis
aerosols tend to have a bi-modal distribution, with one peak in this low
deposition region and one around 10gm (Seinfeld, 1986). Part of the fine
fraction peak may be due to the lower settling rates, but it is also somewhat
due to the fact that anthropogenic particulate emissions are usually in this
size region. The ER&R lab's particulate sampling program takes advantage ofthis by collecting aerosols smaller than 2.5gm and between 2.5 and 10gm
separately. The fine fraction samples represent largely anthropogenic and
long-range influences, and the coarse fraction particles are more often locally produced and crustal material.Both the mechanisms and rates associated with dry deposition of
gas-phase mercury are still somewhat uncertain. In general non-reactive gas
species such as mercury have low deposition rates due to the difficulty with which they are chemically absorbed by soil, water and vegetation at the earth's surface. Elemental mercury is believed to be absorbed by vegetation directly through the pores of leaves, or stomatally, especially near sources where theHg
0level may be high or through interaction with dew-saturated surfaces
(Lindberg, 1992). This uptake is likely regulated by the ambient concentration
and its relation to a deposition/emission compensation point, which is the
atmospheric concentration above which the leaves will absorb mercury andbelow which they will emit mercury, resulting in a negligible net uptake.
Though the specific values for this deposition mechanism are not well
established, it appears that the compensation point for many species is higherthan regional ambient concentrations and thus long-term dry deposition rates
may be comparable to those for wet deposition (Iverfeldt, 1991).Wet deposition of particulate mercury occurs by two processes, either
through nucleation and subsequent rainout, or by the below-cloud
scavenging of falling precipitation. The difference between the two is not of great practical importance though unless the sources of the particulates differ.Further, it is usually impossible to distinguish between them, although
current research in the ER&R lab using cloud and rain samples from the
summit and base of Mount Washington (New Hampshire) may be able to
separate these. A more significant distinction in the evaluation of mercury inwet deposition is the separation of inert, particulate mercury and reactive,
soluble mercury, because these originate from different atmospheric species and possibly different original sources. This has been done by Fitzgerald et al. (Mason, 1992) for samples collected over the remote Pacific and Wisconsin.Particulate mercury in the rain was determined as the difference between
total and reactive measurements, and though it makes up only a few percentof total atmospheric concentration it contributed about half of the deposited
mercury. The direct measurement of particulate mercury in wet deposition
samples is also being studied in the ER&R lab, but no actual measurements
have been made yet.A practical distinction may thus be made among four types of deposited mercury on the basis of species, sources, scale and mechanisms. First there is elemental mercury which is deposited directly to the biosphere by its uptake through the pores of vegetation. This is the least well understood in terms of its importance and mechanisms, it is certainly dependent on location, and its magnitude will rise or fall slowly as the long range concentration of
vapor-phase mercury changes both spatially and temporally. If high concentrations
are present downwind of large sources this type of deposition may also have significant local effects. Vapor-phase mercury can also be deposited by itsconversion to the soluble Hg(II). Though this mercury is from the same
sources as the first example, and thus is affected by long term trends and longdistance sources, its deposition can be affected by short term, local
atmospheric conditions such as moisture content, pH, and ozone, chlorine
and SO
2concentrations. Indistinguishable by analysis from this converted
Hg0 is the deposition of Hg(II) which was originally emitted in this form. The distinction between the two is that mercury emitted in a soluble form has an
atmospheric lifetime of only a few days, and so is deposited locally or
regionally. The identification of other species in the deposition samples orthe prior knowledge of source speciation is necessary to determine the
importance of this type of deposition on a case by case basis. Finally there isthe deposition of particulate mercury (possibly subdivided into wet and dry
processes). This may be a local problem if the particles are very coarse, though the measurement of high concentrations of non-reactive species in rain overthe remote Pacific indicates that the phenomenon also has regional and
global implications.Once mercury has reached the ground, if it is not re-emitted to the air, what happens to it is no longer relevant within the scope of this work. But
because the only reason we are concerned about mercury is its effect on
humans and animals through the food chain, a brief description of the rest of its biological and chemical cycle is in order. The mercury species of interest because of its toxicity and ability to bio-accumulate is methyl mercury CH3Hg.Though it is present in fish and in fresh and ocean waters, it is not deposited
there to any great extent from the atmosphere or introduced by runoff.
Methyl mercury is instead produced locally by sulfate-reducing anaerobic
bacteria. The activity of these organisms can be increased by the presence of sulfate and low pH (both products of acid rain, Fitzgerald, 1993). Part of the pH effect might be due to the increased reduction of Hg(II) to HgO underhigher pH conditions; this mercury is then emitted back to the atmosphere.
As one moves up the food chain from these micro-organisms, the methyl
mercury concentration increases until it is on the order of three million timesmore concentrated in the flesh of large fish than it is in the surrounding
water. Failing the loss of the mercury to the atmosphere or the consumption
of mercury laden fish by birds or mammals, the mercury is finally deposited
to the underlying sediments. Whether the mercury in these sediments isre-released is largely an unanswered question, but effects such as this could
prolong the existence of highly contaminated fish long after any reduction in atmospheric or other input to the system.2.4 Overall Cycle and Budget
It should be appreciated from the previous sections that there is a
considerable amount of uncertainty in almost every aspect of atmospheric
mercury's pathway, from its sources to its final consumption (and also withregard to its health effects at low levels, which were not covered).
Nevertheless, estimates of mercury's concentrations and fluxes are becomingmore reliable. In 1985 global fluxes reported in a review by Lindqvist
(Lindqvist, 1985) gave uncertainty ranges up to a factor of 17 for total
emissions and deposition. At a recent international expert panel convened byEPRI (Expert Panel, 1994) there was some disagreement about current
uncertainty bounds, but it is probably on the order of a factor of two or better. This uncertainty is possibly large enough to call into question the validity of
any specific conclusions derived from current atmospheric models.
However, the overall form of these models and the general sizes of the
reservoirs and fluxes are probably understood well enough to both provide
insight into the relative importance of the various mechanisms, and to point out the areas which are in need of further study.A simplified local and regional mercury cycle is shown schematically
in Figure 1. Looking at the model from the source end, three forms of
anthropogenic emissions are shown, elemental Hg
0, particulate Hg, and
soluble Hg(II). Though some sources emit other species as well, these are the major types and are illustrative of the variety of processes in the cycle. Most sources emit primarily elemental mercury (95%), which because of its lowsolubility and high vapor pressure is not deposited locally, but combines with
the global background mercury. The conversion of global elemental mercuryto soluble mercury is shown by the most prevalent mechanism, the wet
oxidation by ozone. On the other hand, if the source's emission height is lowor atmospheric conditions create an inversion which brings a high
concentration of mercury into contact with local vegetation, dry uptake of thegas-phase could result, but this process is not currently well quantified.
Coarse particulate mercury will deposit locally, but finer particulates will
combine with the regional and global background. The removal of these
fines by wet deposition is clearly dependent on meteorological conditions;
they may be removed locally or be transported thousands of kilometers.
Soluble mercury, which can make up a significant portion of the total
emissions is generally deposited on a local scale.The most important feature of the local and regional mercury cycle is
that the location where the mercury deposits is largely dependent on the
chemical and physical form in which it is emitted. The total amount of
mercury coming from a stack is not a sufficient measure for determining its effects. Accurate speciated measurements are necessary because even though soluble or particulate mercury may make up a small fraction of a plant'soutput they may be the most critical portion in terms of local and regional
impacts. Further, regulations and control technologies based on total
mercury reduction may provide little or no local benefits if only long range species are reduced.Global Input
Hg0 [1-5ng/m 3]
Figure 1. Local and regional atmospheric mercury cycle. Some typical
concentrations are show in brackets. 'Natural' emissions include the
re-emission of accumulated mercury from historical anthropogenic activity.From the receptor end of the cycle, several other features are evident, or should be mentioned. First, as with mercury sources, a simple measure of the presence of mercury does not provide very much information about the path the mercury has taken. Even a measurement of soluble Hg(II) in wet deposition does not indicate whether a local source of this species or the oxidation of HgO is responsible. The deposition and evasion fluxes of HgO are