Detecting and Quantifying Bus Operation
Impedance: the Balance between Reliability and
Speed
by
Maud Sindzingre
B.S. in Engineering, Ecole Centrale Paris (2017)
Submitted to the Department of Urban Studies and Planning
in partial fulfillment of the requirements for the degree of
Master of Science in Transportation
at the
MASSACHUSETTS INSTITUTE OF TECHNOLOGY
September 2019
c
○ Massachusetts Institute of Technology 2019. All rights reserved.
Author . . . .
Department of Urban Studies and Planning
July 2, 2019
Certified by . . . .
Nigel H. M. Wilson
Professor of Civil and Environmental Engineering, MIT
Thesis Supervisor
Certified by . . . .
Haris N. Koutsopoulos
Professor of Civil and Environmental Engineering, Northeastern
University
Thesis Supervisor
Certified by . . . .
Jinhua Zhao
Edward and Joyce Linde Associate Professor of City and
Transportation Planning, MIT
Thesis Supervisor
Accepted by . . . .
Christopher P. Zegras
Associate Professor of Transportation and Urban Planning
Committee Chair, Department of Urban Studies and Planning
Detecting and Quantifying Bus Operation Impedance: the
Balance between Reliability and Speed
by
Maud Sindzingre
Submitted to the Department of Urban Studies and Planning on July 2, 2019, in partial fulfillment of the
requirements for the degree of Master of Science in Transportation
Abstract
This thesis explores the phenomenon of bus impedance, defined as a slowing down of bus operations for customers. Impedance can stem from an overemphasis on relia-bility to the detriment of speed in bus operations. Public transport agencies aim at achieving the best balance between speed and reliability in their bus operations be-cause such a balance benefits their customers who want to arrive at their destinations quickly and reliably, and potentially reduces the cost of operations. Impedance can result from misaligned interests of stakeholders, for instance if the agency provides financial incentives only for reliability.
Impedance manifests itself through held and/or slow buses aimed at regulating the service but slowing it down as a consequence. A data-driven approach investigates the manifestations and the detection of impedance using the London bus network as a case study. Analyses include the assessment of the impact of changes in contract specification, the comparison between bus and Google API traffic speeds, and the use of holding announcements on the bus network. Taking the trip as the unit of analysis, the dwell, travel, and movement times of trips, among others, contribute to understanding the route behavior and detecting times with possible impedance. Models of the total dwell time per trip using the number of passengers and stops made per trip as explanatory variables are proposed, which can be used to estimate the dwell time theoretically needed based on the passenger activity.
Building on these analyses, this thesis proposes two indicators to detect impedance at the trip-level in the form of holding. A decision-support tool intended for the bus operations management teams comprises (1) the correlation between the dwell time and the dwell time allowance and (2) the proportion of trips with a high value of the ratio of the actual dwell time to the theoretically needed dwell time for the trip. This tool is designed to extract information about route performance and could be used to supplement the expertise of the bus management teams in making scheduling and operational decisions.
Thesis Supervisor: Nigel H. M. Wilson
Title: Professor of Civil and Environmental Engineering, MIT Thesis Supervisor: Haris N. Koutsopoulos
Title: Professor of Civil and Environmental Engineering, Northeastern University Thesis Supervisor: Jinhua Zhao
Title: Edward and Joyce Linde Associate Professor of City and Transportation Plan-ning, MIT
Acknowledgments
I would like to thank my advisors, professors Nigel Wilson and Haris Koutsopoulos, for their constant guidance through this research, for sharing their rigorous approach to research questions, for their confidence, and for their help and patience editing this thesis and other documents.
This research has been made possible by Transport for London and I would like to thank Angela Martin for her continuous help and support during this project, for sharing her expertise about London Buses, and always being able to find the right information. I would like to thank Andrew Hyman for his time coordinating the project, giving me feedback, and promoting my research within TfL. I would also like to thank Robert Duff and Sergei Polomskikh for their help and insight concerning the technicalities of this research. Many thanks to Dale Campbell, Lauren Sager Weinstein, Janet Brown, Alex Phillips, Alex Moffat, Peter Reucroft, and Louis Simpson for their help and insight.
I would also like to thank Walter Weber, CEO of the company netBI, for dis-cussing their method to detect slack in schedule-managed routes, Rabi Mishalani for sharing his perspective and insight on this research, and Gabriel Sańchez-Martińez for interesting discussions about bus impedance and TfL. I am also grateful to Juan Carlos Muñoz for discussing his work on bus speed and reliability.
I would like to thank the Transit Lab members for their ideas and contributions to this research and for all the very valuable exposure to the transit industry they provided during my time at MIT. Thank you to my lab mates and batch mates for the time spend together and the camaraderie.
I would also like to thank my family and my close ones for their love and support during my time at MIT.
Contents
1 Introduction 17
1.1 Motivation: Balancing Speed and Reliability in Bus Operations . . . 18
1.1.1 Definition of Bus Commercial Speed . . . 19
1.1.2 Definition of Bus Reliability . . . 19
1.1.3 Schedule-managed and Headway-managed Bus Routes . . . . 21
1.1.4 Challenge of Maintaining Reliable Service . . . 21
1.1.5 Use and Impact of Regulatory Actions to achieve Reliability . 22 1.1.6 Passenger Perception of Regulatory Actions . . . 24
1.2 Stakeholders in Bus Operations . . . 24
1.2.1 Organizational Forms of Public Transport . . . 25
1.2.2 Public Transport Authority . . . 27
1.2.3 Operating Companies . . . 27
1.2.4 Passengers . . . 28
1.3 Definition of Impedance . . . 29
1.3.1 Stakeholder Viewpoints on Impedance . . . 29
1.3.2 Regulating Actions . . . 30
1.3.3 Analysis Levels of Impedance . . . 31
1.3.4 Chosen Definition of Impedance . . . 32
1.4 London Bus Network . . . 32
1.4.1 London Buses in Numbers . . . 33
1.4.2 Structure of Transport for London . . . 33
1.4.3 High- and low-frequency routes. . . 34
1.4.4 The outsourcing of bus operations . . . 35
1.5 Objectives and Approach . . . 35
1.5.1 Objectives . . . 35
1.5.2 Approach . . . 36
1.6 Thesis Organization . . . 36
2 Literature Review 39 2.1 Balance between Reliability and Speed . . . 39
2.1.1 Origins of Unreliability . . . 39
2.1.2 Bus Service Reliability . . . 40
2.1.3 Control Strategies to Improve Reliability . . . 40
2.1.4 Reliability and Speed . . . 41
2.3 Modeling Bus Dwell Time at the individual stop . . . 43
2.4 Detecting Slack in Schedule-managed Routes . . . 43
2.5 Conclusion . . . 44
3 Transport for London Bus Network and Concerns about Impedance 45 3.1 The Relationship between TfL and Bus Operating Companies . . . . 45
3.1.1 Tendering Process . . . 45
3.1.2 Contracts . . . 46
3.1.3 Scheduling . . . 51
3.1.4 Vehicle requirements . . . 53
3.2 Controlling Bus Operations . . . 54
3.2.1 Controller’s role . . . 54
3.2.2 Performance Monitoring by TfL . . . 55
3.3 Impedance on the London Bus Network . . . 55
3.3.1 Concerns about Possible Impedance . . . 55
3.3.2 Additional Bus funded by an Operating Company . . . 59
3.3.3 Setting the Schedule . . . 61
3.3.4 Possible Side-Effect of correcting an Overemphasis on Reliability 63 3.4 Conclusion . . . 64
4 Analyses 65 4.1 Introduction . . . 65
4.2 Data . . . 67
4.2.1 Automatic Vehicle Location (AVL) data . . . 67
4.2.2 Automatic Fare Collection (AFC) data . . . 69
4.2.3 Records of on-Board Announcements . . . 70
4.3 Route Selection . . . 71
4.4 Exploratory Analyses . . . 72
4.4.1 Contract Changes on Route 38 . . . 75
4.4.2 Traffic versus Bus Speeds Comparison using the Google API . 80 4.4.3 On-board Announcements . . . 85
4.5 Trip-level Analyses . . . 96
4.5.1 Trip-level Times . . . 96
4.5.2 Modeling the Dwell Time . . . 121
4.6 Conclusion . . . 132
5 Detecting Impedance 133 5.1 Tool Design . . . 134
5.1.1 Correlation between the Dwell Time Allowance and the Actual Dwell Time . . . 135
5.1.2 Ratio of the Actual Dwell Time to the Theoretical Dwell Time 137 5.1.3 Interpreting the Indicators . . . 139
5.1.4 Remark on the variables selected to design the tool . . . 139
5.2 Application . . . 142
5.2.2 Threshold value of the ratio R of the actual dwell time to the
theoretical dwell time . . . 143
5.2.3 Results . . . 143
5.2.4 Interpretation . . . 144
5.3 Conclusion . . . 161
6 Summary and Conclusions 163 6.1 Summary . . . 163
6.2 Limitations and Recommendations for Future Research Directions . . . 166
List of Figures
1-1 Distribution of running times and illustration of the Reliability Buffer
Time. . . 20
1-2 Resulting loss of time induced by regulating a headway-managed route. 23 1-3 Two forms of organizations in public transport (van de Velde, 1999). . 25
1-4 The central planning and tendering organizational form (van de Velde, 1999). . . 26
1-5 Relationships between stakeholders in bus operations. . . 27
3-1 Financial payments for high-frequency routes. . . 51
3-2 Running time, layover time, and cycle time. . . 52
3-3 Evolution of the network commercial bus speeds at Transport for Lon-don (Transport for LonLon-don, 2019). . . 56
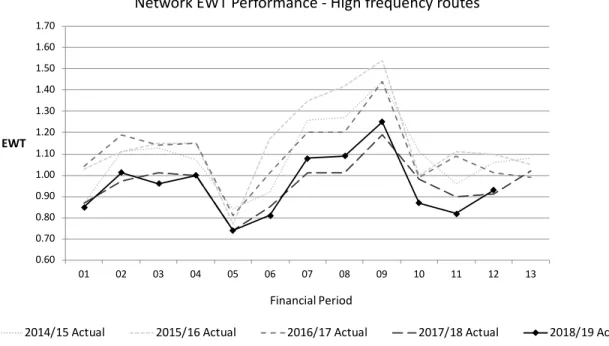
3-4 Evolution of the network Excess Wait Time of high-frequency routes. 58 3-5 Evolution of the network On-Time performance of low-frequency routes. 58 3-6 Running time distribution with and without impedance. . . 62
4-1 Manifestations of impedance and data requirements. . . 66
4-2 Comparison of TfL’s AVL data and SDG’s survey data (Steer Davies Gleave, 2015). . . 69
4-3 Routes 38 and 328. . . 73
4-4 Route 36. . . 74
4-5 Evolution of the running time by month of Route 38 during the PM peak. . . 78
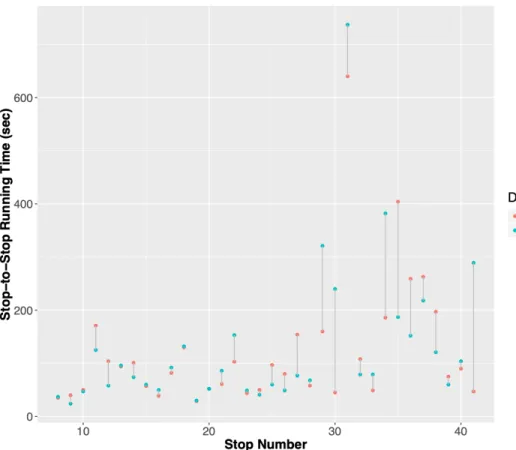
4-6 Stop-to-stop comparison of the AVL running times and the API results, Route 38, from Clapton Pond (June 14, 2018). . . 82
4-7 Trip comparison of the AVL running times and the API results, Route 38, from Clapton Pond (June 14, 2018). . . 83
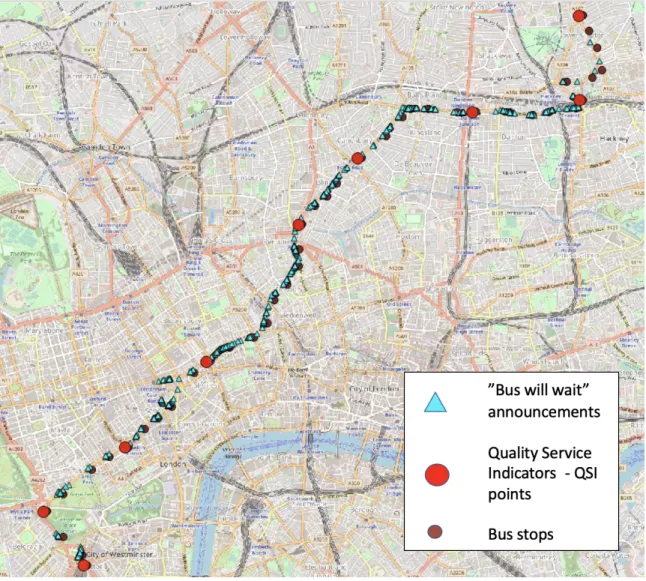
4-8 Stops and QSI points (highlighted) for Route 38, from Victoria Station. 86 4-9 Spatial distribution of BWW announcements on Route 38, both direc-tions (10 days in January 2018). . . 87
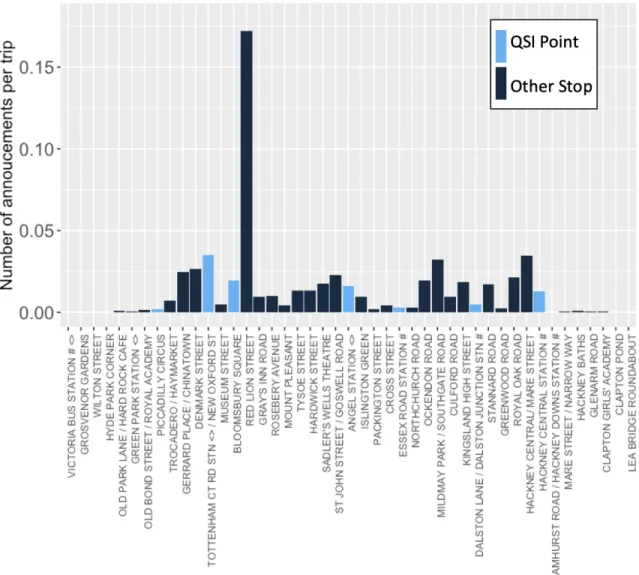
4-10 Distribution of BWW announcements by stop on Route 38, from Vic-toria Station (10 days in January 2018). . . 88
4-11 Distribution of BWW announcements by stop on Route 38, from Clap-ton Pond (10 days in January 2018). . . 89
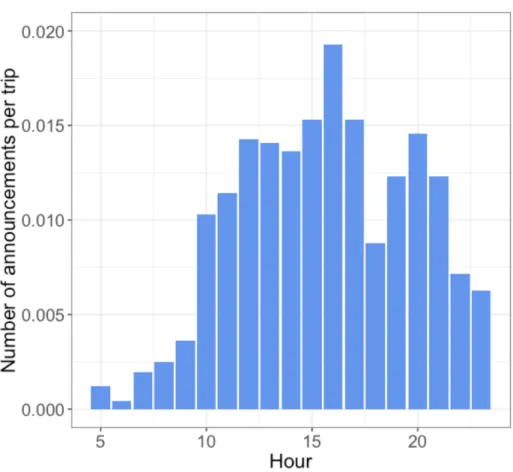
4-12 Distribution of BWW announcements by hour on Route 38 in both directions (10 days in January 2018). . . 90
4-13 Time Space diagram for Route 38, from Victoria Station. . . 94
4-14 Scheduled travel times, total travel times, and total movement times for Route 38, from Victoria Station. . . 98
4-15 Scheduled travel times, total travel times, and total movement times for Route 38, from Clapton Pond. . . 99
4-16 Scheduled travel time, total travel time, and total movement time for Route 328, from Limerston Street. . . 100
4-17 Scheduled travel time, total travel time, and total movement time for Route 328, from Golders Green Station. . . 101
4-18 Scheduled travel time, total travel time, and total movement time for Route 36, from New Cross Bus Garage. . . 102
4-19 Scheduled travel time, total travel time, and total movement time for Route 36, from Claremont Road. . . 103
4-20 Coefficient of variation of the total travel and movement times of Route 38, from Victoria Station. . . 105
4-21 Coefficient of variation of the total travel and movement times of Route 38, from Clapton Pond. . . 106
4-22 Coefficient of variation of the total travel and movement times of Route 328, from Limerston Street. . . 107
4-23 Coefficient of variation of the total travel and movement times of Route 328, from Golders Green Station. . . 108
4-24 Coefficient of variation of the total travel and movement times of Route 36, from New Cross Bus Garage. . . 109
4-25 Coefficient of variation of the total travel and movement times of Route 36, from Claremont Road. . . 110
4-26 Dwell time allowance for Route 38, from Victoria Station. . . 113
4-27 Dwell time allowance for Route 38, from Clapton Pond. . . 114
4-28 Dwell time allowance of Route 328, from Limerston Street. . . 115
4-29 Dwell time allowance of Route 328, from Golders Green Station. . . . 116
4-30 Dwell time allowance of Route 36, from New Cross Bus Garage. . . . 117
4-31 Dwell time allowance of Route 36, from Claremont Road. . . 118
4-32 Influential observations using the Cook’s distance. . . 125
4-33 Influential observations using the Cook’s distance. . . 126
4-34 Fitted versus actual dwell times for Route 36. . . 128
5-1 Dwell time allowance versus actual dwell time, Route 36, from Clare-mont Road, 4-7am. . . 136
5-2 Dwell time allowance versus actual dwell time, Route 36, from Clare-mont Road, 4-6pm. . . 137
5-3 Ratio of the actual dwell time to the theoretical dwell time, Route 36, from Claremont Road, 4-6 pm, with an example of threshold equal to 1.25. . . 138
5-4 DT versus DTA for Route 38, from Clapton Pond. . . 146
5-5 Ratio DT / TH_DT, Route 38, from Clapton Pond. . . 147
5-7 Ratio DT / TH_DT, Route 38, from Victoria Station. . . 149
5-8 DT versus DTA for Route 328, from Golders Green Station. . . 151
5-9 Ratio DT / TH_DT, Route 328, from Golders Green Station. . . 152
5-10 DT versus DTA for Route 328, from Limerston Street. . . 153
5-11 Ratio DT / TH_DT, Route 328, from Limerston Street. . . 154
5-12 DT versus DTA for Route 36, from New Cross Bus Garage. . . 156
5-13 Ratio DT / TH_DT, Route 36, from New Cross Bus Garage. . . 157
5-14 DT versus DTA for Route 36, from Claremont Road. . . 158
List of Tables
1.1 Organization of the teams responsible for bus reliability (Transport for
London, 2019). . . 34
1.2 High- and low-frequency routes in London. . . 35
3.1 ITT content. . . 46
3.2 Tender assessment criteria based on other TfL services operated by the company. . . 46
3.3 Contract specifications. . . 47
3.4 Definitions of time windows for low-frequency routes. . . 48
3.5 Example of the performance requirements for a low-frequency route. . 50
3.6 Example of the performance requirements for a high-frequency route. 50 3.7 Time periods of bus operations defined by TfL. . . 54
4.1 AVL data. . . 67
4.2 Example Statistical Files fields. . . 68
4.3 Fields of the AFC data. . . 70
4.4 Route characteristics. . . 72
4.5 History of Route 38 contract (Transport for London, 2018). . . 76
4.6 Evolution of the contract specifications of Route 38. . . 77
4.7 Comparison of the average running times before and after the contract change. . . 79
4.8 Relevant and effective announcements on Route 38. . . 93
4.9 Percentage of trips where slack >0 by route, direction, and time period.104 4.10 Means, medians, and standard deviations of the dwell time allowance (DTA) per route, direction, and time period. . . 119
4.11 Dwell time model estimates at the trip-level for Routes 38, 328, and 36. 127 4.12 Dwell time model estimates at the stop-level (Steer Davies Gleave, 2015).129 5.1 Schedule, regulation, and impedance. . . 133
5.2 Indicators of the decision-support tool. . . 135
5.3 Joint interpretation of tool indicators. . . 140
5.4 Color and significance codes for the tool results. . . 143
5.5 Tool results for the three routes during the AM interpeak. . . 144
5.6 Tool results for Route 38. . . 145
5.7 Tool results for Route 328. . . 150
Chapter 1
Introduction
Public transport agencies face the constant challenge of balancing speed and reliability in their bus operations. Indeed, to assess the quality of service, public transport agencies take the point of view of the end-users: the riders. For riders, two important criteria for good service are the speed of the journey and its reliability (Muñoz, 2019). Riders prefer the fastest trips from origin to destination, with consistent wait times and on-time arrivals (Transit Cooperative Research Program, 2019). However, with their expertise, public transport agencies know that running fast and reliable bus service is an operational challenge because speed and reliability usually do not work naturally together. As a matter of fact, high speeds tend to increase the running time variability, mainly due to external and often unpredictable operating conditions such as congestion, passenger loads, and traffic lights, among others. High running time variability tends to increase the mean and variability of passenger wait times (Sańchez-Martińez, 2013). Higher speed can also create and enlarge gaps between vehicles. In contrast, lower speeds enable more control over the operations at the route-level and tend to allow for more consistent wait times. Small disruptions can be corrected more easily. As a result, higher speeds tend to be associated with worse reliability and better reliability with lower speeds. Thus, speed and reliability tend to be negatively correlated.
Public transport agencies continuously face the operational challenge of provid-ing the best balance between speed and reliability with the end goal of deliverprovid-ing the best service to their customers. The stakes of this challenge are high because a disequilibrium in this trade-off can have significant consequences: for example, cus-tomer dissatisfaction due to the degraded service quality, financial repercussions with a loss of patronage for the agency, and increased operational costs due to less efficient operations requiring more vehicles and driving time.
In specific cases, there may be a concern that the reliability aspect of performance is over-emphasized. Indeed, because public transport agencies monitor both the speed and reliability, some agencies have developed and implemented specific metrics to quantify the reliability of their service (Transit Cooperative Research Program, 2019). Sometimes, agencies encourage good reliability, with financial incentives for example, whereas they do not incentivize fast journeys. Such over-emphasis on reliability can
lead to slower speeds on the network due to the opposite effects of speed and reliability: this phenomenon is called impedance. Public transport agencies currently do not have an assessment methodology to flag the existence of impedance and quantify it when suspected. This work proposes such a methodology to detect and quantify the impedance phenomenon that is the result of an imbalance in the trade-off between speed and reliability in favor of reliability.
Using the bus network of London as a case study, this thesis takes a quantitative approach to investigate the existence of an imbalance between speed and reliability and detect impedance. Bus operations at Transport for London, the public transport agency of London, provide a real-life scenario where there may be possible over-emphasis on reliability to the detriment of speed. Transport for London outsources its bus operations to private companies and uses financial bonuses and penalties to encourage reliability. The combination of good reliability and a decrease in average bus speeds on the network combined with customer complaints about slow buses raised this concern of potential impedance.
This work develops a decision-support tool for bus operations planning teams. The decision-support tool would help public transport agencies to better understand the balance between speed and reliability in their bus operations. Combined with expert knowledge from the agency staff, the tool could help mitigate impedance by, for instance, speeding up the schedule when possible. The tool would also provide in-formation on operations to the agency to communicate with the operating companies on how to improve the balance between speed and reliability.
Taking a data-driven approach using automatic vehicle location (AVL) data and smart card (AFC) data, this thesis presents several analyses investigating a possible over-emphasis on reliability in bus operations. These analyses highlight interesting variables that can be derived from available data. The approach taken is to define suitable and meaningful metrics assessing the balance between speed and reliability. These metrics are intended to be applied to the network to detect routes and time periods where speed may be sacrificed in the interest of reliability. This work also discusses potential applications of the tool to mitigate impedance.
1.1
Motivation: Balancing Speed and Reliability in
Bus Operations
For public transport passengers, speed and reliability are two of the critical criteria that define the service quality (Muñoz, 2019). Although customers want fast and reliable service, speed and reliability are often inversely related as high levels of relia-bility are more easily achieved at a slower speed. Thus, the higher the reliarelia-bility, the lower the speed and vice versa. As a result, since speed and reliability do not tend to co-exist, public transport agencies face a constant operational challenge to achieve the best possible balance between speed and reliability to deliver the best service to their customers.
This section defines key terms and covers several important elements. This section: 1. defines bus commercial speed
2. defines reliability
3. defines timetable- and headway-managed routes 4. explains the challenges of maintaining reliable service
5. explains the regulatory actions used to maintain reliability and their impact on bus speeds
6. explains the passenger perception of regulatory actions
7. concludes on the importance of the balance between speed and reliability.
1.1.1
Definition of Bus Commercial Speed
The commercial bus speed can be defined as the average speed that passengers expe-rience including stops (Daganzo and Pilachowski, 2011). Thus commercial speed is the total distance divided by the total travel time from origin to destination, where the total travel time is the sum of the movement time of the bus between stops and the dwell time at stops. Most of the time, the bus commercial speed is lower than the traffic speed due to the dwell times at stops; however, bus priority measures such as bus lanes can contribute to higher commercial speed for buses than for traffic. The following example illustrates how the bus commercial speed can be lower than traffic speeds, especially without bus priority measures: a one way bus trip can be completed in 80 minutes including the dwell times at stops, while, without stops, the same bus trip could take 60 minutes from origin to destination. The computation of the bus commercial speed uses the trip duration of 80 minutes. Speed is an important criteria for customer satisfaction with bus service (Muñoz, 2019); hence it is a key variable to monitor for public transport agencies.
Moreover, monitoring bus speeds is also a top priority for safety reasons. The safety concern is shared by all stakeholders: the public agency, the operating compa-nies, their drivers, the passengers and all road users. Public agencies want to reduce the number of injuries and fatalities, operating companies would prefer to avoid col-lisions, and all road users want to be travel safely. For instance, monitoring speed so as to reduce the number of fatalities on the road is the top priority for the City of London. The Mayor’s Transport Strategy 2018 (Greater London Authority, 2018) states the aim to achieve their "Vision Zero," which entails "eliminating deaths and serious injuries from London’s transport system by 2041."
1.1.2
Definition of Bus Reliability
In order to define reliability, the Transit Cooperative Research Program (TCRP) conducted a survey of around eighty public transport agencies. The most popular
definitions of reliability refer to on-time performance, schedule adherence or headway adherence depending on the type of route. In their reliability guidebook, Minutes Matter: A Guide to Bus Transit Service Reliability, TCRP suggests that reliability can be defined by the following three components:
1. short and consistent wait times
2. consistent on-time arrivals at destinations 3. consistent travel times
Running time distribution time
0
T
MEDIANT
95 RBTFigure 1-1: Distribution of running times and illustration of the Reliability Buffer Time.
Reducing unreliability helps customers plan their travel with less uncertainty and reduce the extra time they must allow to ensure arrival at their destination at the desired time (Transit Cooperative Research Program, 2019). This extra time was defined as the Reliability Buffer Time (Uniman et al., 2010). This research relies on the availability of fare card data that include the origin and destination of individual passengers. The article uses the London Underground as a case study for computing the Reliability Buffer Time. Computed for specific origin-destination pairs for a given number of days, the Reliability Buffer Time (RBT) is defined as follow:
RBT = (95th percentile of travel time - median travel time).
Thus, reliable bus service is key to enable passengers to plan the total travel time for their journeys and reduce the buffer time needed to arrive at their destination at the desired time. Reliable service saves considerable time for customers because the buffer time effectively adds wait time, either before the in-vehicle time or at the destination, or additional in-vehicle time in case of extended journey time. Figure 1-1 illustrates a typical scenario. The passenger wants to arrive at destination at
Tdesired arrival. If the passenger only considers the median travel time Tmedian to plan its trip and departs from its origin at Tdesired arrival - Tmedian, then there is 50% chance that (s)he will arrive at the destination later than the desired arrival time. The passenger needs to take the variability of the running time into account when deciding on the departure time. Thus, if the passenger want to arrive at the destination at Tdesired arrival with a probability of 95%, the passenger should depart from its origin at Tdesired arrival - Tmedian - RBT: (s)he should include a buffer time to the median running time of the trip.
1.1.3
Schedule-managed and Headway-managed Bus Routes
It is important to distinguish between two types of bus routes to understand how reliability is perceived and managed. Timetable-managed routes are assessed based on their adherence to the schedule and headway-managed routes based on their adherence to the headway. It is important to evaluate reliability differently for high- and low-frequency routes because passengers have different expectations for these two types of routes. Passengers are assumed to arrive randomly at stops for high-frequency route so the regularity of headways is what matters for customers. For low-frequency routes, passengers are assumed to be informed of the scheduled arrival time at stops, thus the on-time performance matters.1.1.4
Challenge of Maintaining Reliable Service
In bus operations, minor disturbances on high-frequency routes can lead to long gaps between vehicles and bunching (Daganzo, 2009). Let’s take the example of a bus route without any regulation to illustrate the natural instability of operations. Consider a situation where buses are correctly spaced according to the schedule for timetable-managed routes and based on their headway1 for headway-managed routes. During the service, buses face uncertainty in their individual travel times: they could be in traffic, encounter a variable numbers of red lights, accommodate a variable number of passengers, some with reduced mobility, etc. Such events contribute to an increase in bus running time variability. Without control on a high-frequency route, a faster bus may bunch with the bus ahead and a slower bus may be overtaken by the following bus. As a result, bunches of buses can form, with bunching exacerbated by the allocation of passengers across buses. The first (slower) bus of a bunch is usually the most heavily loaded. Indeed, the first bus finds many passengers waiting at stops due to the larger-than-usual headway with the bus ahead (Newell and Potts, 1964). Due to the crowding on this bus, alighting and boarding take more time than for a less crowded bus. Both phenomena make the first bus slower. Conversely, the following buses of the bunch have lighter passenger loads and find fewer passengers at the stops due to the short headway, which makes boarding and alighting faster. This tendency further speeds up these buses. The fact that the first bus of the bunch is slower and the following ones faster reinforces the overall bunching phenomenon.
Reliability plays a very important role in waiting and journey planning for cus-tomers. Indeed, deteriorated reliability leads to higher variability of passenger wait times (Muñoz, 2019). Thus, passengers must increase their allowed travel time to arrive at their destination at the desired time with high probability. In other words, the more unreliable the service, the higher the reliability buffer time customers need to allow when planning their journey. Indeed, service unreliability increases the vari-ability of the departure time from the origin stop as well as the in-vehicle travel time due to induced variation of crowding and gaps. Service unreliability results in a higher variance of the arrival time at the destination. The tail of the distribution of the total travel time (see Figure 1-1) is shifted to the right and spreads more: the RBT increases.
Thus, reliability is against the natural tendency in bus operations and has a signif-icant impact on customer journeys by affecting their wait times, their travel times and their reliability buffer times. Therefore, delivering reliable bus service is a challenge with high stakes for public transport agencies. A solution is to control operations looking at the route comprehensively and making regulatory decisions based on real-time information.
1.1.5
Use and Impact of Regulatory Actions to achieve
Reli-ability
Public agencies have the challenge to maintain reliable bus operations. This challenge requires combatting trends that develop naturally on the network such as disruptions, long gaps in service and bus bunching. Route controllers have the task to maintain reliable service using regulatory actions. Two types of real-time regulatory actions can be defined as operational levers to improve service reliability:
∙ holding at the stop for longer than necessary to meet passenger boarding and alighting needs
∙ driving slower than traffic conditions and safety allow.
Regulatory actions (almost) always result in slowing buses down, so to achieve high reliability in mixed traffic, speed has to be sacrificed. Moreover, it is not possible to implement regulatory actions that speed up the route because speed increases stress for drivers and can result in safety concerns.
Let’s take an example to illustrate why regulating a route is very likely to slow it down. In the case of timetable-managed routes, if a bus is early, holding at the stop or driving slow are ways to maintain the timetable. Hence, this trip will take longer than it would otherwise. It results in extra time for passengers riding this bus.
In the case of headway-managed routes, consider three buses. Ideally these buses run with equal headways matching the schedule. If the first bus encounters delays that slow it down, such as traffic congestion, the two following buses will gradually catch up with it, reducing the headway between the first and the second bus. Figure
Ideal Headway Small disruption Direction of travel t = t1 Ideal Headway Small disruption t = t2 > t1
Buses slowed down
Ideal Headway
Small disruption t = t3 > t2
Loss of time
Figure 1-2: Resulting loss of time induced by regulating a headway-managed route.
1-2 shows a comparison between the situation with ideal headways and the situation when the first of the three buses is delayed due to a small disturbance. Since the first bus cannot speed up due to traffic or safety concerns such as speed limits, regulating the route inevitably leads to slowing down the following two buses. As a result the travel times of the three buses increase due to an external cause for the first bus and regulation for the following two buses.
As discussed in the previous paragraph, regulating the route is necessary for reli-able operations. Without any control, buses would naturally bunch, and the service would deteriorate. Since regulating fundamentally involves extending the travel time of one (or more) buses, maintaining a reliable service involves slowing down the route. Nonetheless, this reduction in bus speed can have adverse effects with negative conse-quences for customers and the public transport agency: low speeds induce customer dissatisfaction. Customers who repeatedly experience riding slow buses could turn away from buses and switch to other means of transportation. Such loss of patronage incurs loss of revenue and public support for the agency.
Additionally, low speeds increase the operating cycle time. The cycle time is defined as the total time for the bus to complete a round trip. The cycle time includes the travel times of a bus in both directions plus the recovery times, also called layover times, at both terminals. The cycle time is the total time it takes the vehicle to complete one operational cycle. Given a fixed bus frequency, the higher the cycle time, the higher the number of vehicles needed to operate the route. Indeed, the number of buses n for a route with a given headway h depends in its cycle time c as follows:
𝑛 =⌈︁ℎ𝑐⌉︁
where the headway h is defined as the time interval between two consecutive buses at a given location. The number of buses is this ratio rounded up.
Hence, lower speeds can lead to an increase in cycle time and thus to an increase in operating costs with potentially higher vehicle requirements, more driving time, and more fuel consumption. Although good reliability is essential for effective functioning of the network, it cannot be implemented at the cost of significantly longer travel times without affecting customer satisfaction.
1.1.6
Passenger Perception of Regulatory Actions
Bus operations need to be regulated to be reliable, as previously discussed. Customers benefit from reliable service because it decreases the variability of their journey time2.
However, although passengers benefit from a reliable service, they might be reluctant to see their own bus being slowed down for the benefit of other passengers and the overall reliability of the service. This reluctance can be explained because, first, there might be a lack of information about the overall benefits of regulating the routes, and thus passengers are less likely to be understanding when the bus is held and more likely to complain about it. Second, it is interesting to note that the regulation of the route negatively affects the riders on the given bus but benefits passengers who are waiting at downstream stops. Thus, the riders who see their travel time extended do not perceive its benefit (because it does not benefit them directly) and their utility decreases. But the beneficiaries of the reliable service do not necessarily perceive it to be the result of regulation and might not realize the benefit they get from it. Riders on a bus being held might complain but might also have benefited from the (earlier) holding of this bus without realizing it. Hence, although effectively regulating routes benefits passengers overall, its disadvantages are more apparent to the customers, who are more likely to complain about it as a result.
As a result, public transport agencies would like to implement regulating actions that result in the right balance between speed and reliability to provide the best service to their customers. Slightly less reliable services could be acceptable if it results in shorter travel times.
This thesis investigates the balance between speed and reliability in bus oper-ations, focusing in particular on headway-managed routes. More specifically, this research examines the case of an over-emphasis on reliability which results in a slow-ing down of the route, called impedance. The aim of this work is to explore, detect, and quantify the phenomenon of impedance in bus operations, using the London Bus Network as a case study.
1.2
Stakeholders in Bus Operations
This section presents an overview of different organizational forms of public transport and describes a specific form, which corresponds to the organization of Transport for
2The journey time is defined as the total duration of the journey, including the wait time and
London, the case study of this thesis, and then presents the stakeholders in bus operations.
1.2.1
Organizational Forms of Public Transport
In the article Organisational forms and entrepreneurship in public transport Part 1: classifying organisational forms, van de Velde (1999) distinguishes two types of organizational forms, where either public entities or private companies are responsible for the operations (Figure 1-3):
∙ Market initiative, where services are created by autonomous markets. ∙ Authority initiative, where services result from decisions of the authority.
Strategic level: strategic planning is involved in the
formulation of general aims and in the determination in
broad terms of the means that can be used to attain these.
In short: what do we want to achieve?
Tactical level: tactical planning is about making
decisions on acquiring means that can help reaching the
general aims, and on how to use these means most
efficiently.
In short: what product can help us to achieve the aims?
Operational level: makes sure the orders are carried out,
and that this happens in an efficient way.
In short: how do we produce that product?
Fig. 1 translates these to the public transport sector,
with-out yet referring to any specific legal or regulatory setting.
At the strategic level we can find things such as the
general aims and service characteristics, which include
such topics as the profit and market share aims, the general
description of the services that will be provided, the area of
supply, the definition of the main target groups and the
positioning of the services in relation to substitutes and
complements (intermodality). We define this level as
being at the core of ‘entrepreneurship’ and the actor
respon-sible for these crucial decisions as the ‘entrepreneur’ as he
takes the initiative for the creation and supply of services,
thereby takes some form of risk, and as he delineates at least
the main characteristics of the services that will be provided.
The tactical level translates these aims into detailed service
characteristics. The actual ‘design’ of the services takes place
at this level. We find here the traditional parameters of public
transport such as the definition of the routes, timetable,
vehi-cles and fares, but also ‘softer’ aspects such as the image of the
services and the provision of additional services to the
passen-gers (such as catering, news, etc.)
At the operational level we find the translation of the
tactical aspects into day-to-day practice. This includes the
and of the infrastructure to ensure the realisation of the
services according to the tactical planning.
In opposition to the hardware side, which is the
produc-tion of vehicle-kilometres, we define the software side as
everything that will help to sell the vehicle-kilometres, i.e.
transforming them into passenger-kilometres. Seen from a
dynamic perspective, there has of course to be a feedback
between the decision levels involved, notably based on the
feedback provided by (potential) clients. Moreover, there
will ideally be a link between the hardware and software
side at the tactical level to ensure an adequate evolution of
the services, in accordance with market needs and the stated
general aims. Fig. 1 does not, for clarity’s sake, focus on
these dynamically essential links and feedback of
informa-tion. It focuses on the way management decisions pertaining
to the appearance of public transport services on markets are
ordered, whatever the organisational form in place and
whatever the extent of public intervention. Up to this
point nothing is said neither on the exact aims of the public
transport system (strategic level) nor on the identity of the
actors involved at the various levels—leaving open whether
these are one or several public or private companies,
autho-rities or other actors, nor on the competitive nature of the
organisational form.
As for any production, one or several actors can be
responsible for each of the decisions presented in the
table. In general the strategic-tactical-operational chain
can be seen as a (series of) principal-agent chain(s).
Numer-ous forms of organisation of this chain of principal(s) and
agent(s) are possible and the following classification will
clarify this by delineating a number of ‘pure organisational
forms’ in relation to which real-world organisational forms
can then be positioned.
3. Classification of organisational forms in public
transport
The tree-diagram presented in Fig. 2 presents a global
D.M. van de Velde / Transport Policy 6 (1999) 147–157 149
Fig. 2. Organisational forms in public transport.
Figure 1-3: Two forms of organizations in public transport (van de Velde, 1999). van de Velde also distinguishes three different levels of planning and control in public transport:
1. Strategic level, which states the general aim of the organization. 2. Tactical level, which defines the means to achieve the aim.
3. Operational level, which efficiently implements the orders that constitute the means.
The different types of organizations can be described using these three levels of planning and control. This research focuses on the type called Central planning and
tendering of the realisation (van de Velde, 1999). Transport for London, the case study of this research, belongs to this category. The Central planning and tendering of the realisation is graphically represented in Figure 1-4. In this case, the strategic decisions belong to the transport authority, itself often supervised by the political council or the Department of Transport. The public transport authority is also re-sponsible for the tactical part: it decides on the fares, the routes, and the timetable, among others. The operational part is divided between the public transport authority and the operating companies, although most of it is managed by the private compa-nies. The operating companies are responsible for running the route, and managing the personnel and the vehicles, among others. Passengers are part of this system because they are the customers and the end-users of the bus service.
4. Examples of organisational forms
Using the levels of planning and control as presented
above, together with the insights provided by the
classifica-tion of organisaclassifica-tional forms, it becomes possible to draw
graphical presentations of both existing and conceptual
organisational forms in public transport.
6As an illustration,
a few organisational forms will be presented briefly
here-after. All are closely related to existing organisational forms
in Europe or in the rest of the world.
The actors involved, their number and the way in which
they come to play will depend on the organisational
frame-work in place. In some cases all actors will be part of the
same organisation or company (‘in-house’ or integrated
production case), in other case contracting-out will be
used and the actors involved will be part of different
organisations or companies. The following examples will
illustrate that the contracting out question is present at two
different levels: for the link between the strategic and the
tactical level and for the link between the tactical and
the operational level. In particular the issue of tendering
and contracting between authorities and operators, which
has attracted a lot of attention in recent years (the main
examples being Scandinavia, London and France), will be
clarified by this approach.
In all but the last example the authority plays the role of
‘principal’ in the chain of actors. In these organisational
forms the authority, which can be called organising
trans-port authority, supplants the market and behaves as an
entrepreneur by taking the initiative to ‘create’ transport
services. In the last example, the authority is not part of a
principal–agent relationship, it is therefore not an organiser
or entrepreneur as such. However, if the authority owns a
transport company and determines transport supply through
this ownership link, it thereby transforms its role into a de
facto organising authority.
7In all cases, but especially in the
latter, distinct regulatory authorities can also exist. These
are the authorities issuing authorisations and those paying
subsidies to users and producers.
The democratic relationship which exists between ‘the
People’ and the (transport) authority should also be added
to the principal-agent chain. This link exists as both
orga-nising and regulatory authorities are supposed to act on
behalf and represent the interests of ‘the People’. Similar
to the case where an authority chooses a transport operator
in a tendering procedure, ‘the People’ chooses here an
authority, or at least its controlling organs, in a democratic
process.
The graphical exercise of converting existing regulatory
arrangements into comparable grids can serve several
purposes. It can be used to allow people who are not familiar
with a regime to catch its essential features in a glimpse. It
can also be used when designing regimes in order to keep
the threads of reasoning well structured.
Key for reading the figures:
• The first row of each figure indicates which actors are
involved in the organisational form described. The nature
of each actor is given below its general name.
• The second row of each figure indicates by arrow-shaped
blocks which control relationship there is between the
actors involved.
• The lower part of each figure indicates which actors are
D.M. van de Velde / Transport Policy 6 (1999) 147–157 153Fig. 3. Central planning and tendering of the realisation.
6See van de Velde and van Reeven (1996) for an earlier description of
such models, at greater length, in a report on the implementation of tender-ing in public transport in the Netherlands, written for the Dutch Ministry of
7A municipal authority can, e.g. decide on the actions of its own
passen-ger transport company even if, legally, there is a free market which is regulated by a different authority, such as a regional traffic commissioner
Figure 1-4: The central planning and tendering organizational form (van de Velde, 1999).
Bus operations result from the interactions between multiple entities including the following in the case of central planning and tendering:
1. the public transport agency;
2. the operating companies with their drivers and route controllers; 3. the passengers.
Figure 1-5 shows the different stakeholders in bus operations, their interests, and their inter-relationships.
Passengers
Drivers
Operators
Agency
Bids & Contract Penalties & Bonuses
Contract Extension Employee / Employer Unions Working Conditions Customer / Service Provider INTERACTIONS INTERESTS
Benefit from good service Reliability
Speed
Protect jobs and working conditions
Reduce stress
Protect market position Improve contract
Win bonuses Avoid Penalties Get contract extension
Provide good customer service
At low cost
Figure 1-5: Relationships between stakeholders in bus operations.
1.2.2
Public Transport Authority
The public transport authority has the major decision-making power at both the strategic and the tactical levels. At the strategic level, it is responsible for the long-term investment and evolution of the network, including its social implications. At the tactical level, the authority decides on the bus routes, the frequencies, and the desired passenger loads, among others. It is also responsible for tendering and allocating routes to the operating companies. The authority has many goals, among them:
∙ Running the best possible service for passengers
∙ Running the most cost efficient operations that satisfy a minimum service level ∙ Maintaining high patronage, and the attractiveness of bus as a means of
trans-portation
1.2.3
Operating Companies
The operating companies are responsible for part of the tactical work and most of the operational work. They include various internal stakeholders:
∙ the business unit, which defines the guidelines of the operations. It is responsible for the strategy of the operating company, and for monitoring the costs and revenues. It is in charge of bidding during the route tendering process to secure the financial health of the company.
∙ the controllers, who are responsible for managing the route with real-time in-formation and communicating with the drivers. Principally, they monitor the
route, and act in case of disruptions such as mechanical breakdowns, driver absences, accidents, and on the side, they monitor reliability.
∙ the drivers, who are responsible for driving the buses. They also cooperate with the controllers to mitigate disruptions and improve reliability.
The relationship between the public transport agency and the operating company is key to effective operations. Generally, a contract defines the legal duties of both the public transport authority and the operating company. The underlying mechanisms governing this relationship influence the quality of operations. Indeed, some contracts include financial bonuses and penalties based on the operating performance. Since, the operators are private companies aiming at maximizing their profit, the business adapts its strategy to earn the highest possible bonus. Moreover, high performance can also be encouraged through contract extension terms conditioned by a minimum performance level.
Drivers are employed by operating companies and are typically represented by trade unions. The unions are a negotiating body that represents the interests of drivers to the operating companies and Transport for London. Unions defend the working rights of the drivers, protect their jobs, and help them manage stress. Oper-ational changes impacting drivers must be negotiated with their unions.
1.2.4
Passengers
Passengers are the customers and the end-users of the service. They evaluate the quality and attractiveness of the service from their individual viewpoints, as opposed to the transport authority which assesses the performance based on the passengers collectively. The interest of an individual passenger is to benefit from a bus service that is as fast and as reliable as possible.
Passengers often attribute the service delivery to the public transport agency di-rectly because they might not be aware that operations are outsourced. It seems that there are two possible loops for passengers to provide feedback: either com-munication with drivers or comcom-munication with the agency. The transmission of information through drivers is quite uncertain: it might not always be communicated to the management of the company. In fact, it might be reasonable to assume that no information from passengers will reach the public transport authority through drivers. Thus, the most effective feedback loop goes directly from the passengers to the public transport agency through complaints or via social media. This direct loop helps the agency understand customer desires.
Less influential stakeholders such as the City Council, the state, lobby, and citi-zens’ groups also play a part in this system.
Each stakeholder is driven by their own interests that are likely to be divergent. Although every entity might behave rationally, the resulting operations might not be the most effective for the public transport agency or for the passengers collectively. The challenge for the public transport authority is thus to define the most effective and
realistic balance between the various stakeholders’ interests to run the best operations for the customers.
1.3
Definition of Impedance
The term impedance is used to describe bus routes being slowed down. More specifi-cally, it refers to cases where there is an overemphasis on reliability to the detriment of speed in bus operations. Hence, impedance stems from the use of regulatory ac-tions implemented to maintain a reliable service. There are two types of regulatory actions:
∙ Holding at the stop, defined as a bus standing at a stop for longer than is necessary for passengers to board and alight
∙ Going slow, defined as driving between stops at a speed that is lower than feasible with respect to safe operations and traffic conditions.
Impedance is likely to be a mix of these two actions. However, it is necessary to carry out an investigation to know what is the contribution of each to the overall phenomenon of impedance. Defining impedance is challenging for multiple reasons. First, each stakeholder might have different views of what constitutes impedance. Second, it is difficult to characterize the appropriateness of the use of regulatory actions, and third, impedance could be looked at either the event or the trip level.
This section tackles the challenge of defining impedance and proposes a definition for this research. Specifically, this section addresses the viewpoints of the different stakeholders on impedance, the appropriateness of regulating actions, the different levels of analysis of impedance, and the chosen definition of impedance.
1.3.1
Stakeholder Viewpoints on Impedance
Bus operations involve many stakeholders including the public transport authority, the operating companies including the route controllers and the bus drivers, and the passengers. All have different viewpoints on route regulation, and thus, on impedance. ∙ Customers benefit from a regular service: for headway-managed routes it re-duces the mean and variance of their waiting time at the stop. For timetable-managed routes, it increases the on-time performance. Nevertheless, highly reliable bus arrivals at stops also have a cost for passengers if some buses are held to achieve it. Indeed, a reliable bus service needs the route to be reg-ulated because otherwise buses would naturally bunch, creating large gaps in service. Regulating actions inevitably slow down the route, extending the on-board travel time for some passengers. Taking an economic approach, each passenger wants to maximize her own utility by having the most reliable and fastest service. Thus, each passenger appreciates that the route is controlled and fast, but dislikes it when the regulation negatively affects her trip.
∙ The operating companies are in charge of delivering reliable operations on a daily basis. The route controllers manage a handful of routes and react in cases of large disruptions, but also foster reliability using real-time informa-tion about the bus locainforma-tions, and by telling drivers which regulating acinforma-tions to implement. They wish to deliver the best service to passengers. Nonetheless, impedance can be (inadvertently) encouraged when operating companies are heavily evaluated on their reliability performance because a slower pace favors better regulation of the system and slows down the propagation of disruptions. From a business perspective, in the specific case when the contract structure with the public transport authority includes financial bonuses and penalties in-dexed on performance, operating companies will adjust their behavior to reflect their economic interest: maximizing their profit. Thus, if incentives reward re-liability exclusively, this would be the priority of the operating companies, even to the detriment of speed. Depending on how they are structured, financial incentives can either encourage or become obstacles to achieving the desired balance between speed and reliability.
∙ Drivers are employed by the operating companies and follow the instructions of the controllers to maintain reliability. The position of the drivers can be tricky because they have the responsibility to implement the controller instructions, but also hear the complaints of unhappy passengers riding their bus. Thus, it might sometimes be difficult to implement the necessary regulating actions that result in slowing down the bus.
∙ The public transport authority is held responsible for the public transport service and is consequently also responsible for the service delivered by the operating companies. The public transport authority aims at maximizing the satisfaction of its end users: the riders. More specifically, the authority goal is to maximize the utility of all passengers overall within budget constraints. This goal is different than for a passenger, who aims to maximize their individual utility. Maximizing the overall passenger utility means that it is acceptable to trade the disutility of some riders, created by regulating actions, for a higher utility of other customers. Thus, the public transport authority aims for a service balanced between reliability and speed and accepts that routes can be slowed down to improve reliability.
1.3.2
Regulating Actions
Each stakeholder tends to have a different viewpoint on when regulating actions are appropriate.
∙ For the customer, it is when it benefits him. Hence, a passenger might not find any regulating action appropriate when he is on the bus. Nonetheless, he might benefit from more reliable service if it means holding the bus upstream.
reliability performance, regulating actions should be implemented to obtain the level of reliability that maximizes their profit.
∙ For the public transport authority, regulating actions should be used to obtain a reliable service, but not to the detriment of speed.
We will focus on the point of view of the public transport authority, which aims to maximize the utility of all users. In this case, regulating actions should only be implemented when there is a significant gap between the buses in the case of headway-managed routes or when the bus is early compared to the schedule for timetable-managed routes. Generally, regulating actions are expected to be sparse, and to address specific situations. Such actions should affect the behavior of one, or at most two, buses on a segment of the route. Indeed, slowing down a bus several times on a trip is counter productive. Regulating actions are not expected to have a cascading effect with multiple buses holding in the same direction, or the same bus holding several times on a trip. A bunch of buses should not have to slow down because a single bus ahead is moving slowly. Indeed, the slowing down of a bunch of buses would have a high cumulative cost in time for all the riders on the held buses and decrease the utility of all passengers. Thus, it seems that there could be two types of regulating actions: one that is sporadic and only involves a small number of buses in specific situations, and the other that is more frequent, affects multiple buses, and results in general slowing down on the route. The latter type could be defined as impedance. Let’s note that drawing the line between the appropriate and counter-productive actions in practice is difficult.
1.3.3
Analysis Levels of Impedance
Impedance can be analyzed through different lenses, either by looking at individual events or by looking at the overall effect on the route. The slowing down of the route characterizing impedance stems from regulating actions aimed at maintaining a reliable service. One possible unit of analysis is the individual event. For instance, the impact of each regulatory action can be analyzed to determine its contribution to the reliability of the route and quantify the resulting extension in the trip duration. The event-level also enables an investigation of the relevance and the resulting effect of these actions. The individual event unit of analysis focuses mostly on the assessment of the route control, and could detect isolated occurrences of impedance. However, it does not really provide strong leverage to mitigate impedance.
Taking the trip as the unit of analysis, instead of the event, helps investigate the impacts of impedance on operations. At the trip level, the cumulative impact of the individual regulatory actions, thus the overall slowing down of the route can be analyzed. Moreover, taking the trip-level as the unit of analysis opens up the question of whether the schedule could be tightened up. Indeed, the trip-level unit of analysis focuses on the overall performance of the route rather than the efficiency of specific control actions.
1.3.4
Chosen Definition of Impedance
For the purpose of this research, the point of view of the public transport authority is adopted: the public public transport agency aims at maximizing the utility of all passengers. Hence, the benefit of all customers together is favored, which may not mean benefit maximization for each individual customer. With the point of view of the public transport authority, regulatory actions will be considered appropriate if they contribute to reliability, but with the concern of maintaining speed.
As a result, the proposed definition of impedance is: actions that result in slowing down the route for the customers. These actions are initiated by controllers, and used to regulate bus operations. They can result in a general slowing down of the route.
This research conducts analyses both at the event-level and the trip-level, but emphasizes the trip-level. This thesis aims at detecting and quantifying impedance and investigates if bus operations could be sped up. It first explores whether there is excessive control to regulate the routes, known as impedance. If the case of excessive control, the question is then if operations could be sped up without any threat to safety, and with a drop in regularity performance that is still acceptable.
1.4
London Bus Network
This thesis uses the London bus network as a case study. Transport for London is the public transport authority of London (England). Its responsibilities include running:
∙ the bus network;
∙ the London Underground; ∙ London River Services; ∙ Victoria Coach Station; ∙ Taxis;
∙ Docklands Light Railway; ∙ London Trams;
∙ London Streets systems.
This section explains the functioning of the London Buses, used as a case study for the analyses. It describes the following:
1. London Buses in numbers;
2. the structure of Transport for London; 3. high- and low-frequency routes;
1.4.1
London Buses in Numbers
London Buses is one of the entities under Transport for London (TfL) and is respon-sible for (TfL, 2019):
∙ 675 routes; ∙ 19,000 bus stops;
∙ more than 9,000 vehicles; ∙ six million bus trips a day;
∙ more than two billion passenger journeys per year.
1.4.2
Structure of Transport for London
The Greater London Authority, which includes the Mayor and twenty five members of the Assembly, runs Transport for London. They propose the long-term strategy planning for transportation in the city. The Greater London Authority is responsible for:
∙ strategic planning ∙ TfL’s budget ∙ fare structure
Transport for London contains a division called Surface Transportation (ST) that includes the following entities:
∙ London Buses; ∙ London Trams; ∙ London Overground; ∙ London Dial-a-Ride; ∙ London River Services.
The London Buses division is responsible for running the bus network, includ-ing planninclud-ing, monitorinclud-ing, and controllinclud-ing bus operations. On one hand, the Public Transport Service Planning division, and the Network Planning team plan the net-work by taking into account current performance, and how proposed changes may affect performance. They work closely with the Tendering team when they retender routes. On the other hand, the Bus Operations division is responsible for reliability in Bus operations (Transport for London, 2019). Table 1.1 explains the responsibilities of the different teams of the Bus Operations division, which includes the following teams:
∙ the Bus Performance Management team; ∙ the Bus Tendering Evaluation team; ∙ the Monitoring and Implementation team.
Team Responsibilities
Bus Performance Management team The Bus Performance Managers are re-sponsible for managing the relationships with the Operators. They use the data from the Monitoring and Implementa-tion team to raise performance issues with the operators.
Bus Tendering and Evaluation team The Bus Tendering and Evaluation team are responsible for ensuring the oper-ators get paid for running the route. They are responsible for calculating pay-ments based on performance.
Monitoring and Implementation team The Monitoring and Implementation team are responsible for setting the per-formance targets for each route and monitoring the performance of the net-work, as well as producing reports to keep the business informed of overall performance.
Table 1.1: Organization of the teams responsible for bus reliability (Transport for London, 2019).
1.4.3
High- and low-frequency routes.
Transport for London distinguishes two types of bus routes: high-frequency and low-frequency (see Table 1.2). High-low-frequency routes have five (or more) buses per hour during general weekday service hours (peak periods and the inter-peak) and weekends. With such frequencies, these routes are headway-managed: customers know that it is a high-frequency service with buses not expected to arrive at the stops on a specific schedule. In this case, customers are assumed to arrive at bus stops randomly in time. For the wait times to be bounded and reliable, it is important to manage equal headways. Thus, the performance evaluation of these routes is also based on headways. High-frequency routes account for eighty percent of the total London bus network mileage.
The second type are low-frequency routes: they have up to four buses per hour during the weekday daytime. It means that there is an interval of (at least) 15 minutes between the scheduled bus arrivals during the day. Customers are assumed to refer
to the schedule to plan their trips. Hence, these routes are managed and evaluated based on their timetable adherence. Low-frequency routes account for twenty percent of the total network mileage.
Frequency Number of buses per hour Performance criterion
High ≥ 5 Headway adherence
Low ≤ 4 Timetable adherence
Table 1.2: High- and low-frequency routes in London.
1.4.4
The outsourcing of bus operations
Bus operations are outsourced to private companies through a tendering process in an open market. Currently, the winning company is awarded a five year contract with financial incentives indexed on their reliability performance. A possible two-year extension based on performance can be awarded to the operating companies. Chapter 3 explains in more detail the relationship between TfL and its operating companies.
1.5
Objectives and Approach
This thesis investigates the balance between speed and reliability and how regulating actions slowing down buses affect trips and can potentially lead to systematic slowing down of the route. The aim is to provide performance indicators evaluating operations and informing public transport agencies about potential slack in the schedule.
This research focuses on high-frequency routes running during the daytime, for which the impedance concern is very important and could have a large impact for Transport for London.
1.5.1
Objectives
The objectives of this thesis are:
1. Explore the existence of impedance and layout the conditions under which it can arise. This work defines the specific conditions encouraging impedance and explores its occurrence and significance. This work aims at highlighting the organizational arrangements favoring impedance in order to flag for pub-lic transport agencies its possible existence in certain settings, and second, to understand how the root causes could be mitigated.
2. Find manifestations of impedance in the data. If the concern about impedance is supported by a combination of expert knowledge within the authority, com-plaints, and data analysis, the second objective of this work is to investigate