HAL Id: halshs-00008624
https://tel.archives-ouvertes.fr/halshs-00008624
Submitted on 15 May 2006
HAL is a multi-disciplinary open access archive for the deposit and dissemination of sci-entific research documents, whether they are pub-lished or not. The documents may come from teaching and research institutions in France or abroad, or from public or private research centers.
L’archive ouverte pluridisciplinaire HAL, est destinée au dépôt et à la diffusion de documents scientifiques de niveau recherche, publiés ou non, émanant des établissements d’enseignement et de recherche français ou étrangers, des laboratoires publics ou privés.
Hilda Guerrero Garcia Rojas
To cite this version:
Hilda Guerrero Garcia Rojas. Industrial water demand in Mexico : Econometric analysis and implications for ”water management policy”.. Economics and Finance. Université des Sciences Sociales -Toulouse I, 2005. English. �halshs-00008624�
UNIVERSITE DE TOULOUSE 1 - SCIENCES SOCIALES
INDUSTRIAL WATER DEMAND IN MEXICO:
ECONOMETRIC ANALYSIS AND IMPLICATIONS FOR
WATER MANAGEMENT POLICY
THESE
Pour le Doctorat en Sciences Economiques Sous la direction d’Alain ALCOUFFE
et Jean-Pierre AMIGUES
Présentée et soutenue le 14 février 2005 par
Hilda GUERRERO GARCIA ROJAS
Membres du Jury
Alain ALCOUFFE, Professeur, Université de Toulouse 1.
Jean-Pierre AMIGUES, Directeur de Recherche INRA, Université de Toulouse 1 Patrick POINT, Directeur de Recherche CNRS, Université Bordeaux IV, rapporteur Steven RENZETTI, Professor at Brock University, Canada, rapporteur
L’Université de Toulouse 1 - Sciences Sociales n’entend donner aucune approbation ni improbation aux opinions émises dans cette thèse: ces opinions doivent être considérées comme propre à leur auteur.
Contents
List of figures . . . . . . 5 List of tables . . . .. . . 6 Acknowledgements . . . .. . . 8Introduction
. . . 111. Water
in
Mexico
Introduction 19 1.1 Water statistics in Mexico and in the world . . . 211.2 Water management reforms in Mexico . . . 33
1.2.1 Institutional framework . . . .. . . 34
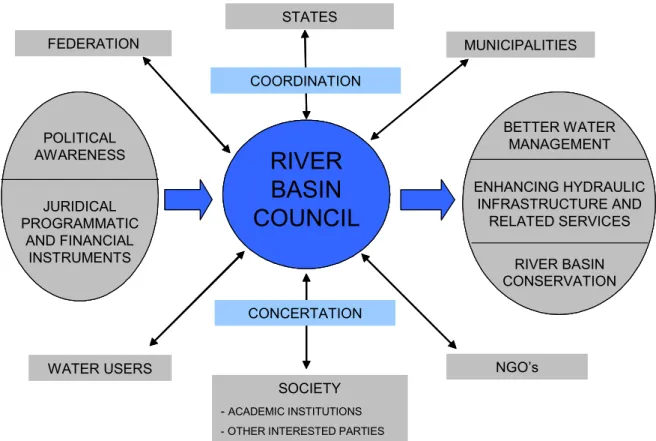
1.2.2 River Basin Councils . . . . .. . . 41
1.2.3 River Basin Organism . . .. . . 46
1.3. Economic framework . . .. . . 48
1.3.1 Water charges framework . . . 49
1.3.2 Water prices structure . . . . 52
1.4. Conclusion . . . 58
2
Industrial Water Demand
Introduction 61 2.1. Brief survey on industrial water demand . . . 622.2. Microeconomic foundations . . . 75
2.2.1 The model: the dual approach . . . 76
2.2.2 Translog cost function, flexible form – short run . . . 81
2.2.3 Elasticities . . . 84
3
Manufacturing Water Demand in Mexico
Introduction . . . 89
3.1. Overview of the industry and water in Mexico . . . 90
3.2. Industrial water use . . . 94
3.3. Industrial data description . . . 111
3.4. Preliminary data analysis . . . 115
3.5. Estimation of industrial water demand in Mexico: Empirical Results for manufacturing sector . . . 124
4.
Experiments on water for industrial use in Mexico
Introduction . . . 1374.1. Water zone location experiment . . . 138
4.2. Changes of water zone analysis . . . 147
4.3. Experiments without subsidy on water price . . . 152
4.3.1 Legal framework . . . 152
4.3.2 Data analysis . . . 154
4.4. Experiments with water price elasticity . . . 157
4.4.1 Elasticity by industry and water zone . . . 157
4.4.2 Scenarios on water demand changes due to subsidy elimination . . . 161
4.4.3 Scenarios under water demand constraint . . . 168
Conclusion
. . . 177Annex A
A.1 Ley Federal de Derechos Primer semestre de 2003 . . . 187A.2 Ley Federal de Derechos en Materia de Agua 1996 . . . 195
List of Figures
1.1 Regional Water Availability . . . 24
1.2 Water Availability and Economic Activity . . . 25
1.3 Hydrologic-Administrative Regions (CNA 1999) . . . 27
1.4 Regional Office in 1989 (CNA) . . . 42
1.5 River Basin Councils (general structure 1999) . . . 43
3.1 Manufacturing Gross Product (%) by Administrative Region . . . 95
3.2 Workers / Economic Unit by Administrative Region . . . 96
3.3 Treated volume of industrial wastewater 1996 – 2002 . . . 99
3.4 Extraction and discharge by major water consumer industries . . . 101
3.5 Extraction and discharge by chemistry industry . . . 109
3.6 Availability Water Zones . . . 118
3.7 Water source for self supplied Industry . . . 121
4.1 Percentage change in quantity of water due to subsidy elimination . . 163
4.2 Water demand percentage change due to subsidy elimination . . . 164
4.3 Water demand decrease due to subsidy elimination . . . 166
4.4 Water demand constraint . . . 169
4.5 Water not consumed and water constraint (W) . . . 170
4.6 Mining water not consumed and water constraint . . . 171
4.7 Paper water not consumed and water constraint . . . 173
List of Tables
1.1 GDP and Population 2002 . . . 23
1.2 Precipitations and Water Availability . . . 24
1.3 Consumptive water uses in Mexico for 2001 . . . 27
1.4 Water extractions by region, source and type of use for 2001 . . . 28
1.5 Per capita extractions in cubic meters by region for 2001 29 1.6 Principal Water Use (consumptive use) . . . 30
1.7 Potable Water and Sewerage System . . . 32
1.8 River Basin Auxiliary Organizations . . . 45
1.9 Weight by zone and use . . . 53
1.10 Cost of water by type of use . . . 54
1.11 Water quotas first semester 2003 . . . 57
2.1 Econometrics Applications to Analyze Industrial Water Demand . . . . 62
3.1 Water extractions by region and source for 2001 . . . 97
3.2 Treatment Plants for Industrial Wastewater (December 2002) . . . 98
3.3 Wastewater discharge by industry (%) . . . 99
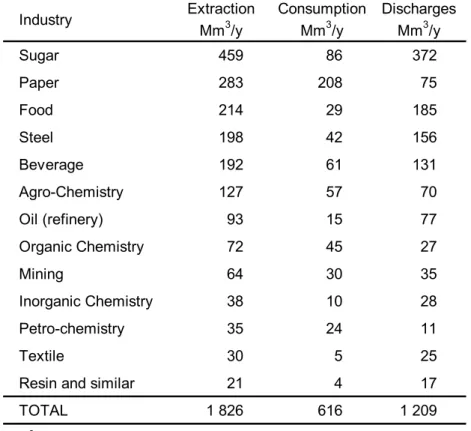
3.4 Water consumption by Industry (Mm3/y) . . . 100
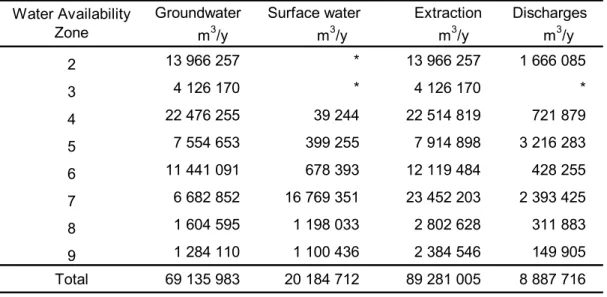
3.5 Water extractions by Availability Zone in Mining Industry . . . 102
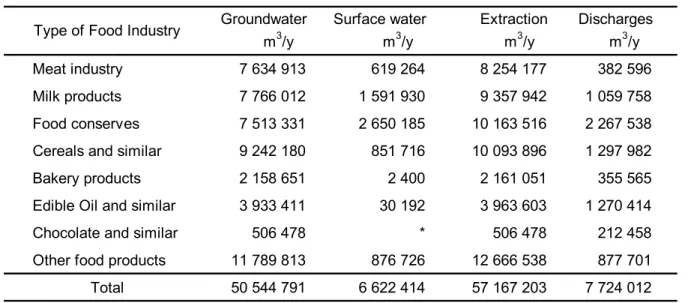
3.6 Water extraction for type of Food industry . . . 103
3.7 Sugar industry water extraction by administrative region . . . 104
3.8 Water use for soft carbonated and no alcoholic drink production . . . 105
3.9 Textile industry water use . . . 106
3.10 Paper industry water use . . . 107
3.11 Water consumption by chemistry industry . . . 108
3.12 Steel industry water use . . . 110
3.13 Data description . . . 112
3.14 Sample Descriptive Statistics . . . 114
3.15 Average Water Productivity by Industry . . . 115
3.16 Average Water Productivity by Zone . . . 116
3.17 Average Water Productivity by Administrative Region . . . 119
3.18 Firms by Water Availability Zone . . . 121
3.20 Translog Cost Function Estimation Results for Mexican Industry . . . . 125
3.21 Translog Cost Function: Homogeneity Test . . . 128
3.22 Cost Share Equation System Estimation: Results for Mexican Industry . . . 130
3.23 Allen Elasticities of Substitution (AES) . . . 131
3.24 Own and Cross-Price Elasticities of Demand . . . 131
3.25 Morishima Elasticities of Substitution (MES) . . . 133
4.1 Water zone location experiment . . . 141
4.2 Changes of water zone relating to year 2003 . . . 148
4.3 Firms in the same water zone relating to year 2003 . . . 150
4.4 Mean Water Price without subsidy by industry . . . 154
4.5 Mean Water Price without subsidy by water zone . . . 156
4.6 Elasticity by industry and water zones . . . 159
4.7 Change in water price due to subsidy elimination: scenarios . . . 162
4.8 Water demand decrease due to subsidy elimination: Scenario by industry . . . 165
4.9 Water demand decrease due to subsidy elimination: Scenario by water zone . . . 167 4.10 Percentage of water not consumed by industry: scenarios . . . 167
Acknowledgements
I would like to express my thanks to the Consejo Nacional de Ciencia y Tecnología (Conacyt) from Mexico for the scholarship which allowed me to do my PhD Program.
I wish to express my sincere gratitude to Professor Alain Alcouffe for accepting me under its direction, as well as to my co-director Professor Jean-Pierre AMIGUES.
My gratitude to Professor Patrick POINT and Professor Steven RENZETTI for agreeing on evaluating my thesis research as examiners.
I also express my gratitude to Professor Michel Moreaux for giving me his support and confidence to pursue my doctoral program.
All my gratitude and reconnaissance to Professor Alban THOMAS for his support, patience and advice all the way through my thesis work.
This research project would not be achieved without confident data. For the opportunity and the accessibility to Mexican data I am thankful to the Instituto Nacional de Estadística, Geografía e Informática (INEGI) and to the Instituto Mexicano de Tecnología del Agua (IMTA), both from Mexico, I specifically appreciate the support given by Pilar Hernández Valladares from INEGI as well as by Ramón Piña Sánchez and Ramón López Hernández, both from IMTA.
I gratefully acknowledge Charles Howe and Ariel Dinar for their continuous sustain to go after this non easy road that a PhD involves.
I thank Christine Garcia-Carro, Sylvie Billout and Aude Schloesing for their constant aid in my stage at the Manufacture de Tabac
My gratitude to Chantal Hornero for her friendship, for our long talks and for encouraging me during my adverse moments in Toulouse.
My special thanks to Gloria Gutierrez for sharing her tight time checking over the whole document in an extremely short schedule.
To all my friends here in Toulouse, in Spain, in Holland, in Mexico, or where they could be around the world, many thanks for being there, next to me, cheering me up on difficult moments and sharing the good ones.
DEDICATORIA
Esta tesis es para ti mamá, para ti papá, para ustedes hermanas (Ruth, Gloria, Verónica y Nora), y hermanos (Miguel, César, Sergio, Alejandro, Jorge y Marco), para ustedes sobrinas y sobrinos quienes ahora forman una nueva generación con aspiraciones, ilusiones y valores como los que me enseñaron sus abuelos . Todos ustedes, mi familia, me han dado su apoyo, su confianza, su cariño incondicional. Gracias por hacerme saber cada uno a su manera que siempre estan conmigo.
Mami, papi una vez mas les agradezco, ya que son ustedes quienes me han impulsado y dado la inspiración para seguir adelante, quienes me han enseñado la satisfacción que da luchar por un ideal y poner la vida al servicio de un ideal.
Esta tesis es la muestra de un triunfo más del espíritu de lucha de nuestra numerosa y querida FAMILIA.
Introduction
It is well documented that water is becoming a resource with increasing scarcity for a large number of countries, principally semiarid ones. In order to promote efficient water management, policymakers are trying to find the best way to allocate existing water reserves and persuade users to adopt conservation practices. In the search of mechanisms to support that, around the world, different economic instruments have been used to promote an efficient water use. The most used are taxes, charges, subsidies, levies and quotas. But the effectiveness of the results that any of them could generate is in function of the economical and political context where they are applied.
The price of water has been utilized as an economic tool to enforce water users to become more efficient, since a commodity price is seen as a measure of its scarcity. But also, water has ecological, recreational and social values that need to be reflected in the pricing system. Hence, a charging system should encourage a reasonable use of the environment. Meaning that, a price is supposed to be a sign of the right and the whole social costs for supplying water, including resource depletion.
Dinar and Subramanian (1997) document experiences, through several countries, on water pricing, and identify water pricing as a key to improve water allocation and encourage conservation. For this reason, reforms on water pricing have come to play an important role to encourage the use of water efficient. Dinar (2000) addresses this topic and presents a framework to compare water pricing reforms, as well as selected experiences of reforms in different sectors and countries.
In Mexico, like in many other countries, modern water management rests on a delicate balance between governmental regulation and market mechanisms. The country's legal and institutional reforms implemented in the early 90’s have the objective to achieve this balance.
Mexico's approach of pricing water has been pragmatic in nature. Thus, rather than going into a complicated scheme of calculating, if possible, opportunity costs or long term marginal costs, it has take into account the political resistance associated with the introduction of new fiscal burden. That is why, the introduction of water charge in 1986 considers less important to assign the "right" price than introducing the concept of water as an economic good with a specific value. Nevertheless, the initial water charges introduced by law consider some principles of proportionality, capacity to pay and actual water availability in every region.
The basis for developing and consolidating Mexico's Water Financing System is established by a system of charges for both water use and wastewater discharge. Besides providing an incentive to increase water use efficiency, which is already measurable, the collection of charges, for water use as well as for water discharge, have resulted in the generation of financial resources to carry out water programs and activities.
Mexico has a long hydraulic tradition, which goes back to Pre-Hispanic times, where the relation with water was not just for religious purposes, but it was associated with economic development. Water has influenced different aspects of the country social and economic development. For the past 80 years, the increasing water use in cities, industries and irrigation for agriculture have based its growth in the expansion of hydraulic infrastructure, as well as on the accomplishment of different policies to guarantee a proper water management. In 1989, The National Water Commission in Mexico (Comisión Nacional del Agua - CNA, by its acronym in
Spanish), was established and declared as the administrative agency responsible for the national water.
Mexican economy is the 10th largest in the world (WB-WDI 2003); no matter that it has not grow as fast as the ideal due to a series of economic crises and a rapid population growth. But there also exist some geographic limits that affect the economical development as nation’s irregular terrain in addition to limited farmland. The number of conflicts for water demand has already increased as a consequence of the continued population growth and urbanization. These conflicts occur between urban and rural users, among neighboring cities, and, more commonly, between neighboring states and regions.
The problems requesting a new approach to water management have been diverse, among others it can be recognized an inefficient water use practices, poorer quality in water bodies; increasing differences between those who have access to water services and those who have not; reduction in water services as a consequence of inadequate maintenance as well as a feeble organization capacity for providing these services. In addition, water was, and still is, seriously under-priced carrying out inefficiencies in the resource allocation to its most beneficial use, as well as disturbing the quantity and quality of water services expected by the population and their economic activities.
Surrounded by this environment, at the beginning of 1990s, the Mexican Government started a number of structural reforms concerning the water sector and the management of national water resources. Legal and institutional modification took place and a series of strategies were implemented with a view of reverting negative trends. These transformations had a significant impact upon water consumers.
Considering that industrial water consumption comes, principally, from self-supplied water, its exploitation is under a concession – that is, water right - or license
authorized by the National Water Commission, and the industry is under obligation to pay for a federal fiscal right for the use of water and also for wastewater discharge on national streams. These are unique (once and for all) payments. In addition, self-supplied industrial water users have to pay quarterly abstraction charges per cubic meter, depending on their geographical location, which is determined according to relative water scarcity. For effluent emission discharge, industrials also have to pay for contaminants as well as for the volumes discharged. On the subject of the abstraction charge payment, there are some subsidies. Additionally, some municipalities are also compensated for a given proportion of their water charges, resulting in an implicit subsidy scheme. The amount of all these payments are set up in the Federal Law Act (Ley Federal de Derechos en Materia de Agua), and they are updated each semester.
In this thesis, our goal is not to determine whether water price in Mexico already represents the relevant value for water. Instead, this research work deals with the effects water pricing reform in Mexico has produced inside Mexican manufacturing sector. Therefore, we try to answer the following questions: Is water price working as a good economical tool to support the efficient use of water within Mexican manufacturing sector? If this is the case, then what is the level of responsiveness of the demand of water by Mexican industry? What is the mapping of manufacturing sector in Mexico? And finally, what is the water demand constraint that allows us to identify the technical shutdown point of the firm?
This research work is the first effort, to our knowledge, of this kind of approach, in which we estimate the elasticities of substitution between water and other productive inputs for the aggregate Mexican manufacturing and mining sectors.
The outline of the thesis is as follows. Chapter 1 starts with a general description of the Mexican hydrological situation and in a worldwide context. The purpose of this chapter is to develop a framework of water management in Mexico and the evolution
of its institutions and water legislation. In addition, we analyze the water pricing system actually used in Mexico as well as the principal water uses.
The literature concerning industrial water demands econometric estimation is quite concise regarding other water uses. Renzetti’s works are the first documented studies in which water use is analyzed, not just as a one more input for industrial together with capital, labor and other inputs, but considering the different uses water may have within industrial production processes. That is, he takes account of different production steps implying water from a technical point of view: intake water, recirculation, water treatment prior to use and water treatment prior to discharges (Renzetti 1988); or intake and recirculation (Dupont and Renzetti 2001).
In the empirical literature, the production technology of the firm is usually characterized either by the Profit Maximization Problem -PMP (primal approach) or by the Cost Minimization Problem -CMP (dual approach). Input demand levels are derived from the result of one of the following approaches: profit maximization or cost minimization. Under the dual approach, it is not essential to identify the exact amounts of the input used. We only need information of input prices and final output levels. It holds because cost function is conformed by the conditional demand of factors, which are conditioned to a specific production level. The dual approach is privileged given that it is easier to reach reliable data with reference to input prices in an industry than the quantity of these inputs used by the firm.
Thus to characterize the technology of the Mexican industrial sector, we adopt the dual approach. Then we will consider a cost function which relates the (short-run) variable cost of production to input prices and to the output level. Translog functional form has become the most popular tool for estimating industrial input demand, due to the advantages it offers, like the capability to model production relationships with numerous inputs without imposing rigorous conditions on the elasticity of substitution.
As many other empirical studies, we will use the Translog Cost function to model Mexican industry cost structure.
In Chapter 2 we present a survey on industrial water demand and the microeconomic foundations we use to characterize the technology of the Mexican industrial sector. We also describe the Translog cost function we are going to apply to Mexican data of the manufacturing sector.
The conflicts between water users in Mexico have a long history. Then and now, industrial users have played an important role. We begin Chapter 3, Section 3.1, giving an overview of what has been the evolution of industrial sector in Mexico and its relationship with water.
Next, in Section 3.2, we give a general description of the participation of industrial activity in the Mexican economy, and we briefly describe some of the most relevant characteristics for the 8 major water demanded industries.
In Section 3.3 we present the data of Mexican industry. Data is for the aggregate Mexican manufacturing and mining sector. Even if, strictly speaking, mining is not a manufacturing industry, we include this sector in this thesis work because mining is considered one of the principal water users in Mexico. The 8 industrial sectors we use in this research are: mining, food, sugar, beverage, textile, paper, chemistry, and steel, which are representative of the major water demanded industries. The total amount of observations is 500 (single cross section of firms). In this Section we explain the source of the data and the way different variables are constructed.
In Section 3.4 we present preliminary variables analysis and we describe the correlation between them. Then, using the data of the 500 firms of eight industrial sectors, the industrial water demand is estimated, using a Translog cost system, by Seemingly Unrelated Regression (SUR) procedure.
In Section 3.5 we present the empirical results of the water demand for the Mexican industry, as well as the elasticities that the cost estimates allows us to obtain. We find that industrial water demand is inelastic and not very responsive to changes in water price (elasticity -0.2976). Water is found to be a substitute for both labor and materials in the sense of Morishima Elasticity of Substitution.
In Chapter 4, Section 4.1 we conduct an experiment whose objective is to evaluate the consistency of the industrial firm distribution regarding water availability zones. Presumably, if a firm faces the same market conditions, and if input prices for labour and materials are uniform throughout regions, then the firm will be better off by operating in the region where water is cheapest. If, on the other hand, a firm with intensive water use is located in a zone with a high price for water, this would indicate that profit differentials with other water availability zones depend on other factors such as those mentioned above. This experiment reports that 44.4% of firms are consistently located regarding the water availability zones.
In Section 4.2 we compare the water zones from our database against the availability water zones in year 2003. We got that 45.8% of our original database water zones are still in the same zone in the year 2003.
In Section 4.3 we perform a short experiment without subsidy on water price, where we, principally, make a brief data analysis to compare water price with subsidy and without it. In this Section we first give a note on the legal framework of subsidies on water price in Mexico. We carry out this experiment exclusively for those industrial sectors which benefit from a subsidy on water price. That is, the mining sector with a subsidy of 75%, sugar with a 50% subsidy and finally, those firms placed in Zone 7, 8 or 9 from paper sector that have a 20% subsidy on water price.
In Section 4.4 we perform an experiment to analyze the effect that elasticity on water price has on the volumes of water demanded by firms. First, we construct the elasticity for each of the 8 industrial sectors by availability water zone. Then, using these elasticities, we define 7 scenarios to analyze the water demand response against subsidy elimination. In the last experiment achieved we identify a water demand constraint to define the technical shutdown point of the firm.
Chapter 1
Water in Mexico
Introduction
Mexico has a long hydraulic tradition, which goes back to Pre-Hispanic times, where the relation with water was not just for religious purposes, but was associated with economic development. The hydraulic structure consisted of irrigation systems, aqueducts, chinampas (floating gardens of Xochimilco), and the hydraulic system of the Gran Tenochtitlan for both flood control and navigation (Guerrero, 1995).
The hydraulic structures from the Conquest times were followed by the Viceroyalty era. In the 18th and 19th centuries dams were built, some of which are still operating. The tradition to legislate water in the Mexico post-independence era has its origins with the Ley General de Vias Generales de Comunicacion (General Law of general communication routes) in 1888. It was followed in 1910 by the Ley de Aprovechamientos de Aguas de Jurisdicción Federal (Law of water use from Federal jurisdiction origin). The former already classified supply sources, regulated water uses and formalized concession regimes (Ortiz, 2001).
In 1926, the Law over Irrigation using Federal Water (Ley sobre Irrigación con Aguas Federales) was established, giving origin to the National Irrigation Commission (Comisión Nacional de Irrigación - CNI, by its acronym in Spanish). In
1947, the creation of the Secretaria de Recursos Hidraulicos provides a greater impulse to the development of the hydraulic infrastructure. Laws and Institutions were developed, and improved to respond to the requirements of the society. In 1960, different sector and regional Plans were promulgated with the goal to improve the use of the hydraulic resources. In 1975, the Plan Nacional Hidraulico was settled. And in 1989, The National Water Commission in Mexico (Comisión Nacional del Agua - CNA, by its acronym in Spanish), was established and declared as the administrative agency responsible for the national water.
Water has influenced different aspects of the country’s social and economic development. For the past 80 years, the increasing water use in cities, industries and irrigation for agriculture has based its growth in the expansion of hydraulic infrastructure, as well as on the accomplishment of different policies to assure a proper water management.
Mexico’s territory encloses an area of 1,964,375 Km2 (CNA, 2003a) with a population of 100.9 million inhabitants (INEGI, 2000). In Latin America, only Brazil with 172 million inhabitants (WB-WDI, 2003) has a larger population than Mexico. In the Continent of America, Mexico is the fifth largest country. Mexico City, the nation’s capital, is by some calculations the largest city in the world.
Mexican economy is the 10th largest in the world (WB-WDI 2003); no matter that it has not grow as fast as the ideal due to a series of economic crises and a rapid population growth. But there are also some geographic limits that affect the economical development as nation’s irregular terrain in addition to limited farmland. The number of conflicts for water demand has already increased as a consequence of the continued population growth and urbanization. These conflicts occur between urban and rural users, among neighboring cities, and, more commonly, among neighboring states and regions.
The problems requesting a new approach to water management have been diverse, among others it can be recognized inefficient water use practices, poorer quality in water bodies; increasing differences between those who have access to water services and those who have not; reduction in water services as consequences of inadequate maintenance as well as a feeble organization capacity for providing these services. In addition, water was, and still is, seriously under-priced carrying out inefficiencies in the resource allocation to its most beneficial use, as well as disturbing the quantity and quality of water services expected by the population and their economic activities.
Surrounded by this environment, at the beginning of 1990s, the Mexican Government started a number of structural reforms concerning the water sector and the management of the national water resources. Legal and institutional modification took place and a series of strategies were implemented with a view of reverting negative trends. These transformations produced a significant impact on water consumers.
The purpose of this chapter is to develop a framework for water management in Mexico and the evolution of its institutions and water legislation. In addition, we analyze the water pricing system actually used in Mexico as well as the principal water uses. This chapter starts with a general description of the Mexican hydrological situation and in the worldwide context.
1.1 Water statistics in Mexico and in the world
Mexico is a Federal Republic, consisting of 31 federal entities and one federal district (DF), which are composed of 2430 municipalities and 16 political delegations in the DF. The territorial extension of the country is 1,964,375 km2. Mexico is bordered in the north by the United States, in the south by Guatemala and Belize, in the east by the Gulf of Mexico and the Caribbean Sea, and in the west by the Pacific
Ocean. The Tropic of Cancer cuts almost by half the country, giving a specific climatic characteristic with arid climates in the north, warm-humid and sub-humid in the south and temperate or cold in regions with greater elevation.
Mexico has a vast diversity in its territory, making it a country with heterogeneous topographical characteristics. It also has a wide variety of natural resources. Therefore, the country has a wide range of climates. Two-thirds of the territory is arid or semi-arid, and the rest ranges from very humid to moderate.
Historic mean annual rainfall (1941-2001) is of 772 mm which results in a mean surface annual runoff of 394 Km3 and 75 Km3 of mean renewable groundwater (aquifers recharge), giving a mean natural water availability of 469 km3 (CNA, 2003a). Rainfall varies widely both by location and season. 67% of the rainfall occurs in only 4 months, which is an attribute of countries with tropical influence, like Mexico. The country is regularly subject to hurricanes and it is continually influenced by drought periods. The climate during the summer is excessive in the occurrence of important rainstorms and for the rest of the year with an almost complete absence of precipitation.
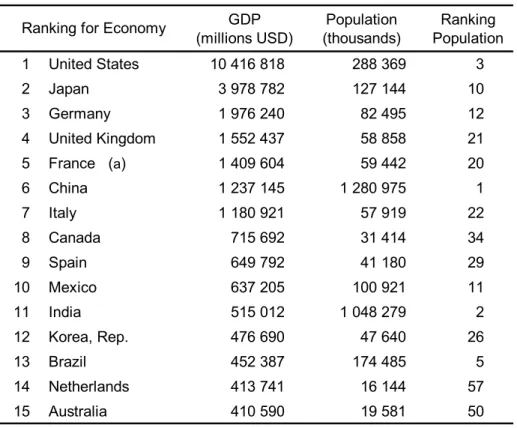
The topographic characteristics and climatic conditions have an important role in the country, since they affect agricultural, livestock, forestry, industrial activities and human communities, and in that sense they affect social and economic activities. The estimated Gross Domestic Product (GDP) is of 6,512 thousand million Mexican pesos -current price of 2003. (INEGI, 2003). The estimated population for 2003 is 104.2 million inhabitants (CONAPO, 2002). Comparing these numbers with other countries (table 1.1), Mexico is the 10th largest economy in the world and the eleventh most populated (WB - WDI, 2003).
Table 1.1 GDP and Population 2002. GDP (millions USD) Population (thousands) Ranking Population 1 United States 10 416 818 288 369 3 2 Japan 3 978 782 127 144 10 3 Germany 1 976 240 82 495 12 4 United Kingdom 1 552 437 58 858 21 5 France (a) 1 409 604 59 442 20 6 China 1 237 145 1 280 975 1 7 Italy 1 180 921 57 919 22 8 Canada 715 692 31 414 34 9 Spain 649 792 41 180 29 10 Mexico 637 205 100 921 11 11 India 515 012 1 048 279 2 12 Korea, Rep. 476 690 47 640 26 13 Brazil 452 387 174 485 5 14 Netherlands 413 741 16 144 57 15 Australia 410 590 19 581 50
Ranking for Economy
Source: WB-WDI (2003). (a) Data include the French overseas departments of French Guiana, Guadeloupe, Martinique, and Réunion.
Considering water availability and precipitation in the world, the performance of Mexico is reported in table 1.2. The Mexican per-capita water accessibility is around 4,685 m3/hab/year. According to the World Bank and United Nations, it is considered
that a per-capita water availability lower than 1,000 m3/year is a signal of a huge
scarcity water problem, while less of 2,000 m3 means a significant water stress level,
principally under years of low precipitation (CNA, 2001).
Then, for the sample of countries reported in table 1.2, Mexico seems to be a country far from having water problems. And it would be true if the water availability were homogeneous throughout the territory, but less than a third of total runoff occurs within 75% of the national territory, where most of the country’s largest cities, industrial facilities and irrigated land are located.
Table 1.2 Precipitations and Water Availability. Country Precipitation (mm/year) water availability
(km3/year) per-capita water availability (m3/hab/year) Ranking per-capita Brazil 1 758 5 418 32 256 2 Canada 493 2 740 91 567 1 China 648 2 812 2 257 9
Egypt, Arab Rep. 18 2 930 10
Spain 684 112 2 844 8 United States 685 2 460 8 906 4 France 870 180 3 258 6 Indonesia 2 700 2 838 13 709 3 Mexico 772 469 4 685 5 Turkey 647 196 3 162 7
Source: CNA (2003a).
Figure 1.1 Regional Water Availability (Source: IMTA, 1999).
Density of Population (%)
Urban Suburban Rural Total1
59.9 13.6 26.5 100.0 Total 20.4 1.6 2.2 24.2 27.6 6.5 10.0 44.1 3.5 1.3 4.2 9.0 8.4 4.2 10.1 22.7 (1) Urban: >15 000 inhabitants; Suburban: 2 500-15 000; Rural: <2 500
Per capita water availability
(m3/hab/year) Scarcity < 1000 Low 1000 - 5000 Fair 5000 - 10000 High > 10000 Density of Population (%)
Urban Suburban Rural Total1
59.9 13.6 26.5 100.0 Total 20.4 1.6 2.2 24.2 27.6 6.5 10.0 44.1 3.5 1.3 4.2 9.0 8.4 4.2 10.1 22.7 Density of Population (%)
Urban Suburban Rural Total1
59.9 13.6 26.5 100.0 Total 59.9 13.6 26.5 100.0 Total 20.4 1.6 2.2 24.2 20.4 1.6 2.2 24.2 27.6 6.5 10.0 44.1 27.6 6.5 10.0 44.1 3.5 1.3 4.2 9.0 3.5 1.3 4.2 9.0 8.4 4.2 10.1 22.7 8.4 4.2 10.1 22.7 (1) Urban: >15 000 inhabitants; Suburban: 2 500-15 000; Rural: <2 500
Per capita water availability
(m3/hab/year) Scarcity < 1000 Low 1000 - 5000 Fair 5000 - 10000 High > 10000
Per capita water availability
(m3/hab/year) Scarcity < 1000 Scarcity < 1000 Low 1000 - 5000 Low 1000 - 5000 Fair 5000 - 10000 Fair 5000 - 10000 High > 10000 High > 10000
Figure 1.1 depicts this irregular per-capita water availability along the country. It can be seen that in two of the 13 hydrologic regions, fresh water resources fall below the 1000 m3 per person per year, revealing a persistent scarcity situation. Five other hydrologic regions fall between 1,000 and 5,000 m3 per person per year, which indicates periodic and regular water stress.
As it was already pointed out, the climatic and topographic characteristics in Mexico are heterogeneous and these have an influence on the economic activity. Figure 1.2 highlights how both population and economic activity are inversely related to water availability in Mexico, since 32% of the runoff occurs where 77% of the population reside and 86% of the GDP is generated (Guerrero, 2002).
Figure 1.2 Water Availability and Economic Activity (Source: Guerrero, 2002).
68% 77% 86% 32% 23% 14% Runoff Population GDP Southeastern Mexico • 32% of runoff • 77% of population • 86% of G.D.P. • 92% of irrigation area Northwestern, Northern and Central Mexico 68% 77% 86% 32% 23% 14% Runoff Population GDP 68% 77% 86% 32% 23% 14% Runoff Population GDP Southeastern Mexico • 32% of runoff • 77% of population • 86% of G.D.P. • 92% of irrigation area Northwestern, Northern and Central Mexico
That is, population concentration and economic activity in the country take place in areas where water is right now scarce. Or maybe it obeys to the phenomenon that, on one hand, historically the population in Mexico has been concentrated in the central regions of the country, with development moving northward along central plateau; and on the other hand, the climatic aspect already mentioned, both facts have resulted in water availability problems.
Today, the population in Mexico is concentrated in large urban centers and is also scattered in smaller towns. Metropolitan cities like Mexico, Guadalajara and Monterrey concentrate more than 25% of total population of the country.
Consequently, surface runoff and ground water are less and less sufficient to sustain the population elevated growth rates and economic activity, resulting in over-pumped aquifers and in some cases a need to transfer water between river basins. Additionally, for some water bodies their potential use has been affected by pollution. Then, conflicts for the use of water have increased causing important political and social effects.
Most groundwater use takes place in the arid and semi-arid areas of central, northwestern and northern Mexico where the pumping/recharge balances are negative, with the consequent over-exploitation of numerous aquifers. Total annual abstraction of groundwater is around 27.4 km3, but there are already 97 aquifers over
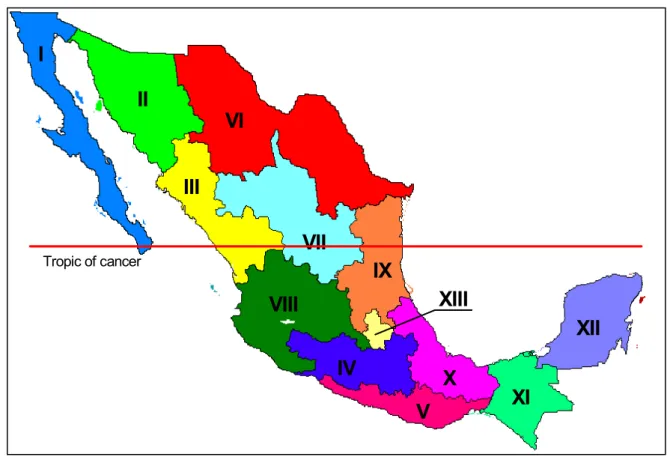
drafted. From them, 13 have additionally an intrusion salinity problem. The majority of these aquifers are located mainly in the northwestern and northern states, as well as in the Lerma-Balsas river basin in the central plateau. This river basin can be located in figure 1.3 as Region VIII Lerma-Santiago Pacífico. Figure 1.3 illustrates the hydrologic administrative regions that the National Water Commission in Mexico uses for water management.
Figure 1.3 Hydrologic-Administrative Regions (CNA 1999) (Source: IMTA, 1999) Therefore, groundwater has become fundamental for the Mexican economy and sustainable development. It represents the major or even the single source of water in the arid and semi-arid regions of the country. Table 1.3 summarizes water volume withdrawals for origin source, surface water and underground, and for type of water uses.
Table 1.3 Consumptive water uses in Mexico for 2001.
km3 % km3 % km3 %
Agricultural 36.8 82 19.6 71 56.4 78
Urban (domestic) 3.3 7 6.2 23 9.5 13
Industry (self-supplied) 5.0 11 1.6 6 6.6 9
Total 45.1 27.4 72.5
Water Use Surface water Groundwater Total
Source: CNA (2003a).
I Península de Baja California II Noroeste
III Pacífico Norte IV Balsas V Pacífico Sur VI Río Bravo
VII Cuencas Centrales del Norte VIII Lerma-Santiago-Pacífico IX Golfo Norte
X Golfo Centro XI Frontera Sur XII Península de Yucatán XIII Valle de México
I
II
III
IV
V
VI
VII
VIII
IX
X
XI
XII
XIII
Tropic of cancerI Península de Baja California II Noroeste
III Pacífico Norte IV Balsas V Pacífico Sur VI Río Bravo
VII Cuencas Centrales del Norte VIII Lerma-Santiago-Pacífico IX Golfo Norte
X Golfo Centro XI Frontera Sur XII Península de Yucatán XIII Valle de México
I
II
III
IV
V
VI
VII
VIII
IX
X
XI
XII
XIII
I Península de Baja California II Noroeste
III Pacífico Norte IV Balsas V Pacífico Sur VI Río Bravo
VII Cuencas Centrales del Norte VIII Lerma-Santiago-Pacífico IX Golfo Norte
X Golfo Centro XI Frontera Sur XII Península de Yucatán XIII Valle de México
I Península de Baja California II Noroeste
III Pacífico Norte IV Balsas V Pacífico Sur VI Río Bravo
VII Cuencas Centrales del Norte VIII Lerma-Santiago-Pacífico IX Golfo Norte
X Golfo Centro XI Frontera Sur XII Península de Yucatán XIII Valle de México
I
II
III
IV
V
VI
VII
VIII
IX
X
XI
XII
XIII
Tropic of cancerIn 2001, 72.5 km3 of water were used in the country for different consumptive
uses. Irrigation uses 78%, 13% goes for urban uses and only 9% is for industrial activities. From this national total extraction, 62% has a surface water derivation and 38% groundwater source. That is, more than one third of total water use (agricultural, municipal/domestic, and industrial) comes from groundwater utilization. Groundwater reliance is even higher in urban/domestic demand, which rises 65% above of their water requirements from this source. Around 75 million people depend on groundwater for their water supply. An important part of the renewable resources are left more or less untouched in the less developed southern regions where technical and natural barriers restrain the development of irrigated agriculture.
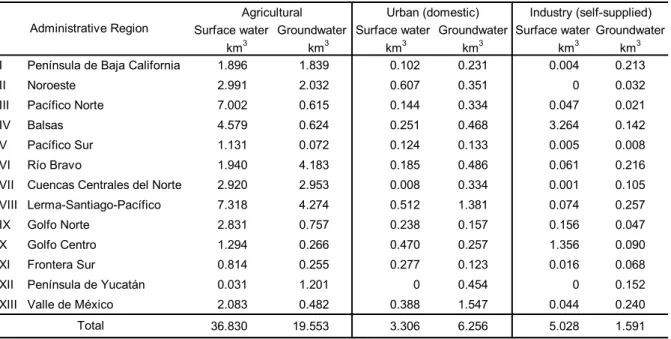
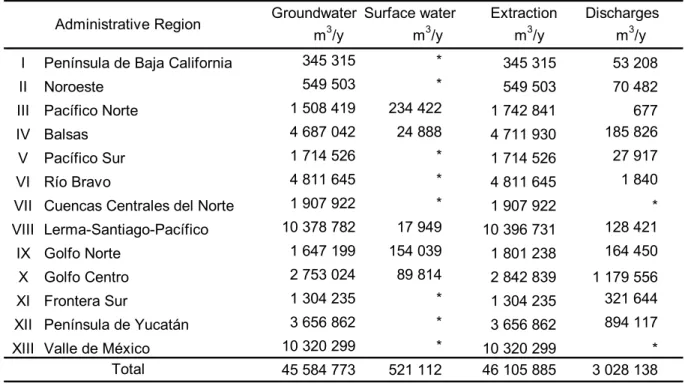
Table 1.4 shows the consumptive water use for each hydrologic administrative region by its origin source, surface water or groundwater, and for kind of use.
Table 1.4 Water extractions by region, source and type of use for 2001. Surface water Groundwater Surface water Groundwater Surface water Groundwater
km3 km3 km3 km3 km3 km3
I Península de Baja California 1.896 1.839 0.102 0.231 0.004 0.213
II Noroeste 2.991 2.032 0.607 0.351 0 0.032
III Pacífico Norte 7.002 0.615 0.144 0.334 0.047 0.021
IV Balsas 4.579 0.624 0.251 0.468 3.264 0.142
V Pacífico Sur 1.131 0.072 0.124 0.133 0.005 0.008
VI Río Bravo 1.940 4.183 0.185 0.486 0.061 0.216
VII Cuencas Centrales del Norte 2.920 2.953 0.008 0.334 0.001 0.105
VIII Lerma-Santiago-Pacífico 7.318 4.274 0.512 1.381 0.074 0.257
IX Golfo Norte 2.831 0.757 0.238 0.157 0.156 0.047
X Golfo Centro 1.294 0.266 0.470 0.257 1.356 0.090
XI Frontera Sur 0.814 0.255 0.277 0.123 0.016 0.068
XII Península de Yucatán 0.031 1.201 0 0.454 0 0.152
XIII Valle de México 2.083 0.482 0.388 1.547 0.044 0.240
36.830 19.553 3.306 6.256 5.028 1.591
Total
Source: CNA (2003a).
Administrative Region
Agricultural Urban (domestic) Industry (self-supplied)
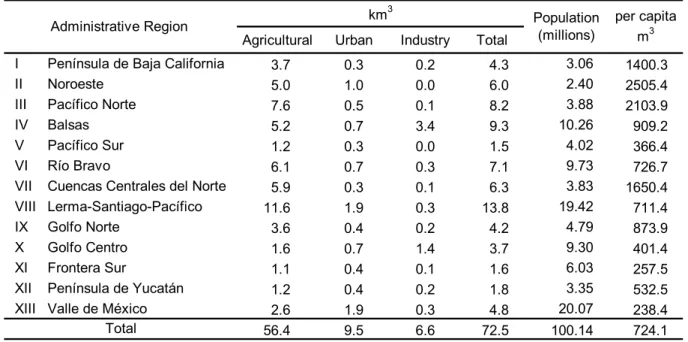
Table 1.5 displays total values corresponding to Table 1.4 by kind of user as well as the per capita extraction in cubic meters regarding total withdrawal by
administrative region. In Table 1.5 we note that the major per capita extractions are realized in the regions with lower per capita water availability. Figure 1.1 shows that Region VII Cuencas Centrales del Norte is in fact characterized as a region with scarcity water problems, since its per capita water availability is inferior to 1000 m3/inhab/year. Therefore its per capita extractions (1650m3) are grater than its per capita water availability.
Table 1.5 Per capita extractions in cubic meters by region for 2001.
Agricultural Urban Industry Total
I Península de Baja California 3.7 0.3 0.2 4.3 3.06 1400.3
II Noroeste 5.0 1.0 0.0 6.0 2.40 2505.4
III Pacífico Norte 7.6 0.5 0.1 8.2 3.88 2103.9
IV Balsas 5.2 0.7 3.4 9.3 10.26 909.2
V Pacífico Sur 1.2 0.3 0.0 1.5 4.02 366.4
VI Río Bravo 6.1 0.7 0.3 7.1 9.73 726.7
VII Cuencas Centrales del Norte 5.9 0.3 0.1 6.3 3.83 1650.4 VIII Lerma-Santiago-Pacífico 11.6 1.9 0.3 13.8 19.42 711.4
IX Golfo Norte 3.6 0.4 0.2 4.2 4.79 873.9
X Golfo Centro 1.6 0.7 1.4 3.7 9.30 401.4
XI Frontera Sur 1.1 0.4 0.1 1.6 6.03 257.5
XII Península de Yucatán 1.2 0.4 0.2 1.8 3.35 532.5 XIII Valle de México 2.6 1.9 0.3 4.8 20.07 238.4 56.4 9.5 6.6 72.5 100.14 724.1
km3
Source: CNA (2003a)
Administrative Region Total per capita m3 Population (millions)
Even though the watercourse uses, for example hydroelectric power generation, it does not reduce the amount of the water available for other uses, they do engage large amounts of water, 145 km3 for year 2001 (CNA, 2003a).
Comparing values from table 1.4 with the hydrologic regions from figure 1.3, we see that for Region XII, underground water is the principal source for all its uses, since only 0.031km3 come from surface derivation for agricultural use. Region VII supplies water for urban and industry uses just from groundwater. The same behavior is shared by Regions I and II regarding their industrial use. And from figure
1.3 it is clear that those regions placed above Tropic of Cancer are the principal underground water users. Excepting Region XII, where their specific soil characteristics move them to take water, mainly, from their underground resources.
Agricultural users are supplied principally from surface source (65%). From the total national water used by industry, Region IV –Balsas, takes 52%, from which 96% comes from surface origin. Taking out this Region, the origin source for industry is pretty similar, 1.77km3 from surface water, 1.45km3 from groundwater. The larger urban water users are Region VIII and XIII. Mexico City is placed in the former. These two regions take 47% of total urban water from underground origin.
Due to over extraction, groundwater non-renewable reserve is being mined at a rate of approximately 8 km3 per year. Accelerated dropping of underground water tables increases the costs of extraction. Similarly, excessive exploitation has caused seawater intrusion problems in coastal aquifers.
Table 1.6 Principal Water Use (consumptive use).
Agricultural Urban Industry
Brazil 55 61 21 18
Canada 45 9 11 80
China 526 77 5 18
Egypt, Arab Rep. 55 86 6 8
Spain 36 69 13 18 United States 448 27 8 65 France 41 12 15 73 Indonesia 74 93 6 1 Mexico 73 78 13 9 Turkey 36 73 16 11 Country Total Water Extraction (km3) Use (%)
Following with the type of water users, Table 1.6 presents the principal uses for 10 different countries. Canada, France and United States, the industrialized ones, present an inverse behavior regarding the others countries, since they are the solely where the industry takes more than 65% of total water withdrawal. In the other countries, irrigation for agriculture is the principal user.
The previous water balance in Mexico does not reflect the problems that affect an important number of aquifers and river basins. An important fact to mention is that the average water use efficiency in irrigation is around 46%, and from total water withdrawn to public water supply, conduction losses varies between 30 and 50% (CNA, 2000). Presently, regional water balances in over half of the territory show considerable deficits (see figure 1.1). But certainly, growing water pollution has decreased the possible exploitation of several rivers and water bodies. From total surface water bodies, in December 2001, just 26% were classified as non-polluted or with acceptable quality level. 51% were considered poorly contaminated, 16% polluted and 6% with a high pollution level. The remaining water bodies have toxic presence (CNA, 2003a)
The major reason of pollution is the discharge of solid wastes and residual water emission not collected by sanitation systems. Most of the aquifers with pollution problems are located near major urban population centers. Main water bodies have been polluted because of untreated municipal and industrial wastewater emissions. The nearly 200 thousand geographically dispersed rural communities throughout the country have become a technical problem to provide water and sanitation to rural population.
In the last decade nearly 19.7 million people were added to public water supply systems and 20 million to sanitation systems --compared with a population growth of 15 million people in the same period of time,-- almost 12% of the population still do not have access to safe drinking water and 24% to adequate sanitation (CNA,
1999b). The present use patterns and withdrawals may not be sustainable, and water scarcity can become the limiting factor to economic growth.
Table 1.7 presents these values compared with the covering of potable water and sewerage system in the same 10 countries before analyzed. From this sample of countries, Indonesia has the lowest level for potable water (69%), while the other countries supply more than 80% potable water. With respect to sewerage system, China is the one with critical sanitation problems since only cover 21% of the population, followed by Indonesia with 54%.
Table 1.7 Potable Water and Sewerage System. Country Potable Water (%) Sewerage System (%)
Brazil 82 67
Canada 99 95
China 90 21
Egypt, Arab Rep. 94 87
Spain 99 100 United States 100 100 France 100 79 Indonesia 69 54 Mexico 88 76 Turkey 80 87
Source: CNA (2003a).
Of course it is well known that growth and concentration of population and economic activity are definite factors generating water unbalances, but it is also irrefutable that water deficits have a direct consequence of a series of inefficiencies accumulated over the last decades. But also, a water price which does not reflect the correct value of the resource will lead to inefficiencies in the allocation of the resource, as well as affect the quantity and quality of the water services.
1.2 Water management reforms in Mexico
Practically all people involved with the analysis of water resources has pointed out that water is less available every day. Conflicts among water consumers increase since each time there exist more users, mainly because of population growth, and for different reasons there is less water (quality diminution, aquifers over-exploited, low efficiency allocation etc.). Since water, each time is scarcer in quantity but also in quality around the world, then, managing water has become not only an activity for monitoring both demand and supply of water. Countries like Kuwait, Qatar, and Jordan manage the small quantity of water they have in a very strict sense to be efficient, since the access to alternative sources of water is gradually more complicated. For example, around the world, these three countries are the ones with greater percentage (from 20 to 30) of reclamation water with reference to their respective withdrawn water (Segui, 2004). Understanding reclamation water as the activity where that water already used in previous activities is treated and reused again. That is, reclamation water is the wastewater treated that satisfy the quality to be used again (Segui, 2004).
The purpose of water resources management is not simply to provide water in the quantity and quality desired. Water also has ecological, recreational and social values that need to be taken into consideration.
In Mexico, since 1946, water management has been under a sole authority. But, the modern water policies in Mexico have their roots in the 1917 Constitution's fundamental declaration that the resource is a national property which can only be used through proper authorization by the corresponding Federal Authority. But in chronological order, the first important legal water text was the 1910 Water Law (Saade, 2003).
1.2.1
Institutional framework
In this thesis work, water institution is considered not just as a fixed organization. It is considered in a wider sense, in the same sense Saleth and Dinar (2000) conceptualized it, “as an entity defined interactively by its three main analytical components, i.e., water law, water policy, and water administration”.
Water policies and management in Mexico have traditionally been "top-down" and centralized government activities coming from Mexico City1. A series of laws, regulations and institutions have arisen over the last ninety years to define the scope of Government intervention, as well as the rights and obligations of individuals and organizations, public or private, that wish to use the national water.
Different reforms to manage water have been taken. Summarizing, in 1926 the Law for Irrigation with Federal Water is decreed giving origin to the National Irrigation Commission (CNI, in Spanish). In 1934 and 1936 the Law of Water of National Property and its bylaw were decreed. In 1946 the Ministry of Water Resource took the place of the National Irrigation Commission. Between 1940 and 1960 Sector and Regional Plans were made to improve the use of water. In 1956 and 1958 the Law and its bylaw of exploitation of subsoil water (groundwater) were established, beginning to regulate the extraction and use from this source (Ortiz, 2001). In 1971 Environmental regulations were implemented.
A Federal Law of Waters was approved in 1972 which comes to support the legal framework for water management by creating a centralized system of permits and concessions for water use. It defines a set of regulations and controls for water use, including water allocation priorities. This law was the basis of the first National Water Plan in 1975 (Saade, 2003). This Plan was made in a unified vision sense.
1 The political administration in Mexico is organized, at the top, by Federal Government, next the States Government (31),
In 1980 a project to fix quotas for water was formulated. Since 1983 municipalities are in charge of the services of public water supply and both wastewater collection and subsequently treatment. Since then, the creation of water utilities has been promoted, in order to separate these activities from others that are carried out by the municipalities.
The creation and consolidation of water utilities support a greater participation of local authorities in water management and on the other hand separates water budget from general municipal finances. In most of the cases water utilities have a poor performance and need to be greatly improved to achieve technical and economical sufficiency.
The States Government role in the water sector is, principally, restricted to regulate public water supply and sanitation services, and in some cases to support the municipalities with low technical and economical performance. State legislation, which regulates social and private sector participation in the water industry, establishes the basis for the creation of water utilities and sets the rules to fix water tariffs. The Federal Government has promoted variation in state laws to encourage the participation of State Governments in all water sector activities and not only in public water supply and sanitation services; however, only a few states have changed their laws.
In 1982 the Federal Law of Water Rights was established. It was updated in 1985 and reformulated in 1986. Since 1989 with the National Water Commission (CNA) creation, it is adjusted annually to respond to the new requirements of the sector.
An important break-point was made in 1989 when the National Water Commission (CNA) was created, by Presidential Decree, as an autonomous agency attached to the Ministry of Agriculture and Water Resources, to become the sole federal authority dealing with water management, thus responding to growing institutional problems
and to the need of reinforcing water policies and strategies. In 1994, the National Water Commission was functionally re-allocated within the then newly created Ministry of Environment, Natural Resources and Fisheries (SEMARNAP), nowadays Ministry of Environment and Natural Resources (SEMARNAT).
CNA is the federal agency in charge of defining water policy, granting permits to withdraw water and to discharge wastewater, establishing national standards for the use of water, and integrating national and regional master water plans.
The responsibilities of the Commission include:
• Define the country's water policies, and formulate, update and monitor the implementation of the National Water Plan, as well as the associated regional water plans.
• Measure water quantity and quality, and regulate water use.
• Preserve and upgrade water quality in the national rivers and water bodies.
• Allocate water rights to users, and grant the corresponding concessions and permits.
• Plan, design and construct the waterworks carried out by Federal Government in the water sector, excepting those under Federal Power Commission responsibility.
• Regulate and control river flows, and guarantee the safety of major hydraulic infrastructure.
• Provide technical assistance to users and promote the efficient use of water, in quantity and quality.
• Define and, if necessary, implement the financial mechanisms to support water development and the provision of water services.
As early as 1990, the necessary studies were carried out to design a new legal instrument. The National Water Law, authorized in December of 1992, provided a modern regulatory framework for water management. It reinforced the institutional
setting for water management, by strengthening the role of the National Water Commission as the country's sole Water Authority, in charge of managing the resource, both in quantity and quality.
The bylaw of the National Water Law was approved in January of 1994.
It is worth mentioning that the National Water Law explicitly declares sustainable development as its primary objective. The Law promotes decentralization, stakeholder participation, more control of water withdrawals and wastewater discharges, efficient use of water, greater private sector participation, and establishment of economic instruments and fiscal policies related to the collection of water levies for both water use and water pollution control.
Mexico's new structure for the conceding and allocating of water rights lies in the combined use of regulatory and economic instruments or incentives, which are embodied in the National Water Law and other water related fiscal laws. According to the new legal framework derived from the National Water Law, water management now rests on two basic principles: First, a license or concession is needed for everyone, public or private, to use the Nation's waters, and a subsequent permit is required for discharging waste water into the Nation's rivers or injecting them into the ground. And second, those who benefit from water abstraction or those using the water courses to dispose of waste waters have to contribute to resource management and development, and to water quality restoration and improvement, in proportion to their water consumption or to the amount and characteristics of the waste waters they discharge.
So, in that way, conceding water rights (water use concessions) and allocating discharge permits are clearly regulated, since legal rights and obligations are well defined. Transmission of water rights are also allowed and regulated.
A Public Registry of Water Rights is established to ensure legal confidence of the water rights, to solve problems associated with third party effects, and to provide the flow of information needed for "regulated water markets" to operate. The National Water Commission, on the other hand, is empowered to act as an arbiter and conciliator in the resolution of conflicts, to establish water reserves, and to allocate the resource through the request of water rights. In 2001 there was an estimate of 437 thousand water users (CNA, 2003a). Major efforts have been dedicated to the registration of all of them and the amount of water they withdraw, through the Public Registry of Water Rights (REPDA – Registro Público de Derechos de Agua). The Public Registry of Water Rights is already operational and most existing users, water withdrawals and pollutant dischargers have been regularized. 97.5% of water users have been registered up to December 2001.
The National Water Law allows the transfer of water rights from one user to other. Nevertheless, the fact that some users are not registered has delayed the operation of water markets. Most water right transactions are performed in a year-to-year basis. Preliminary works for the enforcement of the new system of water rights through concessions and discharge permits were completed in 1994, although the process of recognizing existing water rights is still in process.
Agricultural Sector deserves a special consideration, since agriculture has been a traditional activity in Mexico. Lately, it has suffered a variety of essential changes along with them, the use of water. The Agricultural sector administration has varied widely. The ejido, or communally farmed plot, emerged as the unique Mexican form of redistributing large landholdings. Originally, the state retained title to the land but granted the villagers, now known as ejidatarios, the right to farm the land, either in a collective manner or through the designation of individual parcelas (plots). Ejidatarios could not sell or mortgage their land but could pass usufruct rights to their heirs. Ejidatarios had to work their land regularly in order to maintain their rights over it.
Mexican administration has changed extensively in the importance accorded to the ejido. During the 1920s and early 1930s the ejido was viewed as a transitional system that would lead to small private farms nationwide. From the 1940s through the 1970s, the government favored large-scale commercial agriculture at the expense of the ejido.
Confronted with the dysfunctional character of much of Mexican agriculture, the government in 1992 radically changed the ejido land tenure system, codifying some existing actions that were against the law but widely practiced and introducing new characteristics. Under the new law, an ejido can grant its members individual titles to the land, not merely usufruct rights to their plots. Ejidatarios can, in turn, choose to rent, sell, or mortgage their properties. The ejidatarios do not need to work their land to maintain ownership over them. They also may enter into partnerships with private entrepreneurs. Finally, the processing and resolution of land disputes are decentralized.
Currently, the concession of water rights in the agricultural sector may adopt one of next four forms:
i) Water rights settled through concessions to single individuals for the use and exploitation of the water resources for farming purposes, or to enterprises for the administration and operation of irrigation systems or the shared use and exploitation of common water sources for agricultural purposes.
ii) Water rights settled to ejidos and rural communities in coordination with legal dispositions deriving from the new Agrarian Law.
iii) Water rights settled to irrigation units, as defined by the previous water law. iv) Water rights settled to public irrigation systems.
Since 1989 the Federal Government started the transference of operation and maintenance activities of Irrigation Districts to User Associations. The Irrigation Management Transfer Program (Programa de Transferencia de los Distritos de
Riego) establishes new forms of organization and user representation. The Water User Associations, WUA, are organizations whose main function is the operation, maintenance, and management of the irrigation infrastructure. They can be established as civil associations and granted certain fiscal privileges. The Board of Directors of these associations is selected by the Assembly comprised of water users of the irrigation modules in the irrigation districts or units.
The National Water Commission concedes volume water rights to the irrigation districts. In those irrigation districts where management has been transferred to users, the concession that allocates water rights is accompanied by a concession to administer the corresponding public infrastructure. Water users are organized in water user associations, one for each irrigation module, as defined by the National Water Commission.
The water concession (water rights) granted by the government to the irrigation districts is part of the general agreement between the government and each module. As such, water users do not have individual water rights but instead each association has a proportional right (the proportion is based on area) to the supply of water (normally the estimated surface supply) available to the district for any given season. In the same sense, members of a module have the right to use a proportion of the volume allocated to it and according to their registered area. Concessions are granted for a fixed time frame, 5 to 50 years, and can be taken away if an association does not fulfill his agreement with the government. Concessions are not for a fixed volume of water but are for the use of a proportion of the available water supply. Therefore, the associations do not have a fixed, volumetric water right.
The National Water Commission has the necessary authority to resolve any conflict that may originate concerning individual water rights, or volume water rights allocated to the modules. Water rights may be transferred within each module according to the regulations approved by the Commission. Transfer of water rights
among modules is subject to the regulations established for the irrigation district as a whole. Transfer of water rights outside the irrigation district can only be transferred previously authorized by the National Water Commission.
Out of the 84 Irrigation Districts (3.4 millions hectares) that exist in Mexico, 78 have been fully transferred and 4 partially, covering 99% of the total irrigated area in Irrigation Districts (CNA, 2004). The transfer of irrigation districts to the Water User Associations (WUA) ensures a greater participation of agricultural users in water management and gradually reduces the economic subsidies from the government to this sector. This program is a novelty and it has been taken as a reference worldwide (Johnson III, 1997).
1.2.2
River Basin Councils
Organizing water management from a basin approach obeys to the logic of taking into account the natural characteristics that water flows follow, which do not respect administrative boundaries. In Mexico, water was managed using ‘political’ boundaries up to the year 1998. It is pointed out ‘political’ since the administrative National Water Commission offices were delimited by the Mexican political division, i.e., by states. Figure 1.4 shows the six regional offices that in 1989 the National Water Commission used to manage water.
These boundaries were changed in May 1998. A new number, location and limits of the National Water Commission (CNA) regional offices were published, and updated in January 1999 (CNA, 1999a). The new limits were defined by hydrologic criteria, giving place to a new water management organization in Mexico. The country is divided into 13 hydrographic administrative regions and a CNA office has been established for each of the regions. It is important to note that the CNA regional offices work under a watershed approach, where each one of the regions is composed by one or more basins. (See figure 1.3). National Water Commission
regional offices are responsible of most water management duties while its central offices will be responsible of establishing general guidelines and standards.
Figure 1.4 Regional offices in 1989 (CNA) (Source: CNA, 2002).
The promotion of stakeholder participation in the water sector is visualized in the Law with the creation of River Basin Councils, which are forums where Federal, State and Municipal governments, the water users and other stakeholders can share the responsibility of planning and managing the basin's water resources. River basin planning and coordination is guaranteed with the new organization of the National Water Commission. This new organization allows for a better interaction with local stakeholders and facilitates coordination with river basin councils.
The National Water Law commands the establishment of the River Basin Council, in order to facilitate the coordination of hydraulic programs and policies with the three
I Northwest II North III Northeast IV Lerma-Balsas V Valle de Mexico VI Southeast I Northwest II North III Northeast IV Lerma-Balsas V Valle de Mexico VI Southeast