HAL Id: hal-01609060
https://hal.archives-ouvertes.fr/hal-01609060
Submitted on 3 Oct 2017HAL is a multi-disciplinary open access archive for the deposit and dissemination of sci-entific research documents, whether they are pub-lished or not. The documents may come from teaching and research institutions in France or abroad, or from public or private research centers.
L’archive ouverte pluridisciplinaire HAL, est destinée au dépôt et à la diffusion de documents scientifiques de niveau recherche, publiés ou non, émanant des établissements d’enseignement et de recherche français ou étrangers, des laboratoires publics ou privés.
The r 22 electro-optic coefficients in indium-doped
congruent lithium–niobate crystals
Mustapha Abarkan, Anush Danielyan, Sasha Sewastianow, Michel Aillerie,
Nicéphore Théofanous, Sergey Kostritskii, Edvard Kokanyan
To cite this version:
Mustapha Abarkan, Anush Danielyan, Sasha Sewastianow, Michel Aillerie, Nicéphore Théofanous, et al.. The r 22 electro-optic coefficients in indium-doped congruent lithium–niobate crystals. NAMES’16 - New Achievements in Materials and Environmental Sciences, Nov 2016, Nancy, France. �10.1088/1742-6596/879/1/012005�. �hal-01609060�
This content has been downloaded from IOPscience. Please scroll down to see the full text.
Download details:
IP Address: 82.236.242.36
This content was downloaded on 02/09/2017 at 17:14 Please note that terms and conditions apply.
The r22 electro-optic coefficients in indium-doped congruent lithium–niobate crystals
View the table of contents for this issue, or go to the journal homepage for more 2017 J. Phys.: Conf. Ser. 879 012005
(http://iopscience.iop.org/1742-6596/879/1/012005)
Home Search Collections Journals About Contact us My IOPscience
You may also be interested in:
The clamped and unclamped effective electro-optic coefficients of zirconium-doped congruent lithium niobate crystals
Mustapha Abarkan, Anush Danielyan, Ninel Kokanyan et al. The signs of the electro-optic coefficients for lithium tantalate B Luther-Davies, P H Davies, V M Cound et al.
The Magnesium Diffused Layer Characteristics of a Lithium Niobate Single Crystal with Magnesium-Ion Indiffusion
Wenxiu Que, Siakpiang Lim, Liangying Zhang et al.
Refractive Index Profiles of Ion-Implantation Waveguides Formed on Lithium Niobate and Lithium Tantalate Crystals
Fei Lu, Ming-Qi Meng, Ke-Ming Wang et al. The r33 electro-optic coefficient of Er:LiNbO3 A Petris, S Heidari Bateni, V I Vlad et al.
The signs of the electro-optic coefficients for lithium niobate K F Hulme, P H Davies and V M Cound
Self-confined beams in erbium-doped lithium niobate M Alonzo, F Pettazzi, M Bazzan et al.
1
Content from this work may be used under the terms of theCreative Commons Attribution 3.0 licence. Any further distribution
of this work must maintain attribution to the author(s) and the title of the work, journal citation and DOI. Published under licence by IOP Publishing Ltd
1234567890
NAMES'16 IOP Publishing
IOP Conf. Series: Journal of Physics: Conf. Series 879 (2017) 012005 doi :10.1088/1742-6596/879/1/012005
The r
22electro-optic coefficients in indium-doped congruent
lithium–niobate crystals
Mustapha Abarkan1,2,*, Anush Danielyan2,3,4, Sasha Sewastianow2,3, Michel
Aillerie2,3, Nicéphore Théofanous5, Sergey Kostritskii6, Edvard Kokanyan4,7 1Université Sidi Mohammed Ben Abdallah - Fès, LSI, Taza-Gare, Morrocco. 2Université de Lorraine, LMOPS, EA 4423, 57070 Metz, France.
3Centrale Supélec, LMOPS, 57070 Metz, France.
4Institute for Physical Researches, National Academy of Sciences of Armenia,
Ashtarak-2, Armenia.
5University of Athens, Dept. Informatics and Telecommunications, 15784, Athens,
Greece.
6RPC Optolink, Sosnovaya al. 6, bd.5, Zelenograd, 124489, Moscow, Russia. 7Armenian State Pedagogical University, Yerevan, Tigran Mets Ave., 17, Armenia.
E-mail: mustapha.abarkan@usmba.ac.ma, aillerie@metz.supelec.fr
Abstract. The high- and low- frequency electro-optic coefficients r222 of In-doped lithium niobate (LN) and the corresponding dielectric permittivity as well, have been experimentally determined and compared with the results obtained in undoped congruent LN crystals. Compared to pure congruent lithium niobate, a low acoustic contribution of the electro-optic and dielectric properties are originally found in indium (In)-doped congruent lithium niobate (LN:In) crystals in the low indium concentration range [0.12-1.7 mol%]. All reported results confirm that the LN:In is a very promising candidate for several non-linear devices as Pockels cells for laser Q-switching.
1. Introduction
It is now well established that the electro-optic effect is one of the most convenient properties that is could be exploited to obtain fast Q switching. Although, LiNbO3 (LN), LiTaO3 (LT), KTiOPO4
(KTP) and BaB2O4 (BBO) are widely used as Pockels cells for laser Q-switching [1, 2]. LiNbO3 offers
good transmission and high extinction ratio with modest half-wave voltage in transverse configuration r22 and it is not hygroscopic [3]. When it is grown in its usual composition, i.e. congruent composition,
it suffers of a relatively low optical damage threshold being a major drawback of a LN Pockels cell [4]. It can be noted that this low optical damage threshold is related to high photorefractive sensitivity interesting for holographic applications. Thus, for the realization of integrated devices based on this property, LN crystals in congruent composition or doped with metallic ions are good candidate [5-9]. On contrary, the low optical damage threshold generally observed in LN crystals limits the use of LN in high power laser systems [10]. Nevertheless, doping by ions of transitions elements or rare earths makes possible to modify the physical properties and seems to be a way to mitigate this problem. The optical damage threshold is considerably increased in stoichiometric LN and in congruent LN doped with specific ions, as it depends on the amount of intrinsic defects present in the lattice. Some
1234567890
NAMES'16 IOP Publishing
IOP Conf. Series: Journal of Physics: Conf. Series 879 (2017) 012005 doi :10.1088/1742-6596/879/1/012005
researches point out that divalent ion such as Mg2+ [11-16] and Zn2+ [17-19] and more recently
tetravalent ions as Hf [20-26] and Zr [27-32] can improve the optical damage resistance of LN crystals for specific concentrations. It was found a threshold concentration around [Hf] = 2 mol% in the melt to lead a significant increase of the photorefractive resistance and it has been found that the light-induced birefringence changes of LiNbO3 crystal doped with 4 mol% of HfO2 were comparable to that of 6
mol% MgO doped crystals [23]. It was also shown the existence of a threshold concentration around 2.0 mol% in zirconium doped LN crystals. Moreover, hafnium and zirconium ions have the advantage to possess a distribution coefficient near one at the threshold concentration. Therefore, high quality crystals can be grown easier than the usual LN:Mg crystal with 6% of MgO having a distribution coefficient closer to 1.2 [26]. This fact suggests that Hf and Zr might represent an excellent alternative for obtaining higher optical damage resistance crystals with high optical quality [27-32]. It was proved that the EO coefficients reveal a small dependence on the Hf and Zr content introduced in the LN lattice with just a kink at 2.0 mol% attributed to the strain contribution related to the introduction of Hf and Zr ions, respectively [23, 27, 28]. Otherwise, if compared to undoped congruent crystal, the hafnium and zirconium doped lithium niobate crystals present the advantage to have smaller optical damage, especially for concentration equal to 2.0 mol%, and therefore should be more suitable for EO and NLO applications [26, 29]. In these divalent and tetravalent-doped LN crystals, electro-optic behaviors were studied and the obtained results largely confirm the threshold in dopant concentrations mentioned above and as observed experimentally by other techniques. Nevertheless, only few studies mentioned the doping of LN with trivalent ions such as Sc3+ and In3+ in the aim of increasing the
damage threshold for EO and NLO applications [33, 34].
Concerning this last point, we remember that piezoelectric ringing in LiNbO3 crystal in r22
configuration is big, as evidenced by comparison to the rc configuration. It has been proved that in
LiNbO3 Pockels cells the applied voltage induces a mechanical compression of the crystal via the
piezoelectric effect, which remains for some interval of time after the voltage has been removed, creating an additional birefringence modulation via the elasto-optic effect. A polarization sensitive element inside the cavity transforms this modulation into an additional time-dependent cavity loss. The acoustic oscillations following the initial relaxation of the compression were considered irrelevant for Q switching due to their long periods, on the order of 2 µs [1]. Abarkan et al. [35, 36] showed that the resonances amplitude have diminuend when the pulse duration is short (less than 100 ns).
In the present work we report, as function of indium concentration, experimental results and analysis obtained in the characterization of the EO coefficients r222T and r222S mainly involved in
Q-switch laser applications. The coefficient r222 is obtained when a light-beam is propagating along the
optical axis (c-axis) of the crystal and, therefore with an optical polarization of the transmitted beam in the isotropic plane, which renders it unaffected by the temperature dependence of the birefringence within this configuration. The EO results would be then discussed. To complete the study, we have measured the frequency dependence of the corresponding dielectric permittivity ε22 and finally
established the figure of merit allowing the comparison between materials, used as modulator, dedicated for Q–switching applications.
Five samples were grown by the Czochralski growing method from a congruent melt with various concentrations of In2O3 (0.12%, 0.25%, 0.5%, and 1.7%) corresponding to 0.24, 0.5, 0.9, and 2.1 at%
in the crystal [33]. These crystals were considered for comparison and discussion, with a congruent lithium niobate and a Zr doped lithium niobate crystals grown from a melt with a concentration of 2mol% of ZrO2 [27, 28]. It is to be of note that the Zr doped sample was chosen as its concentration of
dopant, 2 mol% of ZrO2 corresponds to the threshold concentration where the optical damage is the
smaller in Zr doped lithium niobate series [37]. All samples were prepared, cut and polished at optical grade.
2. Electro-optic measurements
According to [38, 39], we remind that the linear or Pockels EO coefficients in dielectric materials may be described as
3
1234567890
NAMES'16 IOP Publishing
IOP Conf. Series: Journal of Physics: Conf. Series 879 (2017) 012005 doi :10.1088/1742-6596/879/1/012005
rT = ra + rS. (1)
In this relation, rT is the EO coefficient for the unclamped sample characterized under low-frequency
electric field or DC electric field, ra is the acoustic or piezo-optic contribution related to the crystal
deformation via the piezo-electric and the elasto-optic effects, and rS is the corresponding EO
coefficient for the clamped sample measured at high frequency electric field.
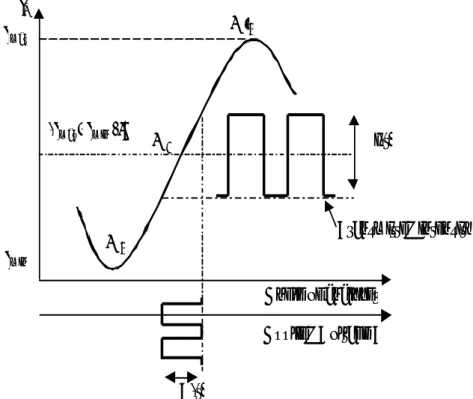
For EO measurements, optical interferometric and ellipsometric arrangements can be used. In the current contribution, we used the ellipsometric one with an experimental setup based on the Sénarmont setup [38]. The transfer function is presented in figure 1.
The point M1 located at 50% transmission (Imax-Imin)/2 point corresponds to the so-called linear
working point. When a sinusoidal electric field is applied on the sample under tests, this point is associated with the “Modulation Depth Method” (MDM) [38] and can be used to determine the EO coefficient as a function of frequency from DC to 1 MHz. This maximum frequency limit is defined by the specifications of power supply and signal acquisition electronic apparatus used for these experiments. In this method, the peak-to-peak amplitude ipp of the modulated signal is measured at the
point M1, and the EO coefficient is directly obtained from the following equation [38]:
, (2)
Here, I0 = Imax–Imin represents the total intensity shift of the transfer function, L is the length of the
crystal along the beam-propagation direction, d is the sample thickness along the applied electric field direction, neff is the effective refractive index, λ is the laser wavelength and Vpp is the peak-to-peak
value of the applied ac field at the frequency ν.
The M1 point can be also associated to a method called “Time Response Method” (TRM) [39]. The
shapes of signals involved in this method are represented in figure 1. In this method, time signals Δi(t) and ΔV(t) are displayed and measured on an oscilloscope screen. To obtain the various contributions of the EO coefficient this method is associated with performing power supply and oscilloscope i.e. apparatus allowing very short rising-time. At the working point M1, the instantaneous variation of the
transmitted beam intensity Δi(t), induced by the applied voltage ΔV(t) on the crystal, is given by:
, (3)
where⊗ is the convolution operator and reff(t) is the instantaneous value of the EO coefficient.
The Z-transformation of these signals allows the determination of the frequency dependence of the response Δi(ν) with the applied voltage ΔV(ν). Thus, the EO coefficients can be derived within the use of the same equation 2 as established in the MDM method. This allows the full determination of the frequency dependence of the EO coefficients, possibly above their acoustic resonance if special attention is taken in the choice of apparatus. The optical response at short time leads to the clamped (high frequency) coefficient rS, while the optical response at longer time provides the unclamped (low
frequency) coefficient rT. reff(ν) = 2λd πneff 3 I 0L ipp(ν) Vpp(ν) Δi(t) = πneff 3 LI 0 2λD reff(t)⊗ ΔV(t)
1234567890
NAMES'16 IOP Publishing
IOP Conf. Series: Journal of Physics: Conf. Series 879 (2017) 012005 doi :10.1088/1742-6596/879/1/012005
Figure 1. Optical transmission function of Sénarmont setup versus the analyzer β and applied voltage V. The point M0 is the minimum transmission point for which the output
optical signal has a frequency twice the frequency of the applied electric field. M1 is the
50% transmission point yielding the linear replica of the ac voltage.
In practice, we have shown that this technique allows obtaining the frequency dispersion of the EO coefficient from DC up to at least 500 MHz, mainly limited by the rising time of the voltage pulse [38]. It is to be mentioned that the values of the coefficients obtained by these techniques are absolute values.
For the specific experiments that are concerned by this work, electro-optic measurements were carried out by both MDM and TRM methods presented above. Within experiments devoted to the determination of the EO coefficient r222 the beam propagates along the c-axis of the sample and an
external electric field was applied along the a-axis (or equivalently the b-axis).
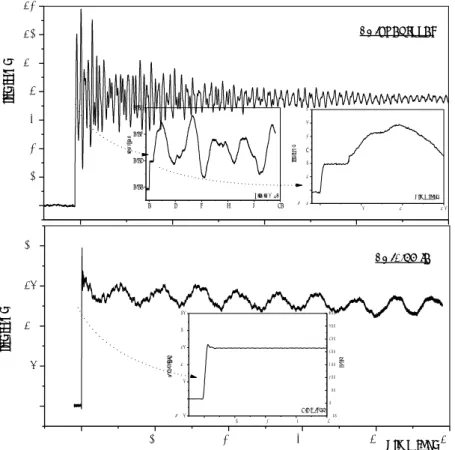
The measurements were carried out at room temperature using a He-Ne laser (λ = 633 nm). In the MDM method, we used an ac voltage of 220 V peak-to-peak at 1kHz, whereas in the TRM method, a pulse of amplitude equal to 700 V was applied onto the sample. Within these conditions, the sample dimensions and the performing optical and electric arrangements used for the experiment, the final uncertainty is in the order of 6% on the EO coefficients. Moreover, in the limit of the accuracy of the methods, no additional physical effects, as the distortion of the laser beam due to photorefractive effect or the presence of the quadratic electro-optic effect that could disturb the measurements were detected. Figure 2 shows the recording of the optical signal measured in the 1.7 mol%-In doped LN and LN in congruent composition samples at different time within the TRM method.
Transmitted intensity
M
1M
0M’
0I
max( I
max- I
min)/2
I
minI
MAngle of analyzer β
Δi(t)
ΔV(t)
Applied Voltage V
5
1234567890
NAMES'16 IOP Publishing
IOP Conf. Series: Journal of Physics: Conf. Series 879 (2017) 012005 doi :10.1088/1742-6596/879/1/012005
Figure 2. Responses Δi(t) to a step voltage ΔV(t) at different time scales in the case of the EO coefficient r222 in 1.7%-In doped LN single crystal and in LN in congruent
composition. Measurements were performed at the wavelength of 633nm.
In the long-time range, the optical signal oscillates with periods corresponding to the main piezo-electric frequency resonances. In the short time, the inset of figure 2 illustrates the EO response for a small time scales. For this time the oscillations do not exist since the acoustic waves need more time to propagate across the crystal. Contrary to LN in congruent composition, no difference in the level of the signal in the two time ranges is observed with In doped LN sample pointing out the negligible amplitude of the acoustic contribution.
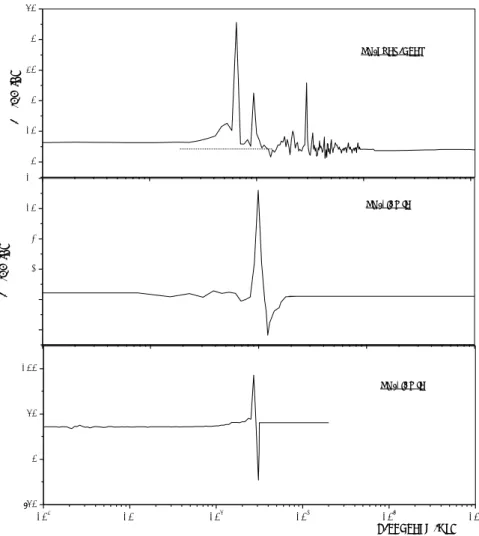
The frequency dispersion of the EO coefficient r222 is calculated according to equation 2. As shown
in figure 3, the frequency dependence of the EO coefficient r222 of the crystal is flat on both sides of
the piezo-resonances, giving, for this crystal doped with 1.7 mol% of indium the values of the EO coefficient at high frequency r222S = 4.4 ± 0.4 pm/V which is identical to the value at low frequency
r222T = 4.6 ± 0.4 pm/V which are also in a good agreement with those measured with the MDM method
(see table 1). 0,00 0,02 0,04 0,06 0,08 0,10 0,12 0,14 0 20 40 60 80 100 0,00 0,05 0,10 0,15 0,20 L N-1.7% In 0 2 4 6 8 10 0,00 0,02 0,04 0,06 Δ i( t) ( a .u ) Time (µs) 0,0 0 ,5 1,0 1,5 -0,0 1 0,0 0 0,0 1 0,0 2 0,0 3 0,0 4 0,0 5 0,0 6 Δ i( t) ( a .u ) T im e (µs ) Δ i( t) ( a. u ) L N-c ong ruent 0,0 0,2 0,4 0,6 0,8 -0,05 0,00 0,05 0,10 0,15 0,20 0,25 -100 0 100 200 300 400 500 600 700 Δi( t) ( u. a. ) T ime (µs ) Δ V( V) T im e (µs ) Δ i( t) ( a. u )
1234567890
NAMES'16 IOP Publishing
IOP Conf. Series: Journal of Physics: Conf. Series 879 (2017) 012005 doi :10.1088/1742-6596/879/1/012005
Figure 3.The frequency dispersions of the EO coefficient r222in the 1.7 mol% In-doped
LN crystal and Congruent LN. Comparison of the frequency dispersions of the dielectric permittivity ε2 and of the EO coefficient r222 in the 1.7 mol% In-doped LN crystal.
The measurements of the coefficient r222 were performed for each crystal under investigation. All
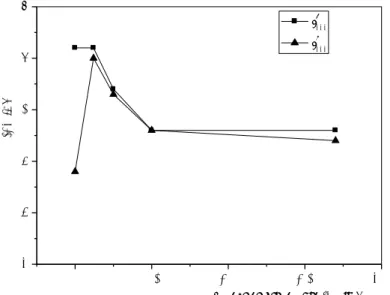
crystals present the same behavior as function of frequency. The dependence of the clamped and unclamped EO coefficients, r222T and r222S on the molar Indium concentration is shown in figure 4 and
presented in table 1. 2 4 6 8 10 12 0 10 20 30 40 50 103 104 105 106 107 108 -50 0 50 100 r222 (p m /V ) F requenc y (Hz ) L N-1.7% In L N-1.7% In r222 (p m /V ) L N-c ong ruent ε2
7
1234567890
NAMES'16 IOP Publishing
IOP Conf. Series: Journal of Physics: Conf. Series 879 (2017) 012005 doi :10.1088/1742-6596/879/1/012005
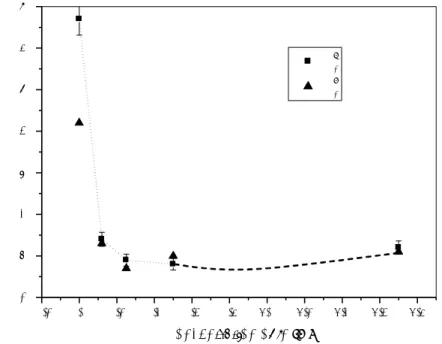
Figure 4. EO coefficient rT222 and rS222 versus In concentration in congruent LN.
We can see in figure 4 that both clamped and unclamped EO coefficients r222 decrease versus
indium concentration and present a kink probably at around 1.0 mol% of In in the crystal. The values of the low- and high- frequency r222 coefficients in In-doped LN in the case of 1.7 mol% are equal to
r222T = 4.6 ± 0.4 pm/V and r222S = 4.4 ± 0.4 pm/V respectively. It corresponds to a decrease of about
25% of the value obtained in the 0.1 % In doped sample. Moreover, this result also prevents that the high frequency electro-optic coefficient value in all In doped samples remains higher than in the case of pure congruent LN pointing out a lower acoustic contribution attributed to indium incorporation.
We note that contrary to Hf-doped LN crystals [13-19], the value of r222 coefficient versus dopant
concentration in LN:In crystals has to be emphasized since this coefficient presents a non-monotonous dependence as already observed for crystals doped with other ions such as Zr, Zn or Mg [27, 28, 37, 40-42].
3. Dielectric measurements
EO properties are linked to the linear dielectric properties in ferroelectric inorganic materials. The frequency dependence [43] of an EO coefficient reproduces the behavior of the corresponding dielectric permittivity ε and a link between ε and r still exists in their dependence on the doping composition.
Using a low voltage equal to 1 V, inducing an electric field in sample under test equal to 1 kV/m, the measurements of the dielectric permittivity ε22 as function of frequency for all crystal-samples were
done by means of two impedance analyzers HP4151 and HP4191A in frequency ranges from 1 Hz to 13 MHz and from 1 MHz to 1GHz, respectively. The frequency dispersion of dielectric permittivity ε22
of the 1.7 mol%-In doped LN crystal measured along the c-axis is shown in figure. 5. All samples present the same general response with the frequency being such that the In-concentration dependence of the clamped and unclamped permittivities ε22T and ε22S present a same kink-behavior as the EO
coefficient r222 shown in figure 4.
0,0 0,5 1,0 1,5 2,0 2 3 4 5 6 7 rT222 rS 222 r222 ( p m /V ) C onc entration of In (mol% )
1234567890
NAMES'16 IOP Publishing
IOP Conf. Series: Journal of Physics: Conf. Series 879 (2017) 012005 doi :10.1088/1742-6596/879/1/012005
Figure 5. Dielectric constant ε22T and ε22S versus In concentration in congruent LN.
All data are reported in table 1. As expected, the behavior of ε22 with frequency is very similar to
this of r222. In figure 3, we can see that ε22 remains constant and displays only a very small jump
between both sides of the piezoelectric resonances. We remind that this jump corresponds to the small electromechanical contribution Δε to the static permittivity εT. This will be commented and discussed
below.
Table 1. Absolute values of the r222 EO coefficient and related parameters of LN:Zr
crystals as function of zirconium concentration: The EO coefficients at constant stress (rT)
were obtained by both MDM and TRM methods and at constant strain (rS) by the TRM
method, at 633 nm and at room temperature. The dielectric permittivities ε22T and ε22S
were measured at room temperature. The figure of merit F = n7(r
222S)2/ε222S was calculated
from experimental values. MDM
method TRM method
Acoustic
contribution Dielectric constants Figure of merit r222T (pm/V) r222T (pm/V) r222S (pm/V) r222T – r222S (pm/V) ε22T ε22S n7(r 222S)2/ε22S (pm/V)2 LN-Cg 6,4±0.4 6,6±0.4 3,9±0.3 2.7±0.4 87±5 62±3 79 2%ZrO2 5.2±0.4 5±0.4 2.9±0.3 2.1±0.4 72±4 51±3 157 1.7%In 4.8±0.3 4.6±0.3 4.4±0.3 0.2 ±0.4 32±1 31±1 200 0.5%In 4.6±0.3 4.6±0.3 4.5±0.3 0.1 ±0.4 32±1 30±1 216 0.25%In 5.5±0.4 5.4±0.4 5.3±0.4 0.1 ±0.4 29±1 27±1 333 0.12%In 6.4±0.4 6.2±0.4 6 ±0.4 0.2 ±0.4 34±2 33±2 349 4. Discussion
In inorganic crystals the contribution arising from the optical phonons is responsible for a large value of the EO coefficient at high frequency rS [43]. The acoustic contribution can be thus derived
from the experimental values of the EO coefficients measured below and above the piezo-electric
-0,2 0,0 0,2 0,4 0,6 0,8 1,0 1,2 1,4 1,6 1,8 20 30 40 50 60 70 80 90 εT2 εS2 ε 2 C onc entration of In (% )
9
1234567890
NAMES'16 IOP Publishing
IOP Conf. Series: Journal of Physics: Conf. Series 879 (2017) 012005 doi :10.1088/1742-6596/879/1/012005
resonances. Compared to congruent composition where we found r222a = r222T – r222S = 2.7 ± 0.4 pm/V,
we can observe a small dependence of the acoustic contribution in the case of the In-doped LN crystals, which is found r222a = r222T – r222S = 0.2 ± 0.4 pm/V.
The dependence of all physical properties on indium concentration in lithium niobate is still not available. Nevertheless, we are able to estimate the acousto-optic contribution to the electro-optic effect, ra from the elasto-optic (Pockels) at constant electric field, and from the piezoelectric
tensors and the electromechanical contribution to the static permittivity, i.e. the difference Δεij between
the low- and the high- frequency values (εT and εS, respectively) of dielectric permittivity recorded on
both sides of the acoustic resonances [43]
, (4)
, (5)
where e is the piezoelectric stress tensor and CE is the tensor of the elastic constants at constant
electric field or elastic stiffness.
It is to be noted that the coefficients can be also expressed with coefficients and ekl using
the thermodynamic relations. According to the point group 3m of LN crystal, [44] and by application of Neumann’s principle to the p, d and CE tensors followed by the use of the reduced-subscript
notation, we obtain the piezo-optic contribution to r222 and to ε22 from Eqs. 4 and 5 as
, (6)
, (7)
Using the values of piezo-electric and elasto-optic coefficients, available in literature [45, 47] for the pure congruent composition only, we found (Eq. 6) = 2.7 pmV-1 in a good agreement with the
experimental value, within the experimental error (10%). This piezo-optic contribution is relatively large in LN since it constitutes nearly 40% of the total value ~ 6.6 pmV-1. Within Eq.7, also
evaluated for pure congruent lithium niobate, we found Δε22 = 35, which is close to the step directly
detected in the experiments between both sides of the piezo-resonances.
We have demonstrated in our experiments that both the unclamped and clamped EO coefficient r222
and the dielectric permittivity ε22 decrease and present probably a kink around In-doped LN 1 mol%.
From the above consideration, the small step between low- and high-frequencies in both the EO coefficient r222 and the dielectric permittivity ε22 in LN:In is mainly due to the quasi-absence of
electromechanical contribution in LN:In, which constitutes the large contribution in the congruent material. We also note that the term included C44 is the largest in the congruent crystal even if it is too
small to explain itself the piezo-optic contribution to ε22. Thus, the important changes in the
electro-optic coefficient and dielectric constant can be attributed to large changes in piezo-electric and elasto-optic coefficients in doped crystals and generally to the strain effects along a (or b) axis.
pijkl E dkij rij,ka = p ij,lm E d lm,k lm
∑
Δεij= εij T− ε ij S= dij,kekl kl∑
= dij,kCijkl E kl∑
dl,ij pij,lm E Cijkl E r222a = − p 11 E− p 12 E(
)
d22+ p14E d15 Δε22= 2d222 C 11 E − C12E(
)
− 4d22d15C14 E + d152C 44 E r222a r222T1234567890
NAMES'16 IOP Publishing
IOP Conf. Series: Journal of Physics: Conf. Series 879 (2017) 012005 doi :10.1088/1742-6596/879/1/012005
Furthermore, indium is an important optical damage resistance dopant in lithium niobate, which would improve the photoconductivity σph of the crystal and we can note that indium impurity is the
most ‘‘efficient’’ among optical damage resistant ions due to the lowest threshold concentration, which was believed about 1.5–2 mol % [34]. It is important to emphasize that incorporation of In impurity ions do not affect the optical absorption of lithium niobate compared to the spectrum of pure congruent lithium niobate grown from the same charge [34].
In addition, as concerns optoelectronic applications of lithium niobate crystals, we have calculated the figure of merit linked to the driving voltage and the power (switching speed) of an EO modulator [44] or of a Pockels cell [37]. This figure of merit qualify EO devices used as modulators or Q-switches and is defined as F = n7(rS
222)2/ε22. The values of F obtained in the present study for the LN:In
samples are listed in table 1. LN:In crystals exhibit higher values of the figure of merit F compared to crystals of pure congruent LN composition. Thus, LN:In is a good candidate for Pockels cell [23]. Moreover, in LN:In series, the figure of merit F is improved for crystal having a concentration of 1.7 mol% of indium. This concentration corresponds also to an increase of the optical damage resistance threshold [34]. In the other hand, comparing to the latter, the indium-doped crystal possesses several advantages, such as larger photoconductivity, lower absorption coefficient, and higher photorefractive sensitivity [34, 48]. So, the current results and analyzes point out the high potential of LN:In to be a promising materiel for EO modulation and Q-switching applications.
5. Conclusion
In a series of Indium doped lithium niobate crystals, the frequency dependence of the EO coefficient r222 and of the associated permittivity ε22 are experimentally measured and the piezo-optic contributions
were calculated. The piezo-optic contribution to the EO coefficient was found much smaller in r222
compared to congruent composition. This is mainly related to the smaller deformation along the a (b) axis induces by the applied electric field as reflected by the difference between the low-and high-frequency values of ε22..Both EO and dielectric coefficients reveal a dependence on the In content
introduced in the LN lattice with a kink probably located at 1.0 mol% and attributed to the introduction of In ions and to the related strain contribution. Compared to undoped congruent crystal, the indium doped lithium niobate crystals present the advantage to have smaller optical damage, especially for concentration equal 1.7 mol%, and therefore is a promising material for EO modulation and Q-switching applications.
References
[1] Salvestrini J P, Abarkan M, Fontana M D 2004 Opt. Mat. 26 449
[2] Volk T, Wöhlecke M 2008 Lithium Niobate: Defects, Photorefraction and Ferroelectric Switching, Springer-Verlag
[3] Räuber A, 1978 in E. Kaldis E (Ed.), Current Topics in Material Sciences, North-Holland Publishing, Amsterdam, 481.
[4] Krätzig E, Schirmer O F, 1988 in P. Gunter, J.-P. Huignard (Eds.), Photorefractive Materials and Their Applications I, Springer, Berlin – Heidelberg, 131.
[5] Kostritskii S M, Aillerie M 2012 J. Appl. Phys.111 013519
[6] Chah K, Aillerie M, Fontana M D, Malovichko G, Kokanyan E 1996 Ferroelectrics 186 13-16. [7] Chah K, Aillerie M, Fontana M D, Malovichko G, Betzler K, Kokanyan E 1997 Opt. Comm. 136
231-234.
[8] Chah K, Fontana M D, Aillerie M, Bourson P, Malovichko G Appl. Phys. B: Optics and Lasers 67 65-71.
[9] Chah K, Aillerie M, Fontana M D, Malovichko G 2000 Opt. Comm. 176 261-265.
[10] Eimerl D, Velsko S, Davis L, Wang F 1990 Progress in nonlinear optical materials for high power lasers Prog. Cryst. Growth Charact. Mater. 20(1–2) 59
11
1234567890
NAMES'16 IOP Publishing
IOP Conf. Series: Journal of Physics: Conf. Series 879 (2017) 012005 doi :10.1088/1742-6596/879/1/012005
Conference IEEE-IQEC’80 63
[12] Volk T R, Rubinina M N, Woehlecke M 1994 J.Opt. Soc. Am. B 11 1681
[13] Furukawa Y, Sato M, Kitamura K, Yajima Y, Minakata M 1992 J. Appl. Phys. 72(8) 3250 [14] Bryan DA, Gerson R, Tomaschke HE 1984 Appl. Phys. Lett. 44(9) 847
[15] Aillerie M, Bourson P, Mostefa M, Abdi F, Fontana M D 2013 J. Phys. 416 012002 [16] Abdi F, Aillerie M, Bourson P, Fontana M D 2009 J. Appl. Phys. 106 033519
[17] Volk T, Maximov B, Sulyanov S, Rubinina N, Abdi F, Aillerie M, Bourson P, Fontana M D 1999 OSA Trends in Optics and Photonics 27 145
[18] Volk T, Pryalkin V, Rubinina N 1990 Opt. Lett. 15 996
[19] Aillerie M, Bourson P, Mostefa M, Abdi F, Fontana M D 2013 J. Physics 416 012001
[20] Kokanyan E P, Razzari L, Cristiani I, Degiorgio V, Gruber J B 2004 Appl. Phys. Lett. 84 1880 [21] Razzari L, Minzioni P, Cristiani I, Degiorgio V, Kokanyan E P 2005 Appl. Phys. Lett. 86 131914 [22] Li S, Liu S, Kong Y, Deng D, Gao G, Li Y, Gao H, Zhang L, Hang Z, Chen S, Xu J 2006 J. Phys.
Condens. Matter 18 3527
[23] Abarkan M, Aillerie M, Salvestrini J P, Fontana M D, Kokanyan E P 2008 Appl. Phys. B 92 6038 [24] Minzioni P, Cristiani I, Degiorgio V, Kokanyan E P 2007 J. Appl. Phys. 101 116105
[25] Minzioni P, Cristiani I, Yu J, Parravicini J, Kokanyan E P, Degiorgio V 2007 Opt. Express 15 14171.
[26] Kokanyan E P 2006 Ferroelectrics 341 119
[27] Abarkan M, Aillerie M, Kokanyan N, Teyssandier C, Kokanyan E P 2014 Opt. Mat. Express 4(1) 179
[28] Aillerie M, Abarkan M, Kostritskii S M, Kokanyan E P 2014 Opt. Mat. 36(7) 1238 [29] Petrosyan A M, Hovsepyan R K, Kokanyan E P, Feigelson R S 2000 Proc. SPIE 4060 106 [30] Kong Y, Liu S, Zhao Y, Liu H, Chen S, Xu J 2007 Appl. Phys. Lett. 91(8) 081908
[31] Liu H, Liang Q, Zhu M, Li W, Liu S, Zhang L, Chen S, Kong Y, Xu J 2011 Opt. Express 19(3) 1734
[32] Argiolas N, Bazzan M, Ciampolillo M V, Pozzobon P, Sada C, Saoner L, Zaltron A M, Bacci L, Minzioni P, Nava G , Parravicini J, Yan W, Cristiani I, Degiorgio V 2010 J. Appl. Phys.108(9) 093508
[33] Volk T R, Rubinina N M 1992 Ferroelectrics Lett. 14
[34] Qiao H, Xu J, Wu Q, Yu X, Sun Q, Zhang X, Zhang G, Volk T R 2003 Opt. Mat. 23 269 [35] Abarkan M, Salvestrini J P, Fontana M D, Aillerie M 2003 Appl. Phys. B 76 765
[36] Salvestrini J P, Abarkan M, Zaccaro J, Ibanez A 2003 J. Opt. Soc. Am. B 20(8) 1661
[37] Nava G, Minzioni P, Yan W, Parravicini J, Grando D, Musso E, Cristiani I, Argiolas N, Bazzan M, Ciampolillo M V, Zaltron A, Sada C, Degiorgio V 2011 Opt. Mater. Express 1(2) 270
[38] Aillerie M, Theofanous N, Fontana M D 2000 Appl. Phys. B. 70 317
[39] Abarkan M, Salvestrini J P, Aillerie M, Fontana M D 2003 Appl.Opt. 42 2346
[40] Abdi F, Aillerie M, Fontana M D, Bourson P, Volk T, Maximov B, Sulyanov S, Rubinia N, Wöhlecke M 1999 Appl.Phys. B 68 795
[41] Grabmaier B C, Otto F 1986 J. Cryst. Growth 79 682
[42] Salvestrini J P, Fontana M D, Wyncke B, Brehat F 1997 Nonlinear Optics 17 271 [43] Kaminow I P 1974 An Introduction to Electro-Optic Devices Academic Press [44] Nye J F 1957 Physical Properties of Crystals Oxford Univ. Press
[45] Jazbinsek M, Zgonik M 2002 Appl. Phys. B 74 407
[46] Warner A W, Onoe M, Coquin G A 1966 J. Acoust. Soc. Am. 46(6), 1223 [47] Dixon R W, Cohen M G 1966 Appl. Phys. Lett. 8 205