HAL Id: hal-01399880
https://hal.archives-ouvertes.fr/hal-01399880
Submitted on 21 Nov 2016
HAL is a multi-disciplinary open access
archive for the deposit and dissemination of
sci-entific research documents, whether they are
pub-lished or not. The documents may come from
teaching and research institutions in France or
abroad, or from public or private research centers.
L’archive ouverte pluridisciplinaire HAL, est
destinée au dépôt et à la diffusion de documents
scientifiques de niveau recherche, publiés ou non,
émanant des établissements d’enseignement et de
recherche français ou étrangers, des laboratoires
publics ou privés.
Minimization of Costs and Energy Consumption in a
Data Center by a Workload-Based Capacity
Management
Georges da Costa, Ariel Oleksiak, Wojciech Piatek, Jaume Salom, Laura Siso
To cite this version:
Georges da Costa, Ariel Oleksiak, Wojciech Piatek, Jaume Salom, Laura Siso. Minimization of Costs
and Energy Consumption in a Data Center by a Workload-Based Capacity Management. 3rd
Inter-national Workshop on Energy-Efficient Data Centres, co-located with E-Energy (E2DC 2014), Jun
2014, Cambridge, United Kingdom. pp. 102-119. �hal-01399880�
O
pen
A
rchive
T
OULOUSE
A
rchive
O
uverte (
OATAO
)
OATAO is an open access repository that collects the work of Toulouse researchers and
makes it freely available over the web where possible.
This is an author-deposited version published in :
http://oatao.univ-toulouse.fr/
Eprints ID : 15265
The contribution was presented at E2DC 2014:
http://www.dc4cities.eu/e2dc.html
To cite this version :
Da Costa, Georges and Oleksiak, Ariel and Piatek, Wojciech and
Salom, Jaume and Siso, Laura Minimization of Costs and Energy Consumption in a
Data Center by a Workload-Based Capacity Management. (2014) In: 3rd
International Workshop on Energy-Efficient Data Centres, co-located with E-Energy
(E2DC 2014), 10 June 2014 (Cambridge, United Kingdom).
Any correspondence concerning this service should be sent to the repository
administrator:
staff-oatao@listes-diff.inp-toulouse.fr
Minimization of Costs and Energy Consumption
in a Data Center by a Workload-based Capacity
Management
Georges Da Costa1
, Ariel Oleksiak2,4, Wojciech Piatek2
, Jaume Salom3 , Laura Sis´o3
1
IRIT, University of Toulouse, georges.da-costa@irit.fr
2
Poznan Supercomputing and Networking Center, [ariel,piatek]@man.poznan.pl
3
IREC, Institut de Recerca en Energia de Catalunya, [jsalom,lsiso]@irec.cat
4
Institute of Computing Science, Poznan University of Technology, ariel@man.poznan.pl
Abstract. In this paper we present an approach to improve power and cooling capacity management in a data center by taking into account knowledge about applications and workloads. We apply power capping techniques and proper cooling infrastructure configuration to achieve sav-ings in energy and costs. To estimate values of a total energy consumption and costs we simulate both IT software/hardware and cooling infrastruc-ture at once using the CoolEmAll SVD Toolkit. We also investigated the use of power capping to adjust data center operation to variable power supply and pricing. By better adjusting cooling infrastructure to specific types of workloads, we were able to find a configuration which resulted in energy, OPEX and CAPEX savings in the range of 4-25%.
Keywords: data centers, energy efficiency, simulations, heat-aware, met-rics, OPEX, CAPEX
1
Introduction
The problem of capacity management in data centers is a well known issue, which data center planners and operators must deal with. The problem can be defined as finding such a data center configuration that its space, power and cooling ca-pacity is maximized. In other words, the goal is to put maximal number of servers into a data center subject to its size, electrical infrastructure power limits, and heat dissipation constraints. Usually, this process is based on server power usage nameplates and by getting theoretical peak values from specifications. Unfortu-nately, these values are often the Power Supply Unit (PSU) maximum capacity so they substantially overestimate actual power loads. Therefore, vendors some-times deliver calculators that help to obtain estimations closer to real values. Still, most of these methods neither take into consideration characteristics of specific applications nor dynamic properties of workloads that are executed in data centers. Some attempts to! apply more advanced power capping to improve
efficiency of the whole data center can be found in literature. An alternative method to power capping based on managing distributed UPS energy is pre-sented in [9]. Interesting approach to combine IT workloads, power, cooling and renewable energy was studied in [18] but without use of power capping tech-niques. In [11] authors propose adaptive power capping for virtualized servers, however they investigate neither the cooling system nor variable power supply. Dynamic power capping to enable data center participation in power markets was proposed in [4] but without detailed cooling consideration, either. To ad-dress these issues, we propose modeling and analysis of data center workloads and hardware to identify real power limits that should be met. Based on these limits we present methods to save energy and optimize cooling capacity of a data center including adaptation of limits to power supply and pricing.
To meet this objective we have used the SVD Toolkit developed within the CoolEmAll project [5]. The toolkit enables data center designers and operators to reduce its energy impact by combining the optimization of IT, cooling and workload management. For this purpose, CoolEmAll project investigated in a holistic approach how cooling, heat transfer, IT infrastructure, and application-workloads influence overall cooling- and energy-efficiency of data centers, taking aspects into account that traditionally have been considered separately. SVD Toolkit was used to conduct experiments described in this paper. In particular, most simulations were done using one of the main tools of the SVD Toolkit - the Data Center Workload and Resource Management Simulator (DCworms) [10]. Using the CoolEmAll SVD Toolkit we demonstrate how to improve capacity management by taking into account knowledge about applications and work-loads as well as by using power capping techniques and proper cooling infras-tructure configuration. To obtain total energy consumption, we simulate both IT software/hardware and cooling infrastructure in parallel. In this way, by better adjusting cooling infrastructure to specific types of workloads, we were able to find a configuration which result in energy savings and even in improvement of CAPEX (Capital Expenditures) without significant workload performance de-terioration. Decrease in CAPEX was achieved by the selection of smaller chiller which fits the foreseen workloads better. Energy savings were achieved by in-crease of server inlet temperature. This was possible by limiting power used by particular racks and by compliance to the latest ASHRAE recommendations. Finally, we applied power capping to adjust data center operation to ! variable power supply and achieved additional OPEX (Operating Expenditures) savings. The structure of this paper is as follows. In Section 2 we present a model of a data center including models of IT hardware, cooling, workloads and applica-tions. This section also contains definitions of metrics used for the assessment of data center configurations studied in this paper. We analyze workloads along with their impact of on energy-efficiency in Section 3. Based on this analysis we define power limits which allow reducing energy consumption and costs of a data center operation. Section 4 contains results of the data center optimization using power capping methods and decisions about cooling infrastructure deployment and configuration. Section 5 concludes the paper.
2
Data center model
2.1 Modeling Workloads
In terms of workload management, workload items are defined as jobs that are submitted by users [20]. Thus, modeling of workloads consists in providing infor-mation about structure, resource requirements, relationships and time intervals of jobs arriving to the management and scheduling system. Primary properties of a workload include:
– number of jobs to be scheduled
– jobs arrival rate, expressed as a time interval between successive jobs – reference to an application profile describing behaviour of particular job on
the hardware (resource requirements and execution times) The last one is described in the next section in more detail.
Having these dependencies established, it is possible to express the impact of particular workload on the hardware layer. For now, one of the main and commonly used format that provides unitary description of workloads models and logs obtained from real systems is Standard Workload Format (SWF) [23]. As mentioned, workload profiles may be obtained by monitoring real systems or generated synthetically. The main aim of synthetic workloads is to reflect the behavior of real observed workloads and to characterize them at the desired level of detail. Moreover, they are also commonly adopted to evaluate the system performance for the modified or completely theoretical workload models. Usage of synthetic workloads and their comparison to the real ones have been the subject of research for many years [13].
2.2 Modeling applications
Concerning application-led management a maximum feedback is needed from the applications from different point of view. The focus is on power-, energy- and thermal-impact of decisions on the system. Still it is impossible to put a watt-meter on an application. In order to obtain the same kind of information, we monitored applications to evaluate their resource consumption at each second. At each of these points, using system values and hardware performance counters, processor, memory and I/O resources are monitored. Using these information and models we produce for each of these timestamps an evaluation of the power consumption [6]. Each of those values are monitored, computed and stored in real-time in a database for future use.
In the system, an application is then described as the resources it uses on a particular hardware. Each application can be run on different hardware or configuration (frequency for example) and those data are associated with the same application. In case the data for a particular application on a particular hardware is not available, a translation tool is used to evaluate the behavior of the application using its behavior on a different hardware. First, it models the
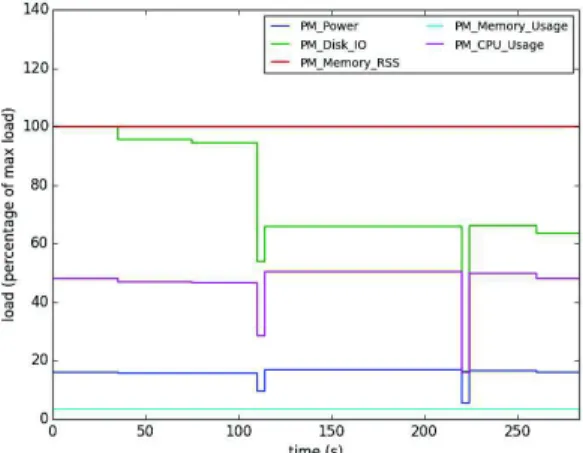
resource bottleneck of an application using the monitored resource consumption on a particular hardware. Using the target hardware specification, it evaluates the resource bottleneck and thus overall resource consumption on that hardware. Using the monitored data, we create a description of applications based on their phases following the same methodology as in [12]. A phase is defined as a duration when resources consumption are stable. As an example, Fig. 1 show the profile of a Fast Fourier Transform algorithm with its phases. Using the XML files describing exact application behavior and resource consumption, SVD toolkit can evaluate precisely the impact of its decisions.
Fig. 1: Profile of the benchmark test3d: 3D real-to-complex FFT routine
2.3 Modeling servers
In the scope of CoolEmAll, data center server room is composed by a number of racks. Each rack consists of a set of node groups, which are then responsible for hosting a collection of nodes. Node groups are defined by a means of chassis that models the placement of nodes within the node group as well as mounted fans. The main component of the node is a processor with assigned number of cores and computing capability (expressed by a clock speed). Moreover, each processor comes with its power and computing profile, described by the means of C-States and P-States defining operating states with corresponding power usage values for different utilization levels. Node definition is supplemented by a description of memory and network. Rack represents a standardized enclosure for carrying server and power supply modules. Power profiles of IT infrastructure are the basis for calculating the power consumption of particular resources.
The following equations show how the power usage for different resource levels is estimated.
where Pcpu(Px, load) is a power consumed by a processor operating in a given P-State Pxand utilized in a level denoted by load. Pcpu(Px, 0) and Pcpu(Px, 100) expresses an idle and fully loaded processor working in a given P-State, respec-tively (these constant values are part of the processor power profile providing power consumptions levels for all available frequencies).
Pnode= n X i=1
Pcpui+ Pmem+ Pnet (2)
where Pnode is a power consumed by a node, n is the number of processors assigned to a node, Pmemis a power drawn by a memory, while Pnetby a network.
Pnode group= m X i=1 Pnodei+ k X j=1 Pf anj (3)
where Pnode groupis a power consumed by a node group, m is the number of nodes placed in a node group, k is the number of fans mounted within it and Pf anj is a power used by particular fan j.
Prack= ( l X
i=1
Pnode groupi)/ηpsu (4)
where Prack is a power consumed by a rack, l defines the number of carried node groups and ηpsuis efficiency of a power supply unit.
Finally, each component is accompanied with its carbon emissions and elec-tricity costs. Apart from IT equipment, data center server room is composed by a cooling devices, which are the subject of next subsection.
2.4 Cooling models
The SVD CoolEmAll toolkit integrates models to calculate the power associated to cooling equipment and other electric facilities required in data center to fulfill its mission related with IT services. The cooling model provided consists of a simple data center where central fan and air-water coil cools the IT equipment and other related loads (PDU, UPS and lighting). A chiller placed outside pro-vides cooling water to the coil and dissipates the exhausted heat from the room to the atmosphere by a dry-cooler (Figure 2 shows details). The power model adds the consumption of IT, fans, chiller, PDU and lighting. Other electric com-ponents of a data center as back-up generator or transformer are excluded from the present model.
The following model description is based on a single time-stamp where Q is referred to heat dissipated and P to power consumption. The time variability is indicated by (t). This model has been constructed based on basic thermodynamic equations of conservation of mass and energy. The total power consumption of a data center (PDC) will be calculated with Eq. 5, where Pload DC is the power used by IT components, Pchiller is the consumption of the chiller, Pf ans DC is
Fig. 2: Model of cooling and power facilities of a data center
the consumption of fans in data center and Pothersis the consumption associated to PDU and lighting:
PDC(t) = Pload DC(t) + Pchiller(t) + Pf ans DC(t) + Pothers(t) (5) The total thermal load (QDC) is the sum of the heat associated to IT load (Qload DC), the heat from other loads, as PDU and lighting (Qothers DC) and the heat from fans distributing air inside a data center room (Qf an DC).
QDC(t) = Qload DC(t) + Qf an DC(t) + Qothers DC(t) (6) The cooling demand that should be covered (Qcooling) is the thermal load in data center including the inefficiencies in the air-water coil represented by ηcc according Eq. 7. That corresponds to the heat exchanger efficiency of a common CRAH, where heat of the room is transferred to the water flow (Qcooling).
Qcooling(t) =
QDC(t) ηcc
(7) The chiller has been modelled with generic profiles based on condenser tem-perature (Tco), evaporator temperature (Tev) and partial load ratio (P LR). Thereby, the model presented here should provide a general method to determine the power consumption of the chiller without knowing the specific characteristics of the chiller provided by a certain manufacturer. As a result, it has been used parametric curves implemented by the Building Certification Code in Spain [1] named COOL(Tev, Tco) and CoolP R(Tev, Tco, P LR, EERrated) following certain relations depicted in Eq. 8 and Eq. 9.
CoolP R(t) = CoolP R(Tev, Tco, P LR, EERrated) = 1
EER(t) (9) Partial Load Ratio is the relation between the cooling demand in a certain conditions and the cooling load in nominal conditions (Qcooling nom) correspond-ing to the operation of the chiller at the chilled water temperature (Tev) and con-denser water temperature (Tco) set-up (Eq. 10). At the same time, Qcooling nom has relation with the cooling capacity rated (Qcooling rated) which corresponds to load of the chiller in Standard Conditions (full load; temperature of chilled water leaving the chiller at 7oC and temperature of condenser water entering the chiller at 30oC) as stated in Eq. 8.
P LR(t) = Qcooling(t) Qcooling nom
(10) The the relation between the cooling load and the power consumed in the chiller (Pchiller) is linked by the Energy Efficiency Ratio (EER), that quantifies the cooling provided by the chiller by each unit of power consumed, according Eq. 11. EERrated corresponds to the value of the parameter measured at Standard Conditions defined above.
Pchiller(t) =
Qcooling(t)
EER(t) (11)
2.5 Assessment of data center efficiency, performance, and costs Metrics CoolEmAll SVD Toolkit provides a set of metrics divided in the level of granularity of the analysis (node, node-group, rack and data center). The whole group of metrics assesses the resource usage, capacity, energy, heat-aware, green and financial concepts. The total selection of metrics of CoolEmAll are described in public report of the project [15] as well as in some articles [16] [17].
Total Energy Consumed: this corresponds to the total energy consumed by the data center in a certain period of time.
Power Usage Effectiveness (PUE): defined by The Green Grid [3] this metric consist of dividing power used by the data center between power used by the IT equipment. The accuracy level of the metrics is related with the point of measurement of IT power, that can be the UPS (Uninterruptible Power Supply Unit), the PDU (Power Distribution Unit) or the IT itself, after PSU (Power Supply Unit). When the measurement is done after the PSU the metric is defined as PUE Level 3.
When the measurement is referred to IT properly, excluding PSU and fans, the metric is named PUE Level 4, according CoolEmAll project proposal [16].
Carbon emissions: this metric is calculated multiplying the total power con-sumed by carbon emissions factor (CEF). CEF depends on the country power generation mix and power system efficiency. For the approach of this study, 0.34kg/kWh has been used as average value for the European Union according to [8]
OPEX: it is calculated multiplying the total power consumed by the price of electricity. The price of electricity has been considered as 0.0942 e/kWh for EU-28 as average of 2013 according to [22].
CAPEX: it is the amount of money used to acquire equipment or to improve the useful life of existing facilities.
3
Analysis of workloads
As mentioned in Section 2.1, workloads are characterized by the number of jobs, their arrival rate, resource requirements and execution time of particular applications. The following section contain describes the results of workload simulations performed by the means of Data Center Workload and Resource Management Simulator, which is part of SVD Toolkit.
3.1 Simulation of diverse workloads using DCworms
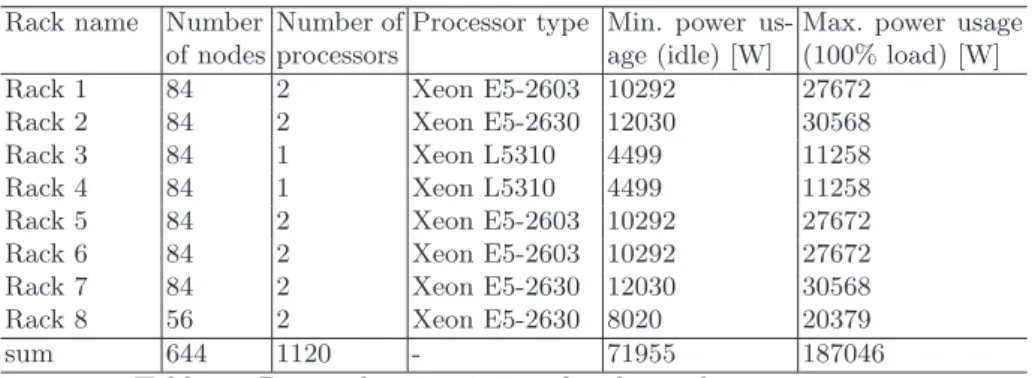
Resource characteristics In our experiments we used a configuration of the real server room. Each server was equipped with a processor belonging to In-tel Xeon processors family. The following table (Table 1) summarizes overall characteristics of particular racks.
Rack name Number of nodes
Number of processors
Processor type Min. power us-age (idle) [W]
Max. power usage (100% load) [W]
Rack 1 84 2 Xeon E5-2603 10292 27672
Rack 2 84 2 Xeon E5-2630 12030 30568
Rack 3 84 1 Xeon L5310 4499 11258
Rack 4 84 1 Xeon L5310 4499 11258
Rack 5 84 2 Xeon E5-2603 10292 27672
Rack 6 84 2 Xeon E5-2603 10292 27672
Rack 7 84 2 Xeon E5-2630 12030 30568
Rack 8 56 2 Xeon E5-2630 8020 20379
sum 644 1120 - 71955 187046
Table 1: Power characteristics of racks in the server room
Additionally, server room was equipped with the cooling facilities presented in Table 2.
Parameter Symbol in the
equations
Value Cooling capacity rated Qcooling rated 240000 [W]
Energy efficiency ration rated EERrated 3
Efficiency of cooling coil ηcc 0.95
Data center fans efficiency ηf 0.6
Temperature difference between Tevand TR in∆Thex 10oC
Table 2: Cooling facilities characteristics
Finally, the following input parameters were applied to the simulation envi-ronment (Table 3).
Parameter Symbol in the equations
Value Relation between PloadDC and Pothersα 0.2
Inlet temperature TR in 18oC
Outlet temperature TR out 33oC
Pressure drop ∆p 65 J/m3
Table 3: Input parameters
Workloads and application profiles In our experiment we evaluated two workloads with different utilization levels what was achieved by the modification of arrival rate (all tasks arrive according to the Poisson distribution) and the number of submitted tasks. The former workload consists of 1280 tasks, while the latter consists of 1760 tasks.
A distribution of applications constituting both workloads is the same in both cases and looks as follows: 20% - App1, 50% - App2, 30% - App3. Their general overview is shown in Table 4. The understanding of the cells content is as follows: number of requested processors, execution time, load level (in [%]).
Processor Type App1 App2 App3
Xeon E5-2630 1, 380, 84 4, 3200, 62.6 6, 3200, 94 Xeon E5-2603 1, 400, 86 4, 3600, 92
-Xeon L5310 1, 1200, 92 -
-Table 4: Application characteristics
3.2 Identifying power caps
Based on the simulation results obtained for execution of both workloads using Load Balancing policy, we observed two visible increases on utilization criteria, reaching almost 75% and 95% in the highest peak for Workload 1 and Workload 2 respectively. High utilization values have direct impact on the power consump-tion and thus might result in sudden power drawn peaks. Identificaconsump-tion of such levels is crucial in terms of avoiding hot spots and decreasing data center costs. Taking into account power consumption ranges for the modeled server room, power consumption distribution obtained during the experiments and the uti-lization curves we decided to use the following approach to specify the values of power caps. As there occured temporary, but significant load rises and we were not considering the possibility of switching nodes on/off, we wanted to ensure constant computational capabilities for all the servers within particular racks. To this end the power cap level is determined by the total power consumption of the rack, with all the processors fully loaded and working in the highest P-State (with lowest frequency). The following formula can be used to calculate this value (P C) for the given rack j.
P Cj= n X i=1
where n is the number of processors in a rack, PCP U is the power consumed by the processor working under given utilization level and in the given P-State, Phrefers to the highest P-State (power consumption is lower at higher P-State). On the other hand, in order not to observe the performance losses (due to frequency downgrading) another threshold is necessary. It aims at setting the power consumption level P U below which the current processor performance state will increase. It is defined by the following equation:
P Uj = P Cj· Pn i=1PCP Ui(Phi, 100%) Pn i=1PCP Ui(Phi−1, 100%) , (13)
where n is the number of processors in a rack, PCP U is the power consumed by the processor working under given utilization level and with the given P-State, Ph and Ph−1 refer to two highest P-States. As power consumption is lower at higher P-States, thus, P Uj is lower than P Cj.
P Uj allows increasing the current processors performance states at least by one without exceeding the power cap limit (P Cj). Below table introduces bound-ary values according to the aforementioned approach;
Rack name Rack 1 Rack 2 Rack 3 Rack 4 Rack 5 Rack 6 Rack 7 Rack 8 sum PC level [W] 20333 21878 8940 8940 20333 20333 21878 14585 137220 PU level [W] 18854 20223 8449 8449 18854 18854 20223 13482 127388
Table 5: Power caps values for the racks in the server room
Adjusting power limits to workloads Having information about historical or predicted workloads it is possible to adjust power caps. For instance, there may exist specific patterns of incoming tasks related to peak hours, time of a day, etc. This knowledge can be applied to identification of optimal power caps. There are two main requirements that should be taken into consideration while setting the values of power caps. First of all, the use of power capping shouldn’t cause significant increase of IT energy consumption for a given work-load. Second, the mean completion time of tasks should not go below certain required threshold.
The first requirement can be defined as follows. Let assume that energy decrease caused by power capping in rack j is denoted as Eexcess
j and given in Eq. 14. This amount of energy can be illustrated by the field above the power cap line in Figure 3. On the other hand, let denote by Ereserve
j the amount of additional energy that can be used in a rack without exceeding the set power cap. This can be seen as a free space below the power cap in Figure 3 and defined by Eq. 15. Eexcess j = Z t2 t1 max(0, PIT j (t) − P Cj)dt (14) Ereserve j = Z t2 t1 max(0, P Cj− PjIT(t))dt (15)
Fig. 3: Power distribution for Workload 1 and Workload 2 for two racks Then, the condition Eexcess
j < Ejreservemust be met. Otherwise, tasks whose execution times are increased by decreased performance states of CPUs could cause additional delays of additional tasks. Of course, this method is approx-imation as the actual results depend on sizes of tasks, their distribution, and exact relation between CPU performance states and execution time. However, as results in Section 4.3 show this approach is helpful to avoid increase of energy consumption caused by power capping.
The second requirement is meant to limit the power but without visible per-formance lost. The mean completion time increase caused by power capping can be estimated as a product of the CPU frequency change (we assume proportional relation to execution time) and a percentage of time for which power capping was used. We empirically set a 5% as a threshold for mean completion time increase to limit overall delays of the workload completion time and this condition was met (see results in Table 6). This parameter was used to limit CPU frequency decrease according to a model presented in Section 2.3 and can be based on specific Service Level Agreements with end users.
4
Optimizing capacity using power capping methods
4.1 Power capping methods
Generally, power capping solutions can be divided into: software-based (coarse-grained and slower) and hardware-based solutions (fine-(coarse-grained and faster).
Software-based solutions can be introduced independently from the vendor and regardless of whether hardware power capping is available. It can be applied on higher levels, e.g. managing tasks in a queue and balancing the load (with respect to power) among racks. The drawback of the software-based approach is longer time of reaction and more coarse-grained granularity.
Hardware-based power capping addresses this issue by the means of two main technologies available at processor level that enable the use of power cap-ping. The first one is related to processor P-States and consists in lowering the processor core frequency and voltage. That provides a good power reduction for a relatively small loss in performance. However, using P-States can lower power consumption only to a certain point. Reducing consumption below that point requires the use of second technology, namely clock throttling. In this case, depending on the processor model, the system BIOS can either reprogram the
processor to run at a lower frequency or modulate the processor between running periods and stopped periods.
In this paper we focus on the hardware-based approach benefiting from the processors P-States, as in the real data centers it ensures more reliable and faster effects. Moreover, it is often supported by hardware vendors and can be easily applied on the resource management level without affecting existing queueing system configuration (comparing to software-based approach). Its pseudo code for a rack is depicted by Algorithm 1.
Algorithm 1Pseudo code of power capping algorithm
Require: P ⊲ description of current power consumption of a rack
Require: P C ⊲ power cap level for a rack
Require: P U ⊲ power threshold for a rack
Ensure: Pxi ⊲ final P-state of a processor i
if P > P C then repeat
Py←lowest P-State of all processors ⊲ lower P-State=higher frequency foreach processor i in a rack with Pxi = PydoPxi= Pxi+1
if P <= P C then break end if end for untilP <= P C else if P < P U then repeat
Py←highest P-State of all processors ⊲ higher P-State=lower frequency foreach processor i in a rack with Pxi = PydoPxi= Pxi−1
if P >= P C then break end if
end for
untilP >= P C or Py= lowest available P-State of all processors
end if
4.2 Simulation experiments
To study the impact of power capping approach we performed another two simu-lations each time applying the power caps levels introduced in Section 3.2. More-over, in the first simulation run we increased the inlet temperature (temperature of air entering the room) to 27oC, while in the latter one we additionally modi-fied, according to Table 5, the cooling capacity rated factor to 180[kW ]. Below we introduce the nomenclature used to compare the simulation results.
– Experiment A: Load Balancing strategy, TR in= 18oC, reference case. – Experiment B: Load Balancing with Power Capping approach, TR in= 27oC – Experiment C: Load Balancing with Power Capping approach, TR in =
27oC, Q
4.3 Simulation results
This section shows the simulation results for three types of experiments per-formed. Due to the paper constraints, only the results for Workload 1 are pre-sented (Table 6).
Metrics A B C
Total IT energy consumption [kWh] 308.9 313.2 313.2 Total rack energy consumption [kWh] 370.8 376.2 376.2 Total cooling device energy consumption [kWh] 77.4 48.38 64.18 Total energy consumption [kWh] 525.22 502.66 518.47
Mean rack power [kW] 105.13 106.31 106.31
Mean power [kW] 148.916 142.04 146.51
Max rack power [kW] 144.82 130.38 130.38
Max power [kW] 214.45 176.87 183.49
PUE 1.416 1.336 1.378
PUE Level 4 1.7 1.605 1.655
Mean completion time [s] 6919 7262 7262
Mean task execution time [s] 2906 3249 3249
System load [%] 24.65 27.65 27.65
Table 6: Simulation results for Workload 1
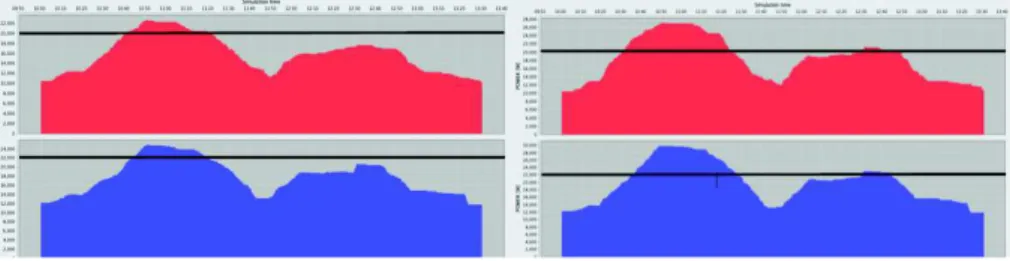
Figure 4 depicts the power distribution before and after applying a power capping technique.
Fig. 4: Example power distribution on two racks for Workload 1 before (left) and after (right) applying a power capping technique
Total savings achieved The following section shows the savings achieved for the simulations carried out. The reference case, with Load Balancing policy, is named ”A”. Optimized cases are named ”B” and ”C” respectively. First, when the strategy of power capping is applied, main savings can be observed in the chiller consumption (reaching 37,50% and 17.09% respectively) due to the efficiency of the chiller (EER) improves with higher inlet temperatures. This leads to savings in terms of total energy consumed that are equal to 4.19% in case ”B’” and 1.20% in case ”C”.
In the simulation carried out, the strategy consisted of cutting the maximum power of racks keeping same cooling facilities (in case ”B”) or changing the chiller capabilities (in case ”C”). The result obtained in these cases is a reduction
in OPEX associated to power saved mainly in chiller and in CAPEX due to reduction of IT infrastructure. The metrics calculated from the results of those simulations are shown in Table 7.
Metrics Savings (A-B)/A*100 Savings (A-C)/A*100
Execution time -0.33% -0.33%
Maximum rack power 9.98% 9.98%
Maximum power 17.53% 14.44%
Average power 4.61% 1.61%
Total energy consumed 4.30% 1.29%
PUE3 5.65% 1.29%
PUE4 5.59% 2.68%
Carbon Emissions 4.30% 1.29%
OPEX 4.30% 1.29%
Table 7: Savings on particular metrics
Proposed approaches provide small benefits on PUE - the savings are ob-tained due to the lower power consumption of the chiller. With a power capping of 10% the savings obtained in total energy consumed, carbon emissions and electricity costs (OPEX) are 4.30% for case (B) and 1.29% for case (C). The corresponding values obtained in savings extrapolated to a whole year consider-ing a 24x7 operation time are 60MWh/year, 20 tones CO2/year, 5666 Euros/year and 21MWh/year, 7 tones CO2/year, 1982 Euros/year, respectively. Also, the CAPEX costs associated to less equipment required are calculated based on the following approach. Total building cost of traditional data center is estimated as 15 million-US$ per MW of IT load according market survey developed by 451 Research company, referred as [19]. Converting this value to Euros with average annual ratios determined by the European Central Bank [21] referred to 2012, the corresponding value is 10784 Euros/kW(IT). On the other hand, the follow-ing distribution of cost between subsystems is considered accordfollow-ing the study done by Schneider Electric [14].
The 10% capping on maximum power of racks will affect directly the cost of those IT equipment but also on the sub-system of power equipment. Table 8 shows the distribution of costs of the three cases simulated. The costs of case (B) and (C) have been calculated estimating a reduction of 10% in racks and power equipment. Finally, with this assumption, the savings obtained in CAPEX over the total cost of the data center is a 4% or 62 thousands of Euros and 7% or 109 thousands of Euros, respectively.
4.4 Application to demand-response management
Nowadays, power grids face significant transformations. More open energy mar-ket, increased contribution of renewable energy sources, and rising energy prices stimulate changes of power grids to cope with new challenges such as adapta-tion to changing demand and supply, i.e. demand-response management. The approach to apply demand-response management to data centers was also al-ready studied, e.g. proposed in [2]. We show that our approach to analysis of
Costs by sub-system A B C
project management 156 156 156
power equipment 562 506 506
cooling equipment 187 187 141
engineering & installation 562 562 562
racks 62 56 56
system monitoring 31 31 31
TOTAL 1562 1500 1453
Table 8: Cost of data center placed in a room for three cases (thousand Euro) workloads and power capping mechanism can be applied to reduce costs in data centers.
Let’s assume that for a period assumed in previous Sections (3h 20min) there is a regular price for energy: 0.0942/kWh. Now, let’s also assume that period of the same size is a peak period in which energy provider is struggling with a demand that exceeds provider’s supply. The provider to cope with this demand proposes the following contract to its customers: a regular price for this period will stay on the same level provided that a customer guarantees that it will not exceed 200kW of power at anytime. Otherwise, the cost of 1 kWh will rise up to 0.15/kWh. To reduce costs in this case we applied power capping to the peak period. The comparison of approaches without and with power capping are presented in Table 9.
Approaches Total energy cost [e] Average energy price [e] Mean completion time [s] no power capping 128.24 0.12 6919 mix 96.8 0.0942 7090
Table 9: Comparison of approaches with and without power capping to deal with high demand periods
In the first case power capping was not used in any period. In the second case power capping was applied to the second (peak) period. As it can be easily seen, the total cost savings reached almost 25%. Extrapolating these numbers to the whole year would give around 45000e of savings.
5
Conclusions
In this paper we demonstrated the use of the CoolEmAll SVD Toolkit to im-prove power and cooling capacity management in a data center by taking into account knowledge about applications and workloads. We applied power capping techniques and proper cooling infrastructure configuration to achieve savings in energy and costs. To obtain estimated values of a total energy consumption we simulated both IT software/hardware and cooling infrastructure using our tools. In this way, by better adjusting cooling infrastructure to specific types of work-loads, we were able to find a configuration which resulted in energy savings by around 5% and corresponding OPEX decrease. We have also found improvements
of CAPEX without significant workload performance deterioration. Decrease in CAPEX was achieved by the selection of smaller chiller which is sufficient for the foreseen types of workloads. Savings in CAPEX reached 7% for the case in which a smaller chiller was used according to the work! load analysis results and power capping strategies. Replacing only electrical equipment brought 4% of savings in CAPEX. Energy savings were achieved by increase of the server inlet temperature. This was possible by limiting power used by particular racks and by compliance to the latest ASHRAE recommendations. Finally, we applied power capping to adjust data center operation to variable power supply and pricing. We achieved additional OPEX savings in order of 25% (45000eper year in the studied case).
Future work will include further improvements and tuning of cooling models. It will also include closer integration of CFD simulations into this analysis in order to identify hot spots and other consequences of modifications in a data center configuration. This approach will be used for various types of data centers. Finally, we plan to study more dynamic power capping strategies by adjusting power caps to the situation in a data center such as level and priority of load, energy supply and prices.
Acknowledgements. The results presented in this paper are partially funded by the European Commission under contract 288701 through the project CoolE-mAll and by a grant from Polish National Science Center under award number 2013/08/A/ST6/00296.
References
1. AICIA Grupo de Termotecnia de la Escuela Superior de Ingenieros Industriales de la Universidad de Sevilla. Calificaci´on de Eficiencia Energ´etica de Edificios. Condiciones de aceptaci´on de procedimientos alternativos a LIDER y CALENER. Gobierno de Espa˜na. Ministerio de vivienda. Ministerio de Industria, Turismo y Comercio. Insti-tuto para la diversificaci´on y ahorro de energ´ıa. 2009.
2. The All4Green project website, http://www.all4green-project.eu
3. Avelar, V.; Azevedo, D.; French, A. The Green Grid. White paper # 49. PUETM
: A comprehensive examination of the metric. 2012.
4. Hao Chen, Can Hankendi, Michael C. Caramanis, and Ayse K. Coskun. 2013. Dy-namic server power capping for enabling data center participation in power markets. In Proceedings of the International Conference on Computer-Aided Design (ICCAD ’13). IEEE Press, Piscataway, NJ, USA, 122-129.
5. M. vor dem Berge, G. Da Costa , A. Kopecki , A. Oleksiak, J.-M. Pierson, T. Pio-ntek, E. Volk, S. Wesner: Modeling and Simulation of Data Center Energy-Efficiency in CoolEmAll. Energy Efficient Data Centers, Lecture Notes in Computer Science, Volume 7396, pp. 25-36 (2012)
6. Da Costa Georges, Hlavacs Helmut, Hummel Karin and Pierson Jean-Marc: Mod-eling the Energy Consumption of Distributed Applications. In Handbook of Energy-Aware and Green Computing, Chapman & Hall, CRC Press (2012)
8. Kemma, R.; Park, D.: Methodology Study Eco-design of Energy-using Products MEEUP. Final report. VHK. Delft, The Nether-lands. 2005. http://ec.europa.eu/enterprise/policies/sustainable-business/ecodesign/methodology/index en.htm. Last visit: 10.01.2014.
9. Kontorinis, V.; Zhang, L.E.; Aksanli, B.; Sampson, J.; Homayoun, H.; Pettis, E.; Tullsen, D.M.; Simunic Rosing, T., ”Managing distributed UPS energy for effec-tive power capping in data centers,” Computer Architecture (ISCA), 2012 39th Annual International Symposium on , vol., no., pp.488,499, 9-13 June 2012, doi: 10.1109/ISCA.2012.6237042
10. Kurowski, K., Oleksiak, A., Piatek, W., Piontek, T., Przybyszewski, A., Weglarz, J.: DCworms - a tool for simulation of energy efficiency in distributed computing in-frastructures, Simulation Modelling Practice and Theory, Volume 39, December 2013, Pages 135-151, ISSN 1569-190X, http://dx.doi.org/10.1016/j.simpat.2013.08.007. 11. Hankendi, C.; Reda, S.; Coskun, A.K., ”vCap: Adaptive power capping
for virtualized servers,” Low Power Electronics and Design (ISLPED), 2013 IEEE International Symposium on , vol., no., pp.415,420, 4-6 Sept. 2013, doi: 10.1109/ISLPED.2013.6629334
12. Ghislain Landry Tsafack Chetsa, Laurent Lef`evre, Jean-Marc Pierson, Patricia Stolf, Georges Da Costa: DNA-Inspired Scheme for Building the Energy Profile of HPC Systems. International Workshop on Energy-Efficient Data Centres, Springer (2012)
13. V. Lo, J. Mache and K. Windisch, A comparative study of real workload traces and synthetic workload models for parallel job scheduling. In Job Scheduling Strategies for Parallel Processing, volume 1459, pp. 25-46. 1998.
14. Rassmussen, N.:Determining Total Cost of ownership for data center and network room infrastructure. WP 6 APC. Schneider Electrics Data Center Science Center. 2011.
15. Laura Sis´o, Ramon B. Forns, Assunta Napolitano, Jaume Salom, Georges Da Costa, Eugen Volk, Andrew Donoghue: D5.1 White paper on Energy- and Heat-aware metrics for computing modules - CoolEmAll Deliverable, http://coolemall.eu (2012)
16. Sis´o, L., Salom, J., Jarus, M., Oleksiak, A.; Zilio, T. Energy and Heat-Aware Metrics for Data Centers: Metrics Analysis in the Framework of CoolEmAll Project. Third International Conference on Cloud and Green Computing (CGC), pp.428434. 2013
17. Volk, E.; Tenschert, A.; Gienger, M.; Oleksiak, A.; Sis´o, L.; Salom, J., Improving Energy Efficiency in Data Centers and Federated Cloud Environments: Comparison of CoolEmAll and Eco2Clouds Approaches and Metrics. Third International Confer-ence on Cloud and Green Computing (CGC), pp.443-450. 2013.
18. Zhenhua Liu, Yuan Chen, Cullen Bash, Adam Wierman, Daniel Gmach, Zhikui Wang, Manish Marwah, and Chris Hyser. 2012. Renewable and cooling aware work-load management for sustainable data centers. SIGMETRICS Perform. Eval. Rev. 40, 1 (June 2012), 175-186.
19. 451 Research: The economics of prefabricated modular datacenters. 2012. 20. D. Feitelson, Workload Modeling for Computer Systems Performance Evaluation.
http://www.cs.huji.ac.il/ feit/wlmod/, Last update: 30 Dec 2012.
21. European Central Bank http://www.ecb.europa.eu/home/html/index.en.html
22. Eurostat. European Commission. http://epp.eurostat.ec.europa.eu/tgm/table.do?tab=table&init=1&plugin=1&language=en&pcode=ten001 [Last access 06/03/2014]