HAL Id: hal-01903303
https://hal.archives-ouvertes.fr/hal-01903303
Submitted on 24 Oct 2018
HAL is a multi-disciplinary open access
archive for the deposit and dissemination of
sci-entific research documents, whether they are
pub-lished or not. The documents may come from
teaching and research institutions in France or
abroad, or from public or private research centers.
L’archive ouverte pluridisciplinaire HAL, est
destinée au dépôt et à la diffusion de documents
scientifiques de niveau recherche, publiés ou non,
émanant des établissements d’enseignement et de
recherche français ou étrangers, des laboratoires
publics ou privés.
Seven-coordinated iron(II) spin-crossover molecules:
some learning from iron substitution in
[FexMn1–x(L222N3O2)(CN)2]
×H2O solid solutions
Hongfeng Wang, Cherif Baldé, Arnaud Grosjean, Cédric Desplanches,
Philippe Guionneau, Guillaume Chastanet
To cite this version:
Hongfeng Wang, Cherif Baldé, Arnaud Grosjean, Cédric Desplanches, Philippe Guionneau, et al..
Seven-coordinated iron(II) spin-crossover molecules: some learning from iron substitution in [FexMn1–
x(L222N3O2)(CN)2]
×H2O solid solutions. Dalton Transactions, Royal Society of Chemistry, 2018, 47
(41), pp.14741-14750. �10.1039/C8DT02517G�. �hal-01903303�
Cite this: DOI: 10.1039/c0xx00000x
ARTICLE TYPE
Seven-coordinated iron(II) spin-crossover molecule: some learning from
iron substitution in the [Fe
x
Mn
1-x
(L
222
N
3
O
2
)(CN)
2
]ꞏH
2
O solid solutions
Hongfeng Wang
a, Chérif Baldé
b, Arnaud Grosjean
a, Cédric Desplanches
a,*, Philippe Guionneau
aand
Guillaume Chastanet
a,*DOI: 10.1039/b000000x
5
The purpose of this work is to study the influence of the substitution of Fe(II) by Mn(II) on the spin crossover behaviour of the [FexMn1-x
(L222N3O2)(CN)2]ꞏH2O solid solutions where L222N3O2 is a macrocyclic ligand = 2,13-dimethyl-6,9-dioxa-3,12,18-triazabicyclo[
12.3.1]-octadeca-1(18),2,12,14,16-pentaene. The pure Fe(II) complex is known to present a change of the coordination number from 7 at high temperature to 6 at low temperature. The target of the solid solutions study was to investigate the effect of metal dilution on this
coordination change. We have then measured the thermal spin crossover features as well as the metastable HS state lifetime generated by
10
a rapid thermal quenching which was probed through the determination of the T(TIESST) value. A discussion of the spin-state as a function of temperature is given based on the phase diagram of this series and based on the investigation of the crystal structure of the [Mn(L222N3O2)(CN)2]ꞏH2O complex and its comparison with the published [Fe(L222N3O2)(CN)2]ꞏH2O master compound.
15
Introduction
In recent decades, the development of the electronics led to a tremendous growth of information technology to reduce the size of the components and to increase their efficiency. In this context, the design of molecular materials owing switchable properties at room
20
temperature is a current challenge for synthetic chemists worldwide.1-6 In the family of switchable compounds,
spin-crossover (SCO) compounds are of particular interest. They are transition metal complexes whose electronic configuration can be switched between low-spin (LS) and high-spin (HS) states by
25
different physical (temperature, pressure, light and electric field)6,7
and chemical (pH, coordination number, vapor…)8,9 stimuli. These
switching abilities make SCO molecules and materials very attractive for optical switches or/and magneto-optical storage properties3-8,10,11, especially in the case of iron(II)-based molecular
30
complexes, the most studied compounds, since the spin crossover occurs between a diamagnetic LS state and a paramagnetic quintet HS state.
A promising property shown by some of the SCO systems is the excited spin state trapping phenomenon (either light-induced,
35
i.e. LIESST effect or thermally-induced, i.e. TIESST effect).12 In
some SCO solids, a metastable high-spin state can be populated at low temperature either by irradiation into d-d or MLCT absorption band of the ground state, or by fast cooling. One of the major target of such excited state trapping concerns the increase of the lifetime
40
of the trapped state. To do so, an early attempt to correlate the SCO temperature with the thermal relaxation temperature after LIESST was reported by Herber et al..13 but it was really Hauser in 1991
who introduced the first quantitative guideline allowing some expectation on the lifetime of the photo-induced HS state.14 Hauser
45
has carefully investigated the dynamics of the photo-induced state in different diluted SCO compounds and demonstrated that its lifetime is inversely proportional to T1/2. This relation became
known as the inverse-energy-gap law.14,15
Later on, Létard et al. introduced the so-called T(LIESST)
50
measurement, which aimed to estimate the limiting temperature above which the photoinduced HS metastable state was erased.16
This approach has been applied up to now to more than eighty SCO materials and, by comparing the various materials, some chemical levers were evidenced.17-23 In particular, the influence of the inner
55
FeN6 coordination sphere, more precisely the degree of
coordination of the metal centre and the distortion of the coordination sphere, on the stabilization of the photoinduced HS state seems to be one of the key factors.22-24 This finding lends
support to the idea that the photomagnetic properties are somehow
60
governed at the molecular scale and then linked to the inner metal coordination sphere.23,25 In particular, it has been shown that ligand
having high denticity in general, and macrocyclic ligand in particular, were favouring high T(LIESST) values. Following this ascertainment, we have decided to investigate the magnetic and
65
photomagnetic properties of a large number of iron(II) complexes involving macrocyclic ligands.26 It appeared that the high
T(LIESST) or T(TIESST) values were associated with molecules exhibiting a change in their coordination sphere, between FeN3C2O and FeN3C2O2 geometries. This can be viewed as a huge
70
distortion of the coordination sphere along the SCO.
In the present work, we wanted to promote and study the interplay between the complex thermal spin crossover feature of one of these macrocyclic SCO complexes and the related T(TIESST) curve (Figure 1). To do so, we performed solid
75
solutions of the nominal compound [Fe(L222N3O2)(CN)2]ꞏH2O.
Here, a solid solution means that the elastic interactions between the iron centres within the solid are more or less interrupted by the partial substitution of iron by a metal that does not undergo SCO. This approach has been successfully used to understand the
80
thermal spin-crossover and the relaxation behavior27 and also to
2 |
hysteresis curve28. Therefore, we report the influence of the
introduction of Mn(II) ion on the modification of the thermal-SCO features as well as the metastability of the HS state generated by a thermal quenching. In addition, we present and discuss the X-ray diffraction crystal structures of the [Mn(L222N3O2)(CN)2]ꞏH2O
5
complex as well as two metal diluted complexes, i.e. [FexMn 1-x(L222N3O2)(CN)2]ꞏH2O with x = 0.963 ± 0.005 and x = 0.638 ±
0.009.
Fig. 1.Magnetic properties of [Fe(L222N3O2)(CN)2]ꞏH2O from previously
10
reported SQUID measurements.26b,26d
Let us first recall that the different works already done have elucidated the atypical properties of [Fe(L222N3O2)(CN)2]ꞏH2O.
Figure 1 presents a summary of the various correlations between structure and magnetic properties (with M being the molar
15
magnetic susceptibility and T the temperature).26b,26d Briefly, the
compound undergoes a thermal spin crossover at 155 K upon cooling but, depending on the experimental protocol, different phases and different levels of conversion can be achieved. Crystallographic studies clearly demonstrated that the HS to LS
20
spin crossover occurs concomitantly with a modification of the metal environment from a 7 coordinence in the HS state to a 6 coordinence in the LS state.26d The resulting phase diagram
appears quite complex (Figure 1). The phase B (LS-6 coordination) (T = 120 K, P21/c, a = 10.624(4) Å, b = 11.916(4) Å, c = 14.676(5)
25
Å, = 105.08(5)°, V = 1793.91(11) Å3) appears from the slow
cooling (of typically 2 hours, about 2 K min-1) of the high spin state
(HS-7 coordination), namely phase A (T = 300 K, C2/c, a = 17.326(5) Å, b = 12.054(5) Å, c = 10.125(5) Å, = 116.27(1)°, V = 1896.2(13) Å3). The phase C (T = 120 K, C2/c, a = 33.886(3) Å,
30
b = 22.822(3) Å, c = 20.672(2) Å, = 113.99(9)°, V = 14064.5(5) Å3) attributed to the mixed HS/LS state may be reached if the
cooling is much slower than 2 h. Being observed for the slowest cooling rate, phase C seems to be the ground state at low temperature. From the crystallography point of view, phase C
35
corresponds to a stack of HS and LS complexes respectively hepta and hexa coordinated within the crystal-packing built from a unit-cell eight times larger than in phase B. Note that for phase C, the single-crystals quality systematically suffers from this transition which did not allow to get an accurate crystal-structure (Robs= 0.19)
40
preventing to describe in details intermolecular interactions for example but, due to the large modifications of intramolecular geometries in HS and LS, it was largely enough to distinguish between hepta- and hexa- entities.29 Note that a crystal-structure
refinement for phase C performed in the simple cell - thus with
45
only one independent entity - (Robs = 0.13) leads to Fe-ligands bond
lengths intermediate of those expected in HS-hepta and LS-hexa.29
The latter clearly demonstrated that the real structure of phase C is
based on a mixture of HS-hepta and LS-hexa entities From phase
B by irradiation a metastable HS state, Phase B* (T = 111 K, C2/c,
50
a = 16.825(5) Å, b = 11.947(5) Å, c = 10.213(5) Å, = 116.05(5)°, V = 1847.51(13) Å3) can be obtained with a T(LIESST) of 135 K.
Therefore, this compound appears as a very rare example of modification of degree of coordination triggered by SCO26d,30.
Only another remarkable example from the same family of
55
compound has been recently reported31. Regarding the properties’
complexity of this system and the proximity of the T(LIESST) and the thermal SCO, [FexMn1-x(L222N3O2)(CN)2]ꞏH2O solid solutions
are thus of high interest for the spin crossover community to promote unusual interplay between coordination change and metal
60
dilution.
Experimental Section
Materials
The synthesis of the [MII(L222N3O2)(CN)2]ꞏH2O complex (M = FeII
or MnII) was performed by using the same protocol described by
65
Nelson et al.32 for the [Fe(L222N3O2)(CN)2]ꞏH2O. The diluted
compounds [FexMn1-x] were synthesized according to the same procedure, replacing the metal salt by mixtures of iron(II) chloride and manganese(II) chloride in given ratios. The macrocyclic ligand L222N3O2 is a Schiff base formed by condensation of a diketone
70
and a diamine. Upon formation of the macrocyclic complex, M(II) ion is coordinated to the interior of L222N3O2 ligand and two
cyanide groups are then completing the coordination sphere of the ion M(II) in axial position. In detail, the synthesis of complexes was performed under anaerobic conditions (Schlenk line) and all
75
solvents used were degassed. The reaction route is represented in Scheme 1 for Mn(II) analogue. The synthesis was carried out in 10 mL of methanol and 5 mL of water in which were dissolved 0.188 g (1.5 mmol) of manganese chloride, 0.25 g (1.5 mmol) of 2,6-diacetylpyridine, and 0.05 g of sodium dithionite. The 3,6-diamine
80
dioxaoctane-1,8-diamine (0.23 mL, 1.5 mmol) was added dropwise. The mixture was kept at reflux under nitrogen gas for 16 h. A transparent orange solution was obtained. After filtration to remove impurities, 5 mL of aqueous solution containing an excess of sodium cyanide NaCN (1 g, 0.02 mol) was added, the solution
85
turns dark orange. This solution was left in the fridge for two days, and then the brown crystals appeared in a cubic shape.
The elemental analysis of C, H, N was performed using a FlashEATM 1112 elemental analyzer. The values of the iron
fractions (x) were calculated from the iron and manganese atomic
90
percentages determined by quantitative analysis (ICP/OES Varian 720 ES), the sample being mineralized in hydrochloric acid prior to ICP analysis. The corresponding results are gathered in Table SI.1 in Electronic Supplementary Information (ESI). The experimental and calculated values are in good agreement (Fig. SI.1).
95
The composition of single crystals of mixed Fe/Mn compounds was obtained for two ratios, using a microprobe spectrometer CAMECA SX100. Ten crystals from the same synthetic batch of each ratio were measured, leading to the mean compositions
[FexMn1-x(L222N3O2)(CN)2]ꞏH2O with x = 0.963 ± 0.005 and x =
100
0.638 ± 0.009. It indicates the strong homogeneity of the crystallization process and the resulting crystals.
Scheme 1. Scheme of the synthesis of [Mn(L222N3O2)(CN)2]ꞏH2O.
Physical Measurements
The thermal spin transitions of all the investigated compounds
5
were followed in both cooling and warming modes by magnetic susceptibility measurements. T1/2 and T1/2 are usually defined as
the temperatures for which there are 50% of LS and HS molecules in the cooling and warming modes, respectively. Magnetic susceptibilities were measured in the 10–300 K temperature range,
10
under an applied magnetic field of 1 T, using a MPMS5 SQUID magnetometer (Quantum Device). The samples were precisely weighted and corrections (using Pascal constants) were applied to account for the compounds’ and the sample holder’s diamagnetic contributions. The procedure to record the T(TIESST) properties
15
was as previously published.16-18,20 The samples were rapidly
quenched to 10 K by inserting the sample in less than 5 s from room temperature down to the cavity of the SQUID previously placed at 10 K. After thermal stabilization, the temperature was then slowly increased at 0.3 K min–1 and the extreme of the δχMT
20
/δT versus Tplots gave the T(TIESST) values.
Single crystal X-ray diffraction data for the structure determination of the three complexes were collected using a Bruker-Nonius diffractometer κ-CCD (λ = 0.7170 Å) at 300 K and 120 K to mimic the data published for the iron analogue.26d The
25
crystal structures were determined and refined using SHELX-97 and SHELX-201333 within the WinGX environment.34. Cif files
were deposited at CCDC under the numbers CCDC 1849970-1849974. All the crystal structures are of very good quality (table SI2-SI4). The powder X-Ray diffraction were performed on a
30
PANalytical X’Pert Pro diffractometer.
Results and Discussion
35
Structural characterization
.The X-ray powder diffraction of [Fe(L222N3O2)(CN)2]ꞏH2O and
diluted compounds [FexMn1-x] have been recorded and all the compounds appeared isostructural (see Fig. SI.2). Crystals of the
40
[Mn(L222N3O2)(CN)2]ꞏH2O complex as well as two metal diluted
complexes, i.e. [FexMn1-x(L222N3O2)(CN)2]ꞏH2O with x = 0.963 ±
0.005 and x = 0.638 ± 0.009, suitable for Single-Crystal X-ray analysis were obtained by using the same protocol previously described for the neat iron(II) compound.22
45
Structural determination of [Mn(L222N3O2)(CN)2]ꞏH2O was
firstly performed at 270 K. The [Mn(L222N3O2)(CN)2]ꞏH2O
complex presents a hepta-coordinated state (MnN3C2O2), in a
monoclinic C2/c space group. The Mn(II) atom is in a pentagonal bipyramidal environment and is located on a twofold axis. The
50
asymmetric unit contains only half of a complex. The bond lengths around manganese atom are : Mn1-N1 : 2.214(1) Å, Mn1-N2 : 2.2676(9) Å, Mn1-O1 : 2.308(1) Å and Mn1-C1 2.284(2) Å. The cell parameters at 270 K (a = 17.5613(3) Å, b = 12.0994(2) Å, c = 10.17850(10) Å, = 116.5790(10)°, V = 1934.18(5) Å3, Z = 4)are
55
similar to the ones of the iron(II) analogue. At 120 K [Mn(L222N3O2)(CN)2]ꞏH2O stays in the monoclinic C2/c space
group (a = 17.093(3) Å, b = 11.990(2) Å, c = 10.330(2) Å, = 113.011(2)°, V = 1893.1(8) Å3, Z = 4). The bond lengths around
manganese atom are ranging between : 2.14 and 2.15 Å for
Mn-60
Npyr; 2.68 and 2.69 Å for Mn-Nimine; 2.31 and 2.32 Å for Mn-O;
2.72 and 2.84 Å for Mn-C (Npyr being the nitrogen of the pyridine
ring and Nimine the nitrogen of the imine functions). The three
Mn(II) centers remain in hepta-coordinate state at 120 K. At 270 K (Fig.2a) and 120 K (Fig.2b), the hydrogen bonding
65
between the water molecule and the axial cyanide anions from infinite one dimensional chain, similarly to phase A of the iron analogue.
70
Fig. 2. Projection of the crystal packing of [Mn(L222N3O2)(CN)2]ꞏH2O: a)
270 K; b) 120 K. Hydrogen atoms have been omitted for clarity. 75
For the diluted systems, in addition to the powder form, single crystals of [FexMn1-x(L222N3O2)(CN)2]ꞏH2O complexes (with x =
0.963 ± 0.005 and x = 0.638 ± 0.009) were also obtained by vapor diffusion method. Crystal determination of the two diluted compounds was performed at room temperature for both dilutions
80
and at low temperature for the
[Fe0.638Mn0.362(L222N3O2)(CN)2]ꞏH2O system (See crystal data in
ESI). Nevertheless, despite our efforts it was impossible to solve the structure of [Fe0.963Mn0.037(L222N3O2)(CN)2]ꞏH2O complex at
low temperature. These crystals are isomorphous at room
85
temperature with pure [Mn(L222N3O2)(CN)2]ꞏH2O and
[Fe(L222N3O2)(CN)2]ꞏH2O. At low temperature, the
[Fe0.638Mn0.362(L222N3O2)(CN)2]ꞏH2O compound keeps the same
space group and similar cell parameters as at high temperature. Note that the attempts to distinguish Mn(II) atoms subsitute the
90
Fe(II) atomic positions and the resulting Mn and Fe atomic positions was unsuccessful on the same site due to the vicinity of their atomic diffusion factor. This is the sign that iron and manganese are randomly distributed in the solid.
95
Fig. 3. Superposition of the [Mn(L222N3O2)(CN)2] complex at room
temperature (orange) with (a) [Fe(L222N3O2)(CN)2] in HS (light blue), (b)
[Mn(L222N3O2)(CN)2] at low temperature (violet) and (c) with
[Fe0.638Mn0.362(L222N3O2)(CN)2] (light green). 100
The average Root-Mean-Square Deviation (RMSD) gives a basic comparison of the molecular shapes24,35 through the
superimposition of the different complexes studied here (Figure 3 b)
4 |
and table SI.5). Learnings are: i) at room temperature, Mn and Fe complexes appear very similar, RMSD being indeed very small (0.058 Å) - the geometry taken for the manganese compound is the one for the pure compound [Fe(L222N3O2)(CN)2]ꞏH2O at 300 K
(phase A of figure 1) -; ii) the structural transition that occurs at
5
low temperature in the Mn complex crystal-packing also affects its molecular geometry, the average RMSD between RT and LT is weak (0.085 Å) but the maximum (0.267 Å) looks quite high indicating significant changes; iii) the average complex in FexMn 1-x compounds is very close to the Fe one (RMSD from 0.012 to
10
0.021 Å); iv) when x decreases the average FexMn1-x complex
moves towards the Mn one - incidentally, this means that the geometry of the Mn ion is the same in a Fe matrix, thus within the FexMn1-x crystal-packing, as in the Mn crystal-packing - and v) in
FexMn1-x compounds, for x=0.64, the molecular shape is identical
15
at high and low temperature - this means that all the Fe complexes are in HS whatever the temperature. The relatively high RMSD values obtained between Fe0.64Mn0.36 and Mn complexes at low
temperature (0.095 Å) reveal that thermal-induced structural effects are also frozen in the Mn complexes within the FexMn1-x
20
material.
All studied compounds are isostructural, having the same C2/c space group and similar cell parameters than phase A of pure Fe compound. The studied compounds retain the same structure when the temperature is decreased unlike the pure Fe compound that
25
shows a modifications of space group at low temperature when Fe ions change of spin-state. It seems that since Mn complex remains seven coordinated whatever the temperature, when diluted in a surrounding of Mn complexes, the Fe complexes also remain in their high spin state, the HS to LS conversion of Fe being blocked
30
by the high spin Mn complexes. To support this assumption, note that the favoring of the HS state of Fe by the introduction of Mn is also clearly observed by magnetic measurements (vide infra).
Magnetic characterization.
35
In this present work, we focus on the influence of Mn(II) dilution on the thermal SCO as well as on the metastability of the HS state generated by a rapid thermal quenching. The influence of the cooling and warming rate on SCO properties is also emphasized.
The magnetic behavior of the metal diluted [FexMn
1-40
x(L222N3O2)(CN)2]ꞏH2O is recorded through the thermal
dependence of the MT product. For the two
[Fe(L222N3O2)(CN)2]ꞏH2O and [Mn(L222N3O2)(CN)2]ꞏH2O
complexes, the MT values at room temperature were
experimentally measured as 3.01 cm3mol-1 K and 4.38 cm3mol-1 K.
45
For pure Mn(II) complex, MT product remained constant down to
10 K, in agreement with the Mn(II) ion remaining high spin between room temperature and 10 K. the The MT product of the
diluted [FexMn1-x] systems was found to increase with the metal dilution due to the paramagnetic contribution of the manganese(II)
50
ion (d5, S = 5/2). The MT product is, in fact, the sum of the
contributions of iron(II) and manganese(II) ions (Eq. (1)), and consequently the MT relative to 1 mol of [Fe] entities is expressed
by Eq. (2). The HS fraction (HS) of iron(II) ions is finally directly
proportional to (MT)Fe since the LS state of iron(II) is diamagnetic
55
(Eq. (3)). The T1/2 value was estimated as the temperature at which
HS takes the particular value HS = (1 - rHS)/2, with rHS the residual
paramagnetic quantity at low temperature (i.e. 50 K).
𝜒 𝑇
𝑥 𝜒 𝑇
1
𝑥 𝜒 𝑇
(1)
𝜒 𝑇
(2)
60
𝛾
(3)
It has been demonstrated for the [Fe(L222N3O2)(CN)2]ꞏH2O
compound that the magnetic and photomagnetic properties originate within the thermal spin crossover history.26b Depending
on the thermal pre-treatment of the complex, two different forms
65
can be reached at low temperature, respectively the LS state and the LS/HS state. In fact, when the cooling rate was 3 K/min the LS form was effectively measured at low temperature while with a rate of 1 K/min only the LS/HS mixture state was found.26b Thus we
decided, first, to study the influence of the cooling and warming
70
rate on SCO properties of the diluted [FexMn1-x] systems. To illustrate this effect, we investigate the influence of the rate of changing the temperature for two mixed complexes with x = 0.966 and x = 0.949. The temperature dependence of (χMT)Fe is presented
in Fig.4 with temperature scan rates from 1 Kmin-1 to 5 Kmin-1.
75
Fig.4. Temperature dependence of (χMT)Fe for [FexMn
1-x(L222N3O2)(CN)2]ꞏH2O with x = 0.966 (left) and x = 0.949 (right) at a) 1
Kmin-1; b) 2 Kmin-1 and c) 5 Kmin-1. Solid lines are added in order to follow
80
the SCO properties. The measurementswere preformed first on cooling (1),
then on warming (2).
For x = 0.966, with a rate of 1 Kmin-1, the spin crossover is
incomplete (T1/2↓ = 185 K, T1/2↑ = 220 K), with a hysteresis loop
85
of 35 K. The (χMT)Fe product at 150 K is equal to 1.98 cm3mol-1K
(γHS = 0.53). In regard to the pure [Fe(L222N3O2)(CN)2]ꞏH2O
complex, this behavior can be attributed to the transition between HS state and the mixed HS/LS state. Only the width of the hysteresis is slightly reduced in regard to the iron complex (40
90
K).26b At a rate of 2 Kmin-1, a gradual transition occurs in the
vicinity of 200 - 160 K with T1/2↓ = 179 K with a very high residue
at 110 K (γHS = 0.72). On the warming mode, the magnetic signal
0 50 100 150 200 250 1.5 2.0 2.5 3.0 3.5 4.0 4.5 T / K ( M T)Fe / cm 3 K mol -1 a) 1 2 0 50 100 150 200 250 1.5 2.0 2.5 3.0 3.5 4.0 4.5 b) T / K ( M T)Fe / c m 3 K m o l -1 1 2 0 50 100 150 200 250 1.5 2.0 2.5 3.0 3.5 4.0 4.5 c) T / K ( M T)Fe / c m 3 K mol -1 2 1 0 50 100 150 200 250 1.5 2.0 2.5 3.0 3.5 4.0 4.5 a) T / K ( M T)Fe / cm 3 K mo l -1 1 2 0 50 100 150 200 250 1.5 2.0 2.5 3.0 3.5 4.0 4.5 b) T / K ( M T)Fe / cm 3 K m ol -1 2 1 0 50 100 150 200 250 1.5 2.0 2.5 3.0 3.5 4.0 4.5 c) T / K ( M T)Fe / c m 3 K mo l -1 1 2 x = 0.966: x = 0.949: [FexMn1-x(L222N3O2)(CN)2]ꞏH2O
displays a bump and recovers the initial HS (χMT)Fe value at T1/2↑
= 220 K. In the case of 5 Kmin-1, the magnetic signal slightly
decreases on the cooling mode but remains almost in HS state even until 110 K (γHS = 0.98). On the warming mode, the magnetic
behavior is similar to the rate of 1 Kmin-1 and 2 Kmin-1, with the
5
occurrence of a bump. To summarize, the [FexMn 1-x(L222N3O2)(CN)2]ꞏH2O complex with x = 0.966 presents a strong
influence of the temperature scan rate. With a rate of 1 Kmin-1, the
behavior is similar to the properties of the pure [Fe(L222N3O2)(CN)2]ꞏH2O in its second thermal cycle; i.e. a
10
transition from HS state to HS/LS mixed state. With higher cooling rate, the HS state appears partially quenched. With a rate of 5 Kmin-1, the spin change of iron compound can only be observed
upon warming.
For x = 0.949, with the cooling mode of 1 Kmin-1, the magnetic
15
signal first decreases down to 3.40 cm3mol-1K (110 K, γHS = 0.91)
and then remains stable. On the warming mode, the magnetic signal first decreases in the vicinity of 110 K to 150 K, reaching 1.85 cm3mol-1K at 151 K (γHS = 0.49), then increases. A second
decrease can be observed at 160 K, reaching a minimum of 2.93
20
cm3mol-1K at 202 K (γHS = 0.78). Finally (χMT)Fe value recovers
the initial value of HS state. For 2 Kmin-1, the magnetic behavior
is very similar to results obtained with a cooling rate of 1 Kmin-1.
We observe the same bump on the warming mode with two minimum at 152 K with a value of 3.05 cm3mol-1K (γHS = 8.16)
25
and at 202 K with a value of 2.73 cm3mol-1K (γHS = 0.73). For 5
Kmin-1, the behavior is totally different. The magnetic signal
remains stable during the cooling mode and the warming mode. Almost all the iron(II) ions remain kinetically blocked into the HS state.
30
The insertion of Mn(II) ions into the lattice strongly affects the SCO properties (Figure 4 compare to Figure 1). If we consider for instance a constant cooling rate of 1 Kmin-1, the metal diluted
complex (x = 0.949) displayed a very high HS residual fraction (Fig.4a right), while for x = 1 (Fig.3) and x = 0.966 (Fig.4a left), a
35
HS to HS/LS mixed state transition can be observed. This tendency is confirmed at a rate of 5 Kmin-1, where Fe(II) remains HS at any
temperature for x = 0.949. By increasing the percentage of the Mn(II) ions, the kinetics of the SCO phenomenon isslowed down while cooled down. Moreover, on warming those complexes
40
display a decrease of (χMT)Fe value in the vicinity of 150 K to 200
K, and the magnitude becomes more negligible with lower x value (high dilution).
Several remarks can be done: i) on the first cooling experiment for none of the metal diluted complexes, it was possible to record
45
the fully HS to LS transition. It seems that the insertion of Mn(II) ions tends to block the spin conversion of Fe complex between seven coordinated HS state and six coordinated LS state ; ii) for most of the measurements, on warming, (χMT)Fe vs.T curve
displays two minima at almost the same temperatures. Only the
50
proportion is changing as function of the metal dilution; iii) The insertion of Mn(II) metal ions seems to strongly affect the kinetic of the SCO process. When the metal dilution increases, it is necessary to decrease the cooling rate to observe the SCO phenomenon. In other words, the lower the temperature scan rate,
55
the higher the possibility to reach the HS/LS mixed state. On the contrary, increasing the temperature scan rate favors the inhibition of the SCO. These observations are somewhat in agreement with the previous remarks made in metal dilution studies.26,36-39 In
particular, when we reach the peculiar situation where the high
60
temperature stable HS phase overlaps with the low temperature metastable HS state.26,37c It was demonstrated that the overlap
between the two regimes favors the freezing of the SCO. More precisely, it has been suggested that HS state of Fe(II) is favoured
by Mn(II) dilution due to the large ionic radius of the last (ionic
65
radius are 83 pm for Mn(II) HS, 78 pm for Fe(II) HS and 63 pm for Fe(II) LS). To check the occurrence of such overlap, we investigated the quenching effect in the two metal diluted systems discussed before (x = 0.966 and x = 0.949). The simplest way to do so was to perform thermal trapping of the HS state.
70
For x = 0.966 two quenching experiments were performed. On the first experiment the magnetic signal was recorded immediately after trapping at 10 K with a warming rate of 1 Kmin-1 (Fig. 5a).
The complex is then in the metastable HS* state up to 120 K and then in a few kelvins the (χMT)Fe product drops drastically (position
75
2, Fig. 5a) to reach a minimum (χMT)Fe value at 148 K (0.59
cm3mol-1K). This (χMT)Fe product remains stable when
temperature was cooled back to 10 K (position 3). On the contrary, when the temperature overpasses 150 K, the magnetic signal increases to reach a maximum at 163 K (3.44 cm3mol-1K, position
80
4) then decreases down to 2.00 cm3mol-1K at 205 K. A subsequent
1 hour kinetic experiment at 205 K did not further decrease the χMT
value (position 5). The value remains even stable when temperature was further varied in the vicinity of 205 K – 10 K (position 6). From 205 K to 230 K the magnetic signal keeps
85
increasing with a T1/2↑ = 220 K (position 7).
The second set of experiment performed on x = 0.966 (Fig. 5b) consists of a fast cooling of the sample at 10 K, in its 100% metastable HS* state, and to record the kinetic at 148 K during 4 hours. During the first hour, the (χMT)Fe product strongly decreases
90
to reach a value of 0.38 cm3mol-1K and then remains almost stable
in the next 3 hours. Subsequent experiment by cooling temperature down to 10 K illustrated that this value is stable. From 148 K to 250 K the magnetic behavior seems to be similar with the first trapping experiment in Fig. 5a i.e. the formation of a maximum
95
(position 4) and a minimum (position 5) before coming back to room temperature (HS state).
Fig. 5. Temperature dependence of (χMT)Fe for [FexMn
1-x(L222N3O2)(CN)2]ꞏH2O with x = 0.966 after fast cooling measurement: a)
100
measurement started from 10 K. The numbering has been added to follow sequence of the measurement; b) kinetic at 148 K. Solid lines and dashed lines are added in order to follow the SCO behavior.
Concerning the complex [FexMn1-x(L222N3O2)(CN)2]ꞏH2O
105
with x = 0.949 (Fig. 6), fast cooling experiments followed by heating at a warming rate of 1 Kmin-1 were also performed. The
first set of measurement corresponds to a quenching from 10 K (Fig. 6a), and the second to study the relaxations at some selected temperature after trapping (Fig. 6b). From Fig.6a, it appears that
110
under quenching at 10 K, the metastable HS* state is populated. Then, the (χMT)Fe value only slightly decreases from 3.77 cm3mol -1K at 140 K to 2.90 cm3mol-1K at 154 K, suggesting a partial SCO
of about 23%. After that, the magnetic signal increases immediately to reach a (χMT)Fe value of 3.75 cm3mol-1K at 163 K.
115
A very small decrease can be observed at around 160 K up to 202 K. Finally, the signal recovers its initial value. The Fig. 6b reports the results of the kinetics performed at 148 K and 190 K after fast cooling at 10 K (these kinetics are plotted as a function of time in figure SI6). It reveals that the LS state and the mixed HS/LS state
120 0 50 100 150 200 250 0.0 0.5 1.0 1.5 2.0 2.5 3.0 3.5 4.0 4.5 0 50 100 150 200 250 0.0 0.5 1.0 1.5 2.0 2.5 3.0 3.5 4.0 4.5 7 6 5 4 3 2 T / K ( M T)Fe / c m 3 K m o l -1 a) 1 b) 148 K
6 |
are totally masked and can be in fact reached by performing some relaxation at selected temperature.
Fig. 6. Temperature dependence of (χMT)Fe for [FexMn
1-5
x(L222N3O2)(CN)2]ꞏH2O with x = 0.949 after fast cooling measurement with
a rate of 1 Kmin-1: a) measurement started from 10 K; b) kinetics at 148 K
and 190 K. Solid lines and dashed lines are added in order to follow the SCO properties.
10
From these series of results, it is obvious that kinetic effects control the access of the LS and HS/LS state on the metal diluted systems. All that confirms that the transition behavior of the diluted series [FexMn1-x(L222N3O2)(CN)2]ꞏH2O with x = 0.966 and x =
0.949 is highly dependent on the temperature scan rate, something
15
which was already true for the pure Fe compound (x = 1). To complete this analysis, we have performed the thermal trapping of the HS state and recorded the T(TIESST) curve to extract the T(TIESST) value, the temperature above which the Thermally-Induced Excited Spin-State is erased.16-18 T(TIESST)
20
measurements have been done at 0.3 Kmn-1 for a selection of metal
diluted complex with x = 1, 0.949, 0.930, 0.912, 0.892 and 0.853. Temperature dependence of (χMT)Fe is presented in Fig. 7 and
Table 1 collects the characteristic values. From the curves in Fig. 7, it can be seen that whatever the metal dilution, a first HS state
25
(i.e HS1) is obtained at 10 K, which corresponds to the metastable
HS* state obtained by fast cooling. On warming from 10 K, a decrease of the magnetic signal is obtained in thevicinity of 130 K to 150 K. For convenience, we propose to name this state LS1.
The increase of Mn(II) percentage appears to rise the residual HS
30
fraction as illustrated by the (χMT)Fe value of LS1. When the
temperature is further increased up to 170 K, a new increase of the magnetic signal happens. We named the maximum HS2. After that,
the magnetic signal decreases to reach a minimum at around 205
K. In regard to [Fe(L222N3O2)
35
(CN)2]ꞏH2O we propose to name this state LS2/HS3. Similarly to
what has been observed for the LS1 state, the minimum (χMT)Fe of
LS2/HS3 also increases significantly with an increase of Mn(II)
percentage. Finally at around 220 K, the (χMT)Fe value increases to
recover its initial HS4 value. Several comments can be made: i)
40
with metal dilution, the evolution of (χMT)Fe is less abrupt due to a
decrease of the cooperativity of the system already observed for other systems26,37c ii) compared with Fe(II), for all the metal
diluted complexes, HS1 and HS4 correspond to the Phase B* and
Phase A respectively (Fig. 1). Attention has to be paid on the
45
complex [FexMn1-x(L222N3O2)(CN)2]ꞏH2O with x = 0.853, which
remains HS from 10 K to 250 K. In this case HS1 and HS4 can not
be distinguished; iii) The LS1 of the metal diluted complexes is
associated with Phase B of pure Fe(II). We noticed an important increase of the χMT product of the LS1 with the metal dilution. This
50
can be understood by the previous works performed on dilution series,26,37c where complexes with Mn(II) metal dilution favor the
HS state; iv) the LS2/HS3 in metal diluted system is associated with
the Phase C of the pure iron complex (Fig. 1). Similarly with LS1,
the LS2/HS3 is under the strong influence of dilution effect.
55
Fig. 7. Temperature dependence of (χMT)Fe for [FexMn
1-x(L222N3O2)(CN)2]ꞏH2O of T(TIESST) experiment with x = 1 (in violet ■),
0.949 (in blue ■), 0.93 (in red ■), 0.912 (in green ■), 0.892 (in olive ■) and
0.853 (in black ■). 60
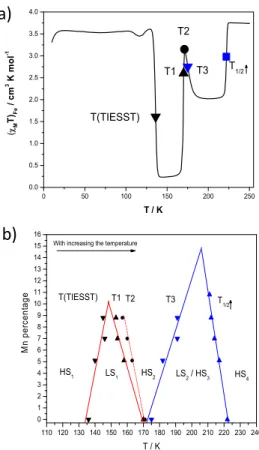
Upon the TIESST experiments with a warming rate of 0.3 Kmin-1, five characteristic temperatures for different Mn(II)
percentage can be obtained. With an increase of temperature, those important temperatures appear in the following order (Fig. 8a):
65
T(TIESST); T1: temperature at which 50 % of LS1 has transited to
HS2; T2: temperature at which (χMT)Fe is maximum, corresponding
to HS2; T3, temperature at which 50 % of HS2 has transited to
LS2/HS3 where obtains 50 % transition of LS2/HS3; and T1/2↑. The
values of those temperatures are listed in Table 1. From x = 1 to x
70
= 0.912, the five defined temperatures can be determined. For x = 0.853, none of the five temperatures are obtained. With this series of characteristic temperatures, we built the phase diagram presented on Fig. 8b.
Interestingly, the various characteristic temperatures indeed
75
can be well fitted with a linear relation as a function of Mn(II) percentage. T(TIESST) and T1 define the region where LS1 can be
obtained. T3 and T1/2↑ give the region where the LS2/HS3 is
formed. The linear fit of T(TIESST) and T1 meet at round 10.2 %
Mn(II). In other words, above this percentage, the LS1 could not be
80 0 50 100 150 200 250 0.0 0.5 1.0 1.5 2.0 2.5 3.0 3.5 4.0 4.5 0 50 100 150 200 250 0.0 0.5 1.0 1.5 2.0 2.5 3.0 3.5 4.0 4.5 T / K ( M T)Fe / c m 3 K m o l -1 a) b) 148 K 190 K 0 50 100 150 200 250 0.0 0.5 1.0 1.5 2.0 2.5 3.0 3.5 4.0 HS4 LS2 / HS3 HS2 LS1 x=0.853 x=0.892 x=0.912 x=0.93 x=0.949 x=1 T / K ( M T)Fe / cm 3 K m ol -1 HS1
Table1. Characteristic values obtained for the mixed [FexMn1-x(L222N3O2)(CN)2]ꞏH2O system (with x = 1, 0.949, 0.930, 0.912, 0.892 and 0.853).
SCO Systems T(TIESST) / K T1 / K T2 / K T3 / K T1/2↑ / K (χMT)Fe at 148 K (LS1) (χMT)Fe at 202 K (LS2/HS3)
x = 1 136 170 171 175 222 0.23 2.02 x = 0.949 140 158 163 182 217 0.71 2.16 x = 0.93 146 154 160 191 214 3.24 3.10 x = 0.912 145 153 157 191 212 3.59 3.42 x = 0.892 - - - - 211 3.72 3.57 x = 0.853 - - - 3.72 3.72
obtained. This is in perfect agreement with experimental result of
the complex with x = 0.892 (11%), where the LS1 can not be
reached during the TIESST measurement (Fig. 7). For LS2/HS3,
the meeting point is predicted at 14.8 % of Mn(II). However at x = 0.892 (11%), the experiment results already show that the LS2/HS3
5
is barely observed. Finally, T1/2↑ exhibits a decrease upon
substitution of iron ions by manganese, as expected for such metal dilution. Indeed, metal dilution is known to exert an internal pressure that depends on the size of the host ion. A doping metal ion, having no spin crossover, corresponds to a unit-cell volume
10
that differs from the one imposed by the iron ion. In the solid-solution, the bigger the doping ion, the larger the unit-cell and the larger is the volume available for the iron-ion within the crystal packing. Consequently, large unit-cells favor the state of larger volume of the iron(II), therefore the HS state. Accordingly, the
15
temperatures T1/2 are shifted to low temperatures when large metal
ions are used to dope the SCO material; HS residue being also favored.28, 37-39 Since manganese(II) ion has a larger ionic radius
than the HS iron(II), a decrease of T1/2 is expected.
20
Conclusions
In the present work, we have investigated the crystal structure of [Mn(L222N3O2)(CN)2]ꞏH2O and metal diluted [FexMn 1-x(L222N3O2)(CN)2]ꞏH2O series. It was evidenced that the
manganese centers were seven coordinated and the metal diluted
25
series was isomorphous with the Mn(II) and Fe(II) analogues at room temperature. Contrary to the pure Fe compound, the
compounds containing Mn do not show any phase transition upon cooling. From magnetic studies, strong kinetics effects were found in the powder samples of [FexMn1-x(L222N3O2)(CN)2]ꞏH2O series,
30
which resulted in HS residual at low temperature depending on cooling rate. Upon warming, partial SCO from the HS state to the HS/LS mixed state occurred on several metal diluted samples, which was under strong influence of the cooling/warming rate, indicating interest in the investigation of TIESST properties of the
35
metal diluted series. It has been observed that when x ≤ 0.892, the samples remain almost in HS state during the whole TIESST measurement while the phase diagram appears more complicated for higher x values. Five temperatures have been defined to describe this phase diagram. As a result, clearly, playing on the
40
dilution rate allows to control the degree of conversion and the temperature required to get the different phases.
As conclusion, we have observed that the SCO properties of the metal diluted complex are strongly influenced by the kinetic effect. In consequence, the transition between HS and LS2/HS3
45
states can be hidden if we consider the samples with x 0.892. For this reason, we have decided to investigate in more detail the hidden transition, i.e. to probe by thermal relaxation and/or light irradiation to study whether the predicted HS to LS2/HS3 transition
may appear. The work is currently in progress.
50
Conflicts of interest
There are no conflicts of interest to declare
Acknowledgements
55
We thank the Department of Cooperation and Cultural Action Embassy of France to Dakar-Sénégal, the University of Ziguinchor and its Department of Cooperation and Research, the Ministry of Higher Education and Research of Sénégal (Program FIRST) and CAMPUS France. This work was also supported by the University of Bordeaux, the CNRS, the Region 60
Nouvelle Aquitaine and by the LabEx AMADEus (ANR-10-LABX-42) within IdEx Bordeaux (ANR-10-IDEX-03-02), i.e. the Investissements d’Avenir programme of the French government managed by the Agence Nationale de la Recherche. The ANR is also warmly acknowledge (ANR femtomat n° 13-BS04-002). The UMS PLACAMAT is acknowledged for 65
the microprobe measurements.
Notes and references
aCNRS, Univ. Bordeaux, ICMCB, UMR 5026, F-33600 Pessac, France.
Fax: (+33) 540002649. Tel (+33) 540002678. Email:
guillaume.chastanet@icmcb.cnrs.fr, cedric.desplanches@icmcb.cnrs.fr
70
bLaboratoire de Chimie et Physique des Matériaux (LCPM) Université de
Ziguinchor Bp: 523 Ziguinchor- Sénégal. Fax: (+221) 339916809. Tel
(+221) 339916809. Email: cbalde@univ-zig.sn
1 a) J. M. Lehn, Science., 2002, 295, 2400; b) M. Ruben, U. Ziener, J. 75
M. Lehn, V.Ksenofontov, P. Gütlich, G. B. M. Vaughan, Chem. Eur.
J., 2005, 11, 94; c) M. Fujita, D. Oguro, M. Miyazawa, H. Oka, K.
Yamaguchi, K. Ogura, Nature., 1995, 378, 469; d) O. M. Yaghi, M. O’Keeffe, N. W. Ockwig, H. K. Chae, M. Eddaoudi, J. Kim, Nature., 2003, 423, 705.
80
2 E. Breuning, M. Ruben, J. M. Lehn, F. Renz, Y. Garcia, V. Ksenofontov, P. Gütlich, E. Wegelius, K. Rissanen, Angew. Chem., 2000, 112, 2563; Angew. Chem. Int. Ed., 2000, 39, 2504.
3 Spin Crossover in Transition Metal Compounds I−III. In Topics in Current Chemistry; P. Gütlich. H-A. Goodwin., Eds.; Springer-85
Verlag: Berlin, Germany, 2004; Vols. 233−235.
4 O. Kahn, C. J. Martinez, Science., 1998, 279, 44.
5 A. Bousseksou, G. Molnar, L. Salmon, W. Nicolazzi, Chem. Soc.Rev., 2011, 40, 3313.
6 a) Spin-Crossover Materials, Properties and Applications (Ed.: M. A. 90
Halcrow), John Wiley & Sons, Ltd., 2013; b) H. Banerjee, S. Chakraborty, T. Saha-Dasgupta, Inorganics, 2017, 5, 47; c) A.
Fig. 8. a) Illustration of the five defined temperatures on a T(TIESST)
curve. b) Phase diagram built from the characteristic temperatures for different Mn(II) percentage. ▼ T(TIESST); ▲ Temperature 1, ●
Temperature 2;▼ Temperature 3, and ▲ T1/2↑. Solid and dotted lines in
red and blue are the linear fit of the corresponding temperatures.
0 50 100 150 200 250 0.0 0.5 1.0 1.5 2.0 2.5 3.0 3.5 4.0 T1/2 T3 T2 T / K ( M T)Fe / cm 3 K m o l -1 T(TIESST) T1 110 120 130 140 150 160 170 180 190 200 210 220 230 240 0 1 2 3 4 5 6 7 8 9 10 11 12 13 14 15 16 T3 T2 T1 T(TIESST) HS4 LS2 / HS3 HS2 LS1 M n per cen tag e T / K
With increasing the temperature
HS1
T1/2
a)
8 |
Sugahara, H. Kamebuchi, A. Okazawa, M. Enomoto, N. Kojima, Inorganics, 2017, 5, 50
7 P. Gütlich, A. B. Gaspar, Y. Garcia, Beilstein J. Org. Chem., 2013, 9, 342.
8 a) M. M. Khusniyarov, Chem. Eur. J., 2016, 22, 15178; b) Z.-P. Ni, J.-5
L. Liu, N. Hogue, W. Liu, J.-Y. Li, Y.-C. Chen, M.-L. Tong, Coord.
Chem. Rev., 2017, 335, 28
9 J. Hasserodt, J. L. Kolanowski, F. Touti, Angew. Chem. Int. Ed., 2014, 53, 60; Angew. Chem., 2014, 126, 60.
10 K.S. Kumar, M. Ruben, Coord. Chem. Rev., 2017, 346, 176. 10
11 J.-F. Létard, P. Guionneau, L. Goux-Capes, Top. Curr. Chem., 2004, 235, 221.
12 a) S. Decurtins, P. Gütlich, C.P Kohler, H. Spiering, A. Hauser, Chem.
Phys. Lett., 1984, 105, 1 ; b) S. Decurtins, P. Gütlich, K.M Hasselbach,
A. Hauser, H. Spiering, Inorg. Chem., 1985, 24, 2174; c) A. Hauser, 15
Chem. Phys. Lett., 1986, 124, 543; d) A. Hauser, Top. Curr. Chem,,
2004, 234, 155.
13 a) R. Herber, L.M. Casson, Inorg. Chem., 1986, 25, 847; b) R. Herber,
Inorg. Chem., 1987, 26, 173.
14 A. Hauser, Coord. Chem. Rev., 1991, 11, 275. 20
15 A. Hauser, C. Enaschescu, M. L. Daku, A. Vargas, N. Amstutz, Coord.
Chem. Rev., 2006, 250, 1642.
16 a) J.-F. Létard, P. Guionneau, L. Rabardel, J.A.K. Howard, A.E. Goeta, D. Chasseau, O. Kahn, Inorg. Chem., 1998, 37, 4432; b) M. Marchivie, P. Guionneau, J. F. Létard, D. Chasseau, J. A. K. Howard, J. Phys. 25
Chem. Solids., 2004, 65, 17.
17 J.-F. Létard, L. Capes, G. Chastanet, N. Moliner, S. Létard, J.-A. Real, O. Kahn, Chem. Phys. Lett., 1999, 313, 115.
18 S. Marcén, L. Lecren, H.A. Goodwin, J.-F. Létard, Chem. Phys. Lett., 2002, 358, 87.
30
19 a) S. Hayami, Z.-Z. Gu, Y. Einaga, Y. Kobayashi, Y. Ishikawa, Y. Yamada, A. Fujishima, O. Sato, Inorg. Chem., 2001, 40, 3240; b) J. S. Costa, P. Guionneau, J.-F. Létard, J. Phys.: Conference Ser., 2005, 21, 67.
20 a) N. Shimamoto, S.-S. Ohkoshi, O. Sato, K. Hashimoto, Inorg. Chem., 35
2002, 41, 678; b) R. Lebris, C. Mathonière, J.-F. Létard, Chem. Phys.
Lett., 2006, 426, 380.
21 D. Li, R. Clérac, O. Roubeau, E. Harte, C. Mathonière, R. Le Bris, S. M. Holmes, J. Am. Chem. Soc., 2008, 130, 252.
22 J.-F. Létard, P. Guionneau, O. Nguyen, J.S. Costa, S. Marcén, G. 40
Chastanet, M. Marchivie, L. Goux-Capes, Chem. Eur. J., 2005 11, 4582.
23 a) J. F. Létard, J. Mater. Chem. 2006, 16, 2550; b) J.-F. Létard, G. Chastanet, O. Nguyen, S. Marcén, M. Marchivie, P. Guionneau, D. Chasseau, P. Gütlich in “Molecular Magnets Recent Highlights", Eds 45
W. Linert & M. Verdaguer, Springer Wien N.-Y. 2003, 49; c) J.-F. Létard, G. Chastanet, P. Guionneau, C. Desplanches, in Spin Crossover Materials: Properties and Applications, Ed. Malcom A. Halcrow, 2013, John Wilfreysey & sons, 475.
24 P. Guionneau, Dalton Trans., 2014, 43, 382. 50
25 S. Bonhommeau, N. Brefuel, V.K. Palfi, G. Molnar, A. Zwick, L. Salmon, J.-P. Tuchagues, J.S. Costa, J.-F. Létard, H. Paulsen, A. Bousseksou, Phys. Chem. Chem. Phys., 2005, 7, 2909.
26 a) P. Guionneau, J-S. Costa, J.-F. Létard, Acta Cryst., 2004, C60, m587; b) J-S. Costa, P. Guionneau and J-F. Létard, Journal of Physics: 55
Conf. Series., 2005, 21, 67; c) J-S. Costa, C. Baldé, C. Carbonera, D.
Denux, A. Wattiaux, C. Desplanches, J-P. Ader, P. Gütlich and J-F Létard, Inorg. Chem., 2007, 46, 4114; d) P. Guionneau, F. Le Gac, A. Kaiba, J-S. Costa, D. Chasseau and J-F. Létard, Chem. Commun., 2007, 3723-3725; e) R. Ababei, C. Pichon, O. Roubeau, Y-G Li, N. 60
Bréfuel, L. Buisson, P. Guionneau, C. Mathonière and R. Clérac, J.
Am. Chem. Soc., 2013, 135, 14840; f) H. Wang, C. Sinito, A. Kaiba,
J-S. Costa, C. Desplanches, P. Dagault, P. Guionneau, J-F Létard, P. Negrier and D. Mondieig, Eur. J. Inorg. Chem., 2014, 4927–4933; g) H. Wang, A. Grosjean, C. Sinito, A. Kaiba,ab C. Baldé, C. 65
Desplanches, J-F. Létard and P. Guionneau, CrystEngComm, 2015, 17, 4075.
27 (a) A. Hauser, Coord. Chem. Rev., 1991, 111, 275; (b) J. Jeftic and A. Hauser, J. Phys. Chem. B., 1997, 101, 10262; (c) H. Romstedt, A.
Hauser and H. Spiering, J. Phys. Chem. Solids., 1998, 59, 265; (d) A. 70
Vef, U. Manthe, P. G ütlich and A. Hauser, J. Chem. Phys., 1994, 101,
9326; e)M.S. Sylla, C. Balde, N. Daro, C. Desplanches, M. Marchivie,
G. Chastanet, Eur. J. Inorg. Chem. 2018, 297.
28 a) N. Paradis, G. Chastanet, J.-F. Létard, Eur. J. Inorg. Chem., 2012, 3618 ; b) N. Paradis, G. Chastanet, F. Varret, J.-F. Létard, Eur. J.
75
Inorg. Chem., 2013, 968 ; c) N. Paradis, G. Chastanet, T. Palamarciuc,
P. Rosa, F. Varret, K. Boukheddaden, J.-F. Létard, J. Phys. Chem. C., 2015, 119, 20039.
29 F. Le Gac, PhD, Univ. Bordeaux France, 2008
30 (a) R. T. Acha and M. Pilkington, Cryst. Eng. Comm, 2015, 17, 8897 80
and also Coordination Chemistry Reviews Volume 296, 15 July 2015, Pages 125-152
31 D. Aguila, P. Dechambenoit, M. Rouzieres, C. Mathoniere, R. Clerac,
Chem. Commun., 2017, 53, 11588.
32 S. M. Nelson, P. D. A. Mcllroy, C. S. Stevenson, E. König, G. Ritter, 85
J. Waigel, J. Chem. Soc. Dalton Trans., 1986, 991.
33 G. M. Sheldrick, SHELX97. Program for the Refinement of Crystal
Structures, Univ. of Gottingen, Germany, 1997; G. M. Sheldrick, Acta Crystallogr., Sect. A: Fundam. Crystallogr., 2008, 64, 112.
34 A. Altomare, M.-C. Burla, M. Camalli, G. Cascarano, C. Giacovazzo, 90
A. Guagliardi, A. G.-G. Moliterni, G. Polidori and R. Spagna, J. Appl.
Crystallogr., 1999, 32, 115; L.-J. Farrugia, WinGX suite for
small-molecule singlecrystal crystallography, J. Appl. Crystallogr., 1999, 32, 837.
35 E. Collet, P. Guionneau, C. R. Chimie, 2018, in press 95
36 a) T. Tayagaki, A. Galet, G. Molnar, M. Carmen Munoz, A. Zwick, K. Tanaka, J.-A. Real, A. Bousseksou, J. Phys. Chem. B., 2005, 109, 14859; b) C. Enachescu, U. Oetliker, A. Hauser, J. Phys. Chem. B., 2002, 106, 9540; c) R. Jakobi, H. Spiering, L. Wiehl, E. Gmelin, P. Gütlich, Inorg. Chem., 1988, 27, 1823; d) C. Enachescu, J. Linares, F.
100
Varret, J. Phys. Condens. Matter., 2001, 13, 2481; e) Z. Yu, T. Kuroda-Sowa, H. Kume, T. Okubo, M. Maekawa, M. Munakata, Bull. Chem.
Soc. Jpn., 2009, 82, 333; f) J.-D. Cafun, L. Londinière, E. Rivière, A.
Bleuzen, Inorg. Chim. Acta., 2008, 361, 3555.
37 a) C. Baldé, C. Desplanches, A. Wattiaux, P. Guionneau, P. Gütlich,
105
J.-F. Létard, Dalton Trans., 2008, 2702; b) C. Baldé, C. Desplanches, M. Grunert, Y. Wei, P. Gütlich, J.-F. Létard, Eur. J. Inorg. Chem., 2008, 5382; c) C. Baldé, C. Desplanches, P. Gütlich, E. Freysz, J.-F. Létard, Inorg. Chim. Acta., 2008, 361, 3529. d) C. Baldé, C.
Desplanches, F. Le Gac, P. Guionneau, J.-F. Létard,Dalton Trans.,
110
2014, 43, 7820 ; e) C. Baldé, C. Desplanches, J-F. Létard,, G. Chastanet, Polyhedron., 2017, 123, 138; f) G. Lebedev, S. Pillet, C.
Baldé, P.Guionneau, C. Desplanches, J-F. Létard, IOP Conf. Series:
Materials Scienceand Engineering., 2009, 5, 012025 ; g) M-S. Sylla, C. Baldé, N. Daro, C. Desplanches, M. Marchivie, G. Chastanet, Eur.
115
J. Inorg. Chem., 2017, 297-304; h) M-S. Sylla, C. Baldé, N. Daro, G.
Chastanet, J. Soc. Ouest-Afr. Chim., 2017, 043, 37.
38 a) M. Sorai, J. Ensling, P. Gütlich, Chem. Phys., 1976, 18, 199 ; b) P. Ganguli, P. Gütlich, E. W. Müller, Inorg. Chem., 1982, 21 3429 ; c) J-P. Martin, J. Zarembovitch, A. Bousseksou, A. Dworkin, J.G. 120
Haasnoot, F.Varret, Inorg. Chem., 1994, 33, 6325.
39 a) S. Zheng, M-A. Siegler, J-S. Costa, W-T. Fu, S. Bonnet, Eur. J.
Inorg. Chem., 2013, 1033–1042; b) R. Ohtani, S. Egawa, M. Nakaya,
H. Ohmagari,M. Nakamura, L-F. Lindoy, S. Hayami, Inorg. Chem.,
2016, 55, 3332−3337. c)P. Chakraborty, C. Enachescu, C. Walder, R.
125
Bronisz, A. Hauser, Inorg. Chem.,2012, 51, 9714; d) I. Krivokapic, P.
Chakraborty, C. Enachescu, R. Bronisz, A. Hauser, Inorg. Chem.,
2011, 50, 1856 e) P. Chakraborty, R. Bronisz, C. Besnard, L. Guenée,
P. Pattison, A. Hauser, J. Am. Chem. Soc., 2012, 134, 4049.
40 Mercury CSD 2.0 - New Features for the Visualization and 130
Investigation of Crystal Structures, C. F. Macrae, I. J. Bruno, J. A. Chisholm, P. R. Edgington, P. McCabe, E. Pidcock, L. Rodriguez-Monge, R. Taylor, J. van de Streek and P. A. Wood, J. Appl. Cryst., 41, 466-470, 2008
Cite this: DOI: 10.1039/c0xx00000x
ARTICLE TYPE
TOC Entry
Temperature dependence of (χMT)Fe for [FexMn1-x(L222N3O2)(CN)2]ꞏH2O of
5
T(TIESST) experiment with x = 1 (in violet ■), 0.949 (in blue ■), 0.93 (in
red ■), 0.912 (in green ■), 0.892 (in olive ■) and 0.853 (in black ■).
0 50 100 150 200 250 0.0 0.5 1.0 1.5 2.0 2.5 3.0 3.5 4.0 HS4 LS2 / HS3 HS2 LS1 x=0.853 x=0.892 x=0.912 x=0.93 x=0.949 x=1 T / K (M T)Fe / c m 3 K m o l -1 HS1
![Fig. 1. Magnetic properties of [Fe(L 222 N 3 O 2 )(CN) 2 ]ꞏH 2 O from previously](https://thumb-eu.123doks.com/thumbv2/123doknet/14323862.497480/3.892.76.408.237.456/fig-magnetic-properties-fe-l-cn-ꞏh-previously.webp)
![Fig. 2. Projection of the crystal packing of [Mn(L 222 N 3 O 2 )(CN) 2 ]ꞏH 2 O: a) 270 K; b) 120 K](https://thumb-eu.123doks.com/thumbv2/123doknet/14323862.497480/4.892.80.442.79.257/fig-projection-crystal-packing-mn-l-cn-ꞏh.webp)
![Fig. 5. Temperature dependence of (χ M T) Fe for [Fe x Mn 1- 1-x (L 222 N 3 O 2 )(CN) 2 ]ꞏH 2 O with x = 0.966 after fast cooling measurement: a)](https://thumb-eu.123doks.com/thumbv2/123doknet/14323862.497480/6.892.471.823.603.740/fig-temperature-dependence-fe-ꞏh-fast-cooling-measurement.webp)
![Fig. 7. Temperature dependence of (χ M T) Fe for [Fe x Mn 1- 1-x (L 222 N 3 O 2 )(CN) 2 ]ꞏH 2 O of T(TIESST) experiment with x = 1 (in violet ■), 0.949 (in blue ■), 0.93 (in red ■), 0.912 (in green ■), 0.892 (in olive ■) and 0.853 (in black ■)](https://thumb-eu.123doks.com/thumbv2/123doknet/14323862.497480/7.892.458.807.259.533/temperature-dependence-tiesst-experiment-violet-green-olive-black.webp)