French-speaking Swiss coffee consumer habits
and coffee farmers’ living conditions
Bachelor Project submitted for the degree of
Bachelor of Science HES in International Business Management
by
Fanny DUPONT-WILLEMIN
Bachelor Project Mentor:
Mark SHEPHERD, Lecturer in Marketing at HES-SO
Geneva, 02/06/2020
Haute école de gestion de Genève (HEG-GE) International Business Management
Disclaimer
This report is submitted as part of the final examination requirements of the Haute école de gestion de Genève, for the Bachelor of Science HES-SO in International Business Management. The use of any conclusions or recommendations made in or based upon this report, with no prejudice to their value, engages the responsibility neither of the author, nor the author’s mentor, nor the jury members nor the HEG or any of its employees.
Acknowledgements
I would like to express my special thanks to Mark Shepherd, mentor of this thesis and lecturer at the Haute école de gestion in Geneva, for his availability, guidance and support.
I am unconditionally grateful to Yvonne de Henseler, Céline Gendron, Charlene Chikono and Dominique Baeriswyl for their precious help and support. I also extend my gratitude to my family and relatives for all their support and encouragement.
Finally, I should also like to take this opportunity to thank all the individuals who participated in the online survey for their input, without whom the research could not have been conducted.
Executive Summary
The coffee industry and particularly coffee producers are facing difficult and challenging times. For years coffee prices have been falling and therefore producers have seen their revenue shrinking. This situation can be somewhat counterintuitive for French-speaking Swiss coffee consumers who have seen the selling price of their caffeine intake increase over time. However, the drop in coffee prices is not to be underestimated. Its consequences are catastrophic for some coffee producers who are no longer able to cover their production costs and are sometimes forced to sell beans at a loss. The goal of this research was therefore to establish whether French-speaking Swiss coffee consumers could benefit coffee farmers’ revenue distribution by adapting their consumer behavior. French-speaking Swiss coffee consumers were selected as the population to study mainly because previous research had highlighted their awareness and responsiveness to ethical issues (Stefańska & Nestorowicz, 2015), (Burrows, 2016). Primary and secondary data were collected and analyzed to gather insight into French-speaking Swiss coffee consumers’ relationship with coffee. The primary data was collected through an online survey with three main objectives:
• To assess the awareness of coffee consumers living in the French-speaking part of Switzerland with respect to the coffee price crisis and its impact;
• To evaluate the surveyed population’s view of the main fair-trade labels present in the French-speaking part of Switzerland and to determine whether consumers trust them enough to buy labeled coffee;
• To determine to what extent coffee consumers living in the French-speaking part of Switzerland are ready to change their purchasing behavior towards a more sustainable approach.
The results show that overall most of the surveyed coffee consumers living in the French-speaking part of Switzerland are attached to ethical principles and are thus more sensitive to fair-trade coffee. Along with this finding, recommendations are given to coffee companies and certification bodies to more effectively attract fair-trade driven coffee consumers. Finally, the report covers the potential changes the coffee industry and its actors may well have to face in the future as well as recommendations to companies to effectively anticipate and handle change in these uncertain times.
Contents
Disclaimer ... i
Acknowledgements ... ii
Executive Summary ... iii
Contents ... iv
List of Figures ... v
1. Introduction ... 1
1.1 Global situation ... 1
1.2 Causes of the coffee price crisis ... 2
1.3 The impact of the coronavirus pandemic on the coffee industry and its actors ... 3
1.4 Alternatives to the coffee price crisis ... 5
2. Literature review ... 8
2.1 Traditional coffee supply chain vs fair-trade coffee supply chain ... 8
2.2 Presentation of the Fairtrade Labeling Organization and Fairtrade International ... 9
3. Methodology ... 12
3.1 General information ... 12
3.2 Covid-19’s impact on the research ... 13
4. Results... 14
4.1 Information regarding the survey ... 14
4.2 Presentation of the results ... 15
5. Discussion ... 35
5.1 Key points in the introduction and literature review ... 35
5.2 Key findings of the survey analysis ... 37
5.3 Recommendations based on the survey results ... 41
5.4 Innovation in the label industry ... 42
Conclusion ... 46
Bibliography ... 48
Appendix 1: Survey questions and answers (Google Form) ... 56
List of Figures
Figure 1 - Traditional coffee supply chain vs fair-trade coffee supply chain ... 8
Figure 2 - Evolution of the fair-trade revenue in Switzerland ... 9
Figure 3 - Surveyed population divided into demographic categories ... 16
Figure 4 - Surveyed population divided into gender categories ... 17
Figure 5 - Ranking of coffee attributes ... 18
Figure 6 - Coffee consumers’ level of familiarization with coffee certifications ... 19
Figure 7 - Coffee consumers’ level of understanding of coffee certifications ... 20
Figure 8 - Coffee consumers’ level of trust towards coffee certifications ... 21
Figure 9 - Coffee consumer's willingness to buy specific certifications ... 22
Figure 10 - Coffee consumers' opinion on fair-trade coffee and higher prices ... 23
Figure 11 - Why fair-trade justifies higher prices ... 24
Figure 12 - Why fair-trade does not justify higher prices ... 25
Figure 13 - Participants' reactions to their favorite coffee brand not respecting human rights ... 27
Figure 14 - Participants' reactions to their favorite coffee brand not respecting the environment ... 27
Figure 15 - Participants' level of environment awareness ... 28
Figure 16 - Participants' reactions to their favorites coffee brand not respecting the environment (detailed) ... 29
Figure 17 - Participants' reactions to their favorite coffee brand not trying to be sustainable ... 30
Figure 18 – Participants’ awareness of the coffee price crisis ... 31
Figure 19 – Participants’ awareness of the coffee price crisis (detailed) ... 32
Figure 20 - Participants' opinion on the coffee price crisis ... 32
Figure 21 - Participants' willingness to adapt purchasing behavior to benefit coffee farmers after having become aware of the coffee price crisis ... 33
Figure 22 - Participants' willingness to adapt purchasing behavior to benefit coffee farmers after having become aware of the coffee price crisis (detailed) ... 34
1. Introduction
1.1 Global situation
Coffee has been for years an international flagship product, in 1824 Thomas Jefferson described it as “the favorite beverage of the civilized world”1, which is still accurate
nowadays as coffee ranks as one of the most popular beverages worldwide. Indeed, the number of cups consumed annually at the international level is estimated to be nearly a trillion (International Coffee Organization, 2020). However, even though coffee consumption has been steadily increasing over the years, its industry is currently facing a challenging situation which affects all its actors but most particularly the farmers and producers at the beginning of the value chain, who have seen their standards of living declining and today they face critical financial conditions (Fairtrade Foundation, 2020). This phenomenon also known as the coffee paradox arises from the discrepancy between what farmers sell for and what consumers pay for. The price paid for coffee in shops and specialty stores is significantly higher than the price received by farmers in producing countries. The price paid by coffee consumers represents the added value coffee companies bring through the marketing attached to the finished product. While the value added by coffee producers to the supply chain, namely quality, origin and intensity, are far less represented in terms of price. This is the reason why multinationals are able to generate more profit every year while farmers’ living conditions are declining (Daviron & Ponte, 2005).
2018 was a disruptive year for the coffee industry with a sharp decline in the spot price which in the second quarter of 2020 has still not recovered. The price crash, although less intense than the one in 2000, greatly hit the market and most importantly farmers who due to the critical situation are sometimes forced to sell so low that they actually lose money on the trade, but as farming is their sole source of revenue, they do not have any other choice (Trading Economics, no date). They need to sell independently of the market level which makes them highly vulnerable to price fluctuations.
Being paid too little means that farmers cannot invest in their property nor afford to treat their crops against diseases and parasites and thus lose important parts of their plantations when the latter are infested by insect pests or are simply not as productive as before due to aging (Paul Light, 2019). For some farmers the only alternative to
diminishing revenues is to grow unlawful crops or to migrate, most of the time illegally, to more promising countries (Sieff, 2019). Although such strategies might result in extra generated income, it is of course highly risky and can lead to legal action.
These elements are the direct consequences of the coffee price crisis which is characterized by the decrease of the C-price (the Coffee C futures) and a highly volatile coffee spot price. The Coffee C futures work as any futures contracts meaning that they reflect today’s prices for future physical delivery i.e. on the date indicated on the futures contract. Moreover, futures contracts are standardized (prices, quantities, qualities, origin…) which facilitates the trade. The Coffee C contract is specific for Arabica coffee and is seen as the international benchmark. The spot price, also known as cash price, reflects the current market situation and is used for instant exchanges and not for future delivery. The C-price is mainly influenced by market fluctuations including the strength of the US dollar, as coffee is traded predominantly in US dollars at the international level, as well as the balance between the supply and demand for coffee worldwide.
1.2 Causes of the coffee price crisis
Booming Brazilian production has flooded the market and Brazil has been since 2008 the major arabica coffee producing country worldwide. This unexpected production increase lead to an oversupply of coffee and consequently to reduced income for farmers (when supply surpasses demand, the price falls).
Moreover, as Brazilian coffee is traded in US dollars the relationship between the Brazilian and the US currency is of great importance. To ensure a constant revenue to coffee farmers, the exchange rate between the US dollar and the Brazilian reals needs to remain as stable as possible. However, in March 2012 the value of Brazilian reals started to plummet going from an exchange ratio of 1.8271 reals for 1 US dollar to 3.8814 reals for 1 US dollar by the end of 2018 (Hodari, 2019). This major depreciation of the Brazilian reals compared to the US dollar tremendously reduced the value of coffee producers’ earnings not only in Brazil but also at the international level as Brazil is undeniably the worldwide leader in coffee production with a local harvest accounting for more than a third of the global one (Walton, 2019).
the lowest possible price to the detriment of coffee farmers’ income (FuturesTradingChart, 2020).
Although these advanced economic drivers are beyond coffee producers’ range of activities, they are undeniably affected by them. Producers, being highly fragmented throughout the coffee supply chain, are price takers and so cannot influence the selling price of their coffee bags.
1.3 The impact of the coronavirus pandemic on the coffee
industry and its actors
As previously mentioned, the world is currently facing an oversupply of coffee which has led to a decrease in its corresponding spot price. The coronavirus pandemic is undeniably impacting the worldwide exchange of commodities including coffee beans and its industry. Indeed, after only a few weeks of economic downturn due to the closing of many companies, most commodities prices have plummeted.
The oil industry was particularly affected by the coronavirus crisis and faced negative prices whereby oil producers were forced to pay customers to take on the crude as no storage spaces were vacant (Ambrose, 2020). Such a drop in the price of oil was driven by the fact that the crude oil futures contracts of West Texas Intermediate (WTI), one of the international benchmarks in crude oil prices, came to expiry. When futures contracts come to expiry, physical delivery of the commodity, which in this case is crude oil, is required.
At the end of April 2020, one of the WTI crude oil futures contracts came to expiry which meant that companies, depending on their futures contractual position, had to physically buy or sell crude oil. However, because of the lack of storing spaces no one was willing to handle such a responsibility and therefore people tried to off-set their position by selling WTI crude oil futures, which led to the drop in prices. The situation eventually recovered after a few days and the WTI crude oil prices came back to a more usual level. The drop in the crude oil prices was “echoed” onto other commodities’ prices. Indeed, as crude oil is essential to international trade and the transportation of commodities, its price movements impact on the prices of other commodities i.e. when the oil prices are low the rest of the commodities’ prices tend to follow the trend and vice versa (Federal Reserve Bank of San Francisco, 2007).
This does not foretell positive news for the coffee industry which before the coronavirus pandemic was already facing extremely low prices. If the coffee prices follow the general
trend steered by crude oil prices, coffee farmers will see their income decrease significantly.
In addition to generating price instability, the spreading of the worldwide coronavirus forced big coffee chains such as Starbucks and restaurants to close their sites for health reasons. The direct consequence to coffee retailers such as Starbucks and other cafés having to close their doors to the public, has been a major decline in “out-home” coffee consumption, which according to experts will not be compensated by the in-bulk compulsive buying of consumers who feared the scarcity of food items and rushed into stores to stockpile essential products including coffee (International Coffee Organization, 2020).
During the lockdown as take-away coffee retailers closed their doors to the public and temporarily stopped their commercial activities they also stopped purchasing coffee beans from producers. Consequently, farmers have lost their major buyers and are left with full coffee bags with no one to sell to. The temporary economic downturn caused by the Covid-19 pandemic will thus widen the existing gap between coffee supply and demand worldwide and the direct result will be ever diminishing revenues for coffee farmers.
Moreover, specialty coffee producers who focused their activity on growing high quality beans hoping to get higher revenues, have also seen their sales drop as the establishments selling premium coffees like restaurants or hotels had to close their businesses due to Covid-19. Knowing the unstable situation coffee farmers were in before the coronavirus and the tremendous repercussions the latter has had and will continue to have, many coffee producers fear they will not recover from the pandemic (Nanji, 2020).
1.4 Alternatives to the coffee price crisis
One of the strategies to remedy revenue inequalities which are to the detriment of coffee farmers would be to ensure them a minimum earning per coffee bag sold. The use of certifications and specific business strategies can also ensure better conditions for coffee farmers. For example, a direct sourcing strategy where a company buys coffee beans or cherries directly from farmers instead of going through intermediaries develops a deeper relationship between the producers and the buying entity. Moreover, when coffee beans are directly sourced from coffee producers, i.e. not bought in bulk from a bean aggregator, they are of a better quality. Coffee companies will therefore pay more for the quality premium which in turn means that coffee producers receive more money. The use of certifications can also secure producers’ revenues by imposing a higher selling price to end-consumers. Moreover, another essential aspect which can influence farmers’ revenues is the quality and quantity of their harvested crops. Through training and social support, companies and certification bodies can share their knowledge and teach farmers effective resources management and efficient farming methods. This would enable producers to harvest more high-quality cherries and to treat the trees efficiently in order to extend and enhance their production.
For example, Starbucks developed in collaboration with Conservation International, the Coffee and Farmer Equity practices (C.A.F.E) with the aim of ensuring ethical sourcing of coffee. The program surpasses economic goals as it benefits more farmers than Starbucks currently works with and provides the industry with high-quality coffee while promoting farmers sustainable living conditions.
Nespresso, another big name in the coffee industry, also launched its program aiming at ensuring sustainability throughout the supply chain. Their program is called AAA Sustainable Quality Program and has for its main partner the Rainforest Alliance Certification, which enables Nestlé’s subsidiary to train and support farmers in their mission by notably offering training sessions, tools and information on efficient farming techniques. The program also puts emphases on eco-friendly actions enabling producers to increase their farming knowledge and know-how.
Besides the big names, many smaller companies or coffee brands are partnering with certification bodies or use direct sourcing to offer sustainable products. Over the years, consumers have surely noticed the increasing number of coffee items bearing a certification or sustainability label available on retail shelves. The theory behind the certifications and different labels is that paying higher retail prices will ensure producers
higher revenues. Therefore, paying a low price for coffee will lead to the growing impoverishment of farmers, which is not only economically unsustainable but also highly unethical.
The issue is that coffee consumers in developed countries such as Switzerland are not paying low prices. Quite the contrary: for the past few years, coffee drinkers have seen prices constantly increasing while the condition of the producers has been deteriorating (RTS, 2018). Such a contrast between consumers paying more and more for coffee (even for uncertified items) and the decreasing revenues of farmers makes it difficult for coffee lovers to fully understand the magnitude of the problem.
Even though the situation is highly paradoxical and thus difficult to understand for coffee drinkers living in Switzerland, studies have shown that consumers are ready to pay an extra price for quality coffee. This means that there could be room in the Swiss coffee market for items combining quality standards and fair sourcing characteristics (Lafargue, 2017) (Daviron & Ponte, 2005). This observation is promising as it offers not only a possibility to deepen an already existing specialty and fair-trade coffee market segment but also to improve producers’ living conditions by ensuring that a higher proportion of the coffee value is distributed to them.
Knowing that coffee consumers living in the French speaking part of Switzerland are potential clients for an offer combining elegance in term of sourcing and taste, the number of prospective customers needs to be defined. Therefore, the first objective of this paper will be to assess the awareness of coffee consumers living in the French-speaking part of Switzerland regarding the coffee price crisis and its impact. This will be the starting point towards the identification of fairly sourced and quality coffee potential enthusiasts.
Why is the target population composed only of coffee drinkers living in the French-speaking part of Switzerland? Because even though the main trading exchanges for coffee are located in New York (ICE) and London (LIFFE), the majority of worldwide coffee deals are actually made in Switzerland and more precisely in the French speaking part of Switzerland (El-Shikh, 2015). The proximity of the trading transactions in addition to the coffee appetite of people living in the French-speaking part of Switzerland, make
The second objective of the research will be to evaluate the surveyed population’s view on the main certifications present in the French-speaking part of Switzerland and on the direct sourcing strategies principle companies may have developed. Such assessment will illustrate people’s insight into the current offering on the market and the potential adaptations coffee companies and certifications houses could undertake to attract a larger panel of consumers. This analysis will be focused on the opinion people have of the current offers for sustainable coffee and thus the results can identify elements consumers perceive as sustainable and what they need in order to trust and so buy a certain certification or brand.
The final objective of the research will be to determine consumers openness to adapt their purchasing behavior towards a more sustainable approach and thus to identify drivers and drags on changing coffee consumers buying and drinking habits.
2. Literature review
2.1 Traditional coffee supply chain vs fair-trade coffee supply
chain
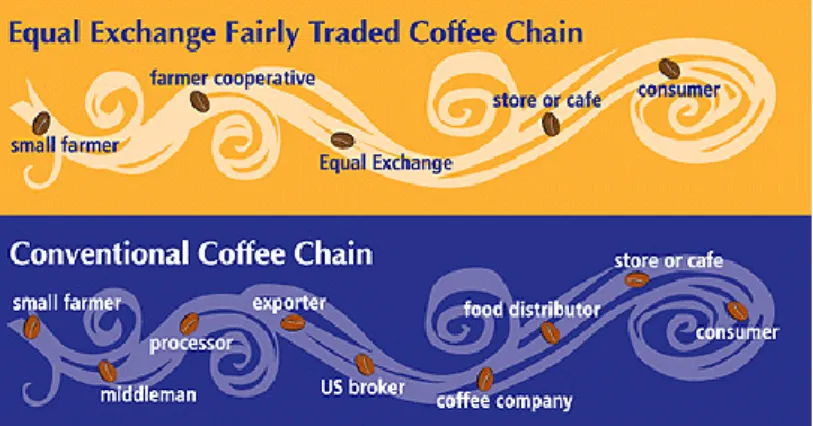
The major difference between a conventional coffee supply chain and the one used for fair-trade certified coffee is the number of middlemen between the producers at the beginning and the final consumers at the end of the supply chain. Fair-trade coffee supply chains are organized in a way to ensure that most of the extra price paid by consumers goes into fair-trade farmers’ pockets. For such transactions to work, small producers are organized as cooperatives, which then sell the coffee beans or cherries as a whole entity to trading companies. Thus, the supply chain of certified coffee should theoretically be organized as shown in the orange section of the following diagram.
Figure 1 - Traditional coffee supply chain vs fair-trade coffee supply chain
Source: The Ohio State University (2015)
The supply chain for uncertified coffee, represented in the blue part of the above scheme, involves many more participants and each of them takes a margin which is then reflected by high coffee prices in developed countries while the farmers are struggling to make ends meet. Such an analogy can be applied to any agricultural commodity and is why the Fairtrade Labeling Organization also known as Fairtrade International was established in 1992. The aim of Fairtrade International is to promote fair trading conditions along with safe and sustainable working conditions for farmers around the globe (Fairtrade International, 2020).
2.2 Presentation of the Fairtrade Labeling Organization and
Fairtrade International
2.2.1 How does it work in Switzerland?
Fairtrade International is active worldwide in producing countries where the organization collaborates with farmers’ cooperatives and in consuming countries through its national subsidiaries. To pursue its mission, Fairtrade International decided to follow a strategy whereby each country establishes its national subsidiary, for instance Max Havelaar in Switzerland.
2.2.2 Evolution of fair-trade labels in Switzerland
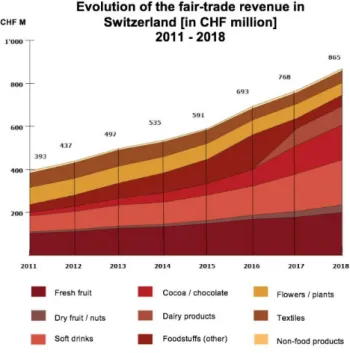
The Swiss market has over time welcomed various food labels fighting for different causes including fair food trading, which is the research focus of this thesis. Over the years, Swiss consumers seem to have espoused this cause and increased their consumption of fair-trade certified items. The study conducted by the Swiss Fair Trade association reflects an increase of 220% in sales revenues of fair-trade labeled items between 2011 and 2018 (Swiss Fair Trade, 2019). The following graph highlights a consumption increase of fair-trade products in various areas notably in the soft drinks section, here represented in light pink, which includes coffee.
Figure 2 - Evolution of the fair-trade revenue in Switzerland
The popularity of fair-trade products seems to be spreading around the world and can be reflected through the increase in sales revenue of Fairtrade International over the years. With a revenue growth of 197% between 2011 and 2018 Fairtrade International appears to pursue a significant expansion at the international level (Statista, 2020). Moreover, GlobeScan, a market research firm, conducted a survey on the matter interviewing consumers across 24 different countries and was able to assess that most of the people surveyed recognize and have trust in the Fairtrade International label (GlobeScan, 2011).
2.2.3 Critical appraisal of the fair-trade system
Although the fair-trade philosophy figures appear to be successful, a certain number of actors have started to doubt its efficiency. Some believe fair-trade certifications are not doing enough. Peter Giuliano, who held a position of authority in the Specialty Coffee Association of America for more than 11 years, was initially pro fair-trade labels, but decided to change his purchasing patterns from certified green coffee to uncertified beans. In an interview Mr. Giuliano says he believes in the concept of fair-trade but describes the FLO model as: “I think the Fair Trade-certified FLO model is not relevant
at all and kind of never has been, because they were doing something different than they
were selling to the consumer. … That’s exactly why I left TransFair [now FairTrade
USA]”2.
According to the Stanford Social Innovation Review more and more coffee professionals including roasters, importers and growers, consider that fair-trade labelled coffee “is not
living up to its chief promise to reduce poverty”3. The principal reasoning behind their
doubt is the lack of information and data supporting Fairtrade Labeling Organization (FLO)’s impact on farmers.
Moreover, selling fair-trade certified coffee represents a cost for companies, as they have to pay the license fees to be authorized to use the label. For that reason, some companies prefer to implement inside mechanisms to ensure the sustainability aspect of their products. Such a strategy is used by major coffee companies worldwide. As previously stated, Nespresso and Starbucks, two of the major coffee players worldwide, respectively launched their in-house programs to ensure sustainability throughout their
However, the implementation of these programs seems quite challenging. Some argue that even though the product itself or its supply chain is claimed to be sustainable, there is no proof that all the actors involved respect the criteria set by the labels or the companies’ programs (Stefańska & Nestorowicz, 2015). Many investigations have brought to light that companies are not sticking to their promises and are breaking the rules for the sole purpose of generating more revenue. The Nike scandal was probably one of the most mediatized scandals and lead to the discovery of many other cases of companies using child labor as a way to leverage profit (Boggan, 2001).
More recently, channel 4, a British TV Channel, released a documentary on the working conditions of coffee farmers working for Nespresso and Starbucks. Through the investigation numerous violations of the companies’ own codes of conduct were showcased such as children performing physically demanding tasks and working excessive hours (Channel 4, 2020). Discoveries like these highly impact on the credibility of companies but also highlight the lack of control along the coffee supply chain and thus nurture in people disquieting thoughts about the potential inefficiency of fair-trade strategies.
2.2.4 Mixed opinion towards fair-trade
Through the study of current papers and thoughts on fair-trade issues, it appears that there is no common opinion on the topic but mixed feelings. Some believe that the key to reduce inequalities in the coffee industry is to raise consumers’ awareness and to charge them higher fees which will then be redistributed to famers’ cooperatives (Fairtrade International, 2020). Such belief is not only shared by fair-trade certifications’ bodies, but also by The World Bank, who qualified the “shift in the distribution of incomes” (which is what fair-trade labels are aiming to achieve) as one of the strategies to reduce poverty (World Bank Group, 2016). While others argue that it is deluding to believe in a system that is not impacted by market forces (for instance the one elaborated by fair-trade organizations). The 2008 financial crisis is the perfect example of disastrous consequences that can arise when actions are not subject to market control and thus potentially working against economic forces (Stefańska & Nestorowicz, 2015).
Although there are dissenting opinions regarding fair-trade, all seem to agree on the gravity and the need for action regarding the coffee price crisis (Prasard, 2019). In this thesis the focus will be on French-speaking Swiss coffee consumers and the goal will be to determine what they could do (whatever their age, gender or social group) to be part of the solution and promote better working and living conditions for coffee producers.
3. Methodology
3.1 General information
The primary goal of the data collection is to gather pertinent information which will be the means and tools to achieve the previously determined objectives. As a reminder, the three objectives of this thesis are as follows:
• First objective: assess the awareness of coffee consumers living in the French-speaking part of Switzerland regarding the coffee price crisis and its impact; • Second objective: evaluate consumers’ view of the main fair-trade labels present
in the market in order to assess the extent to which coffee consumers trust them and so are willing to buy certified coffee;
• Third objective: determine to what degree coffee consumers are willing to change their purchasing behaviour towards a more sustainable approach.
The choice of research methodology is of great importance as it directly impacts the quality of the results. To better fulfil the abovementioned three objectives, the collection of coffee consumers’ insights into their consumption habits was required. To obtain valuable data from a diversified group of people, an online survey was conducted. The latter was held on the Google platform provided for that purpose.
The survey’s concept started with various research on coffee trends adopted by consumers living in the French-speaking part of Switzerland. Such a step enabled the elaboration of multiple-choice questions aiming at getting comparable results. Having analogous data enables a deeper analysis of the results and helps identify specific buying and consuming patterns. Moreover, for the sake of neutrality and objectivity the panel of potential answers presented in the online survey was extensive and non-subjective so as not to influence nor bias the participants and thus obtain the respondents’ true opinions.
In parallel to these multiple-choice questions, some open-ended questions were included in the survey. The latter’s goal was to obtain more detailed and tailored answers from the respondents. As the data collected from these questions was more detailed and
Before the launch of the survey, a meeting with the thesis mentor was held to share ideas and elect the best strategy to follow in order to get pertinent and valuable results. For example, the order in which the questions would appear as well as some design details were addressed along with some technicalities.
Once enough information regarding the French-speaking Swiss coffee market was collected, the questions were drafted in French and in English, to broaden the range of participants and obtain a larger panel of results. A round of testing of the survey was organized. To do so, the latter was filled-in by a test group which helped to highlight some issues and technical mismatches which needed to be fixed. Once the survey was tested and the required changes were made, the survey was launched and shared via personal connections and the professional social media platform: LinkedIn.
3.2 Covid-19’s impact on the research
The survey was put online before the coronavirus pandemic in Switzerland and was closed shortly after the start of the semi-confinement decreed by the Swiss authorities. The decision to do so was mainly driven by the fact that the extraordinary situation of Covid-19 could alter some of the answers in the survey, which would not be in the interest of this research.
It is important to acknowledge that while 94% of the results were collected before the start of the semi-confinement in Switzerland, 6% of the data was gathered during the first week following the official movement restriction order from the government. These 6% did not contain any anomalies and therefore were analyzed and presented with the rest of the pre-coronavirus data.
Moreover, one must note that although the coronavirus pandemic could well impact the coffee industry and its actors, since the results were collected before any economic disruptions occurred, the data presented hereafter is neutral of any effect of Covid-19.
4. Results
4.1 Information regarding the survey
As previously mentioned, the results that will be presented have been collected through an online survey. Although, Google Form, which is the platform chosen to conduct the survey, provides graphs and statistical analysis, the Excel spreadsheet containing the results of the survey was downloaded for further study. The latter was of great use to dig deeper and conduct further analysis of the data collected through the questionnaire. The survey was divided into three main sections. The first part of the survey aimed at sorting respondents. If the latter were not living in the French-speaking part of Switzerland or were not coffee drinkers/buyers themselves, they were redirected to the end of the questionnaire. The middle section was the core of the survey and aimed at getting the following insights from coffee consumers on:
• Their preferences in coffee attributes including: o Taste: flavor, aroma, acidity and body o Origin
o Price
o Harvesting conditions o Consumer reviews
• Their views on the various certifications and labels present in the French-speaking part of Switzerland;
• Their reaction to potential unethical behavior of coffee companies; • Their awareness and understanding of the coffee price crisis.
Finally, the goal of the last section of the survey was to collect regular information concerning the respondents such as the age range to which they belong and their gender identity.
4.2 Presentation of the results
To facilitate the readers’ understanding of the results, the data collected through the survey is presented as graphs and illustrations along with commentaries on how to read and understand the information. As the purpose of this section is to present the results on a factual basis, no correlative study will be presented although some links between the questionnaire’s results may be highlighted. Moreover, for the sake of clarity, the results presented will be divided into four different sections.
4.2.1 Getting to know the surveyed population
Firstly, the surveyed population itself is presented in more detail. Out of the 134 respondents, 83 met the criteria to complete the entire survey i.e. they were living in the French-speaking part of Switzerland and were coffee drinkers or buyers. The responses from these 83 people are therefore the area of interest and focus for the following part of the report. The 51 participants who were not coffee consumers and/or not living in the French-speaking part of Switzerland were redirected to the end of the questionnaire and thus have not provided any information used or analyzed in this study.
Although the place of residence of the survey participants as well as insights into what hot beverages they drink was assessed in the introductory part of the survey, more information was needed to get properly familiarized with the respondents before taking this study further. The following graphs display the demographic composition of the respondents and set out their age and gender. The graph below also illustrates that the single largest group of surveyed participants belong to the 16-24 age range category. Moreover, one must note that the sample size of the participants in the higher age groups is very low therefore the conclusions and recommendations presented in the following parts of the document are directional only.
Figure 3 - Surveyed population divided into demographic categories
Source: Adapted from the survey results (2020)
The sample size is of 83 respondents.
The pie chart below showcasing the percentage of respondents allocated to each gender category demonstrates a fair distribution of male and female participants. Only two individuals from the 83 surveyed were not willing to share their gender identity and thus were assigned to the “rather not say” gender category. These two participants have been included in the age range sections but no longer included in the gender categories. The decision to do so is driven by the fact that no trend can be identified from two set of answers and therefore showcasing the responses of these two “rather not say” gender respondents as a sole gender category will not provide pertinent results nor make sense from the standpoint of this research. However, the input from these two “rather not say” gender participants is taken into consideration in the age range categories and is included in the rest of the results.
83 33 23 6 13 6 2 45 18 13 4 6 3 1 36 13 10 2 7 3 1 2 2 0 0 0 0 0 W H O L E P O P U L A T I O N 1 6 - 2 4 2 5 - 3 4 3 5 - 4 4 4 5 - 5 4 5 5 - 6 4 6 5 +
Number of survey respondents belonging
to each demographic category
Figure 4 - Surveyed population divided into gender categories
Source: Adapted from the survey results (2020)
The sample size is of 83 respondents.
Having assessed some demographic characteristics of the surveyed population, their coffee preferences is presented below. The first survey question is aimed at assessing the level of importance coffee consumers place on various coffee attributes which were defined after research on coffee characteristics. The following graph presents the results obtained and illustrates the level of importance surveyed respondents assign to the main coffee features. The quantitative legend (describing the five levels of importance) and the height of the graphic bars represent the level of importance of each coffee attribute, where the higher the number/bar size, the higher the preference.
Male 54%
Female 43%
Rather not say 3%
Figure 5 - Ranking of coffee attributes
Source: Adapted from the survey results (2020)
The sample size is of 83 respondents.
The above graph reflects that every participant regardless of their gender or age perceives taste as the most important coffee attribute. Indeed, no other coffee characteristic is ranked unanimously at the same level. The rating of other coffee characteristics depends on the demographic class. For example, it appears that the closer people get to retirement age the less important coffee price is for them while the retired generation considers price as important.
Moreover, consumer reviews seem to be for all surveyed participants of relatively low importance. This can potentially be explained by the fact that taste and flavor are specific to everyone and thus can be difficult to recommend. The graph also highlights that older respondents tend to consider the origin of coffee more than their younger peers. The graph shows that male and female rating responses are the same and that variations only occur between the age range categories. Finally, it can be seen that harvesting conditions remain at quite a low ranking on the importance scale of each participant.
5 5 5 5 5 5 5 5 5 4 4 4 4 4 4 2 1 4 3 3 3 3 2 2 4 4 3 2 2 2 2 3 3 1 3 2 1 1 1 1 1 1 3 2 1 W H O L E P O P U L A T I O N M A L E F E M A L E 1 6 - 2 4 2 5 - 3 4 3 5 - 4 4 4 5 - 5 4 5 5 - 6 4 6 5 +
Coffee attributes ranked by order of
importance based on the demographic
characteristics of the surveyed population
5 - V e r y i m p o r t a n t / 4 - I m p o r t a n t / 3 - N e u t r a l / 2 - N o t i m p o r t a n t / 1 - N o t i m p o r t a n t a t a l l
4.2.2
Assess the respondents’ point of view and level of trust regarding
the various coffee labels and certifications present in the
French-speaking part of Switzerland
The second step of the survey was to assess the perception of French-speaking Swiss coffee consumers of the various certifications present in the French-speaking part of the coffee market in Switzerland. From the data collected the following results can be seen.
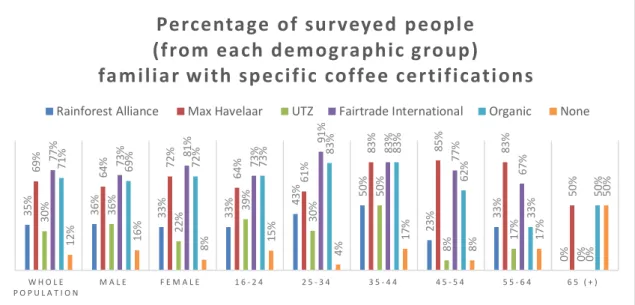
Figure 6 - Coffee consumers’ level of familiarization with coffee
certifications
Source: Adapted from the survey results (2020)
The sample size is of 83 respondents.
This graph aims at displaying the range of certifications survey participants are familiar with. Here three elements particularly stand out. Firstly, participants in every class are familiar with labels. Secondly, amongst the different fair-trade labels Fairtrade International and its national equivalent, Max Havelaar, appear to be the most recognized by the public. Finally, the younger generations seem more familiar with the various coffee certifications present in the French-speaking Swiss coffee market. The younger generations’ acquaintance with the less famous or less advertised fair-trade labels such as UTZ and Rainforest alliance compared to the older age range is also demonstrated on the above graph.
To get more data on people’s knowledge of the various coffee labels, the survey respondents were asked to provide in their own words a definition of their understanding of the purpose of the certifications they claimed to be familiar with. In order to get a more detailed understanding of the labels the question was open-ended. As this data was
35% 36% 33% 33% 43% 50% 23% 33% 0% 69% 64% 72% 64% 61% 83% 85% 83% 50% 30% 36% 22% 39% 30% 50% 8% 17% 0% 77% 73% 81% 73% 91% 83% 77% 67% 0% 71% 69% 72% 73% 83% 83% 62% 33% 50% 12% 16% 8% 15% 4% 17% 8% 17% 50% W H O L E P O P U L A T I O N M A L E F E M A L E 1 6 - 2 4 2 5 - 3 4 3 5 - 4 4 4 5 - 5 4 5 5 - 6 4 6 5 ( + )
Percentage of surveyed people
(from each demographic group)
familiar with specific coffee certifications
more specific and diverse, a classification methodology had to be chosen to sort out the answers.
Three categories were created in which the results, depending on their level of detail and pertinence, have been allocated. When the definition provided contained specific details about the certification’s purpose it was rated as “clear”. If the definition was approximately correct but did not included precise elements, it was classified as “somewhat clear” and when the explanation included wrong elements or clear signs of miscomprehension, it was categorized as “unclear”. The three categories were created in order to assess the level of understanding people have of the various coffee certifications present in the French-speaking part of Switzerland.
The results demonstrate that the level of understanding of the certifications varies mostly according to the age range while the male and female level of understanding is quite similar. The 25-35 year old group has the highest level of clear understanding, whereas the older generations seem to have a more ambiguous comprehension of the certifications and their purpose.
Figure 7 - Coffee consumers’ level of understanding of coffee
certifications
Source: Adapted from the survey results (2020)
The sample size is of 83 respondents.
31% 29% 36% 33% 48% 33% 8% 17% 0% 33% 36% 31% 30% 26% 17% 46% 50% 50% 36% 36% 33% 36% 26% 50% 46% 33% 50% W H O L E P O P U L A T I O N M A L E F E M A L E 1 6 - 2 4 2 5 - 3 4 3 5 - 4 4 4 5 - 5 4 5 5 - 6 4 6 5 +
Surveyed population's level of understanding
of the certifications they are familiar with
Beside understanding certifications, another element to consider is the extent to which buyers trust them, as a high level of trust is an essential element in the purchase equation. If the sales company or the sales’ representatives are not able to establish a trustworthy relationship with the clients, the purchase is unlikely to occur or if so in significantly lower quantity than if trust was built (McLellan Marketing Group, 2012). The graph below illustrates the level of trust people have towards certifications and showcases most of the surveyed population is on the left side of the spectrum meaning that half of the respondents rely on certifications’ bodies and their actions. Moreover, the graph also demonstrates that close to zero respondent have neither very high nor very low feelings of trust towards certifications.
Moreover, a significant portion of the survey population has a neutral feeling of trust towards coffee certifications. Since these consumers do not particularly trust the certifications, they may be less likely to purchase labeled coffee products. This highlights an area that certifications bodies could improve on in order to increase their market share.
Figure 8 - Coffee consumers’ level of trust towards coffee certifications
Source: Adapted from the survey results (2020)
The sample size is of 83 respondents.
To get further insight into French-speaking Swiss coffee consumers’ point of view of the various certifications present in the market and to assess the importance they attach to the various labels, coffee consumers were asked which certifications they want to see on their coffee packets.
0% 17% 34% 29% 14% 5% 1% V E R Y H I G H H I G H S O M E W H A T H I G H N E U T R A L S O M E W H A T L O W L O W V E R Y L O W
Level of trust of the surveyed population
The following graph showcasing the results, suggests that consumers seem to be predominantly attracted by the Fairtrade International certification and its national equivalent Max Havelaar. Moreover, the organic label ranks in second position which is consistent with the results collected so far that demonstrate a significantly high level of awareness of the surveyed population regarding organic certification.
Figure 9 - Coffee consumer's willingness to buy specific certifications
Source: Adapted from the survey results (2020)
The sample size is of 83 respondents.
One of the characteristics of labeled coffee is a higher selling price which in the case of a fair-trade strategy is the means to ensure higher revenues to coffee producers, as the premium paid by coffee consumers is redistributed to producers’ cooperatives to help them pursue and invest in their farming activity. The readiness of coffee consumers to pay more for their caffeine intake is therefore assessed below. The results of which are essential in order to determine whether French-speaking Swiss coffee consumers are willing to help improve the living conditions of coffee producers through buying fair-trade coffee. 41% 40% 44% 45% 48% 33% 23% 50% 0% 72% 62% 81% 67% 83% 67% 69% 83% 50% 33% 36% 28% 36% 48% 33% 8% 0% 50% 48% 49% 44% 42% 52% 67% 54% 33% 50% 13% 18% 8% 15% 9% 17% 15% 17% 0% W H O L E P O P U L A T I O N M A L E F E M A L E 1 6 - 2 4 2 5 - 3 4 3 5 - 4 4 4 5 - 5 4 5 5 - 6 4 6 5 +
Percentage of people (from each demographic
group) willing to see specific certifications on
their coffee
Figure 10 - Coffee consumers' opinion on fair-trade coffee and higher
prices
Source: Adapted from the survey results (2020)
The sample size is of 83 respondents.
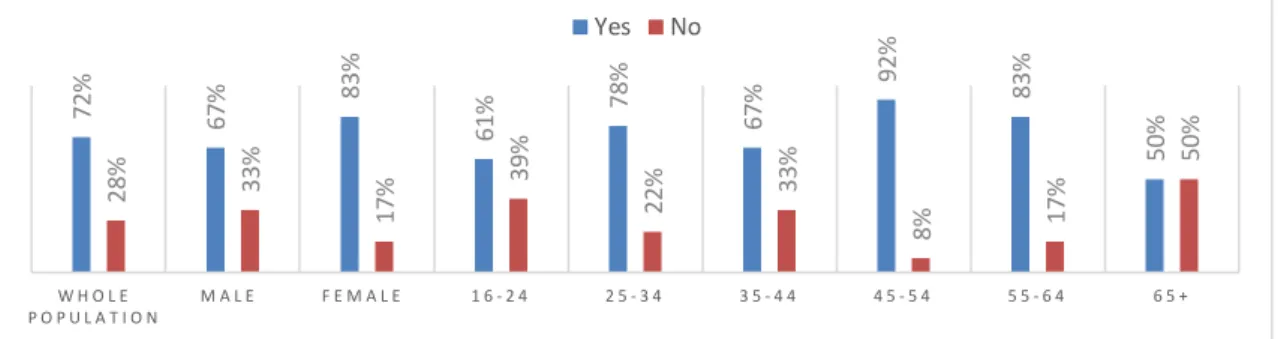
The above graph highlights that most of the surveyed population believes it is justified to pay higher prices for fair-trade certified coffee. In order to get deeper insight, participants were further asked to develop their answers and state why they believe paying higher prices for fair-trade coffee is justified or not.
72% 67% 83% 61% 78% 67% 92% 83% 50% 28% 33% 17% 39% 22% 33% 8% 17% 50% W H O L E P O P U L A T I O N M A L E F E M A L E 1 6 - 2 4 2 5 - 3 4 3 5 - 4 4 4 5 - 5 4 5 5 - 6 4 6 5 + S u r v e y e d p e o p l e ' s o p i n i o n o n w h e t h e r p a y i n g h i g h e r p r i c e s f o r f a i r - t r a d e c e r t i f i e d c o f f e e i s j u s t i f i e d Yes No
Figure 11 - Why fair-trade justifies higher prices
Source: Adapted from the survey results (2020)
The sample size is of 60 people.
Sixty people in the graph above explained why they were willing to pay higher coffee prices for coffee with a fair-trade certification. Half of the respondents believe that paying extra money for fair-trade labeled coffee is justified because it helps farmers, which is actually the purpose of such certifications, and highlights effective communication and marketing campaigns by the certification bodies. Moreover, the results show that one third of the participants feel that it is part of consumers’ responsibility to purchase sustainability which is a promising observation for the certification bodies who wish to increase their market share.
Finally, the fact that most of the surveyed participants consider that paying more for fair-trade labeled coffee is justified because it helps producers or because they feel it is part of consumers’ responsibility to adopt a sustainable purchase pattern supports the findings of the ethical purchasing behavior study conducted by the University of Zürich and the Institute for Social-Ecological Research in Frankfurt, whose results established that Swiss consumers possess a “strong ethical push”4 which makes them more
responsive to ethical products including fair-trade labeled items (Burrows, 2016).
5% 11%
32%
2% 50%
Reasons for paying a higher price for fair-trade certified
coffee according to the part of the surveyed populaiton
who believe it is justified to do so
Because it is an easy way to have a positive impact
Because it is an efficient way to have a positive impact
Because it is part of consumers' responsibilities to purchase sustainable products
The following graph displays the information collected from respondents who believe that a coffee bearing a fair-trade certification does not justify a higher selling price.
Figure 12 - Why fair-trade does not justify higher prices
Source: Adapted from the survey results (2020)
The sample size is of 23 people meaning that out of a surveyed population of 83 respondents, more than 27% share the belief that fair-trade certified coffee does not justify higher selling prices. More than half of these respondents believe fair-trade certified coffee does not justify higher selling prices because they believe the extra money paid will go into the companies’ “pockets” and not to the farmers.
27% of the surveyed population has a relatively low level of trust towards certification bodies and their cash management strategies, which is quite consistent with the data previously presented displaying the surveyed population’s level of trust regarding certifications and labels present in the French-speaking part of Switzerland.
Moreover, the graph illustrates that one third of the respondents, who believe a fair-trade certified coffee does not justify a higher selling price, are not willing to pay higher prices for coffee and thus will not purchase coffee products bearing certifications or labels aiming at improving producers’ living conditions. Respondents simply not willing not pay more for ethical coffee might never adhere to the fair-trade system (involving labels or companies’ in-house programs). However, participants who are not buying fair-trade coffee due to lack of trust could potentially shift to ethical purchasing behavior if the trustworthiness of coffee companies (label organizations and others) could be quantified.
52% 9%
9% 30%
Reason for not paying a higher price for fair-trade
certified coffee according to the surveyed populaiton
who believe fair-trade certified does not justify higher
prices
The money will only go to companies and not farmers My favorite brand does not do fair-trade
Lack of interest regarding fair-trade products
Not willing to pay higher priced coffee
4.2.3 Survey participants’ relationship with coffee and manufacturing
brands
From the first survey results, the importance of coffee taste was highlighted, showing that coffee consumers are highly attached to their caffeine routine and its flavor. To obtain more data on the relationship consumers have with coffee, some challenging questions were asked to the surveyed population to assess their adaptability and flexibility regarding coffee purchasing and consumer behavior. The goal of these questions was to determine consumers’ reactions to potential ethical misbehaviors of coffee companies and consequently to identify the sensitivity level of coffee consumers living in the French-speaking part of Switzerland to various ethical matters.
Respondents were asked if they would continue to purchase their favorite coffee brand if the latter was not respecting human rights. The results obtain from that question are displayed on the graph below which demonstrates a high sensitivity level towards human rights as most of the surveyed population would stop buying their favorite coffee brand if the latter was involved in human rights scandals. Such a result goes along with the data collected from previous questions showing that the Fairtrade International certification and its Swiss equivalent, Max Havelaar, were the most sought-after certifications. In the sense that when the surveyed population was asked to indicate which certifications, they were willing to see on their coffee packages, Fairtrade International and Max Havelaar were the labels survey participants selected the most. Although, these two certifications are not specifically focused on respect for human rights, they are implied in the mission pursued by Fairtrade International and its Swiss subsidiary which aims to “connect
disadvantaged producers and consumers, promote fairer trading conditions and empower producers to combat poverty, strengthen their position and take more control
over their lives”.5
Moreover, these results highlight that although some participants do not trust certifications, most of them are sufficiently sensitive to ethical matters to stop purchasing from coffee companies whose processes do not respect human rights, which means that the French-speaking Swiss fair-trade coffee market could be further exploited. In other words, since there is potential demand for ethical coffee in the French-speaking part of Switzerland, if a coffee company aiming to expand its offer for ethical coffee manages to
Figure 13 - Participants' reactions to their favorite coffee brand not
respecting human rights
Source: Adapted from the survey results (2020)
The sample size is of 83 respondents.
After this the respondents were asked if they would continue to buy their favorite coffee brand if the latter did not respect the environment i.e. entering into activities that directly damage the environment or do not take climate change issues into consideration. The survey participants seemed somewhat less concerned by environmental matters than the non-respect for human rights. Indeed, the following graph showcases that in the case of environmental unfriendly behavior by coffee companies, almost one third of the respondents would not change their purchasing behavior and would continue to buy their favorite coffee brand.
Figure 14 - Participants' reactions to their favorite coffee brand not
respecting the environment
Source: Adapted from the survey results (2020)
Yes 18%
No 82%
Surveyed people's opinion on whether they would
continue to buy their favorite coffee brand if the latter
was not resecting human rights
Yes 28%
No 72%
Surveyed people's opinion on whether they would
continue to buy their favorite coffee brand if the latter
The respondent’s environmental sensitivity towards coffee production can be compared to their general level of environmental awareness. The survey participants were asked to assess their environmental awareness by rating their feelings regarding the following sentence: “I am environmentally aware” on a five points scale from strongly disagree to strongly agree. The graph presented below illustrates the level of environmental awareness of the survey participants.
Figure 15 - Participants' level of environment awareness
Source: Adapted from the survey results (2020)
The sample size is of 83 respondents.
From the above graph one can note that 40% of the surveyed population does not have any particular opinion regarding environmental matters. This result is quite surprisingly when taking into consideration the increase in climate change campaigns that were held in the course of 2019, during which thousands of children and students refused to go to school and chose to demonstrate in the streets around the world to protest against the lack of action taken by governments and/or multinational companies, and demanding significant measures and actions to be put in place to tackle global warming. These demonstrations created so much attention and awareness regarding environmental matters that in 2019 various nations and governments declared the climate state of emergency. Very high 6% High 40% Neutral 41% Low 12% Very low 1%
Level of environmental awareness of the surveyed
populaiton
Therefore, one could have expected a different ranking or expect younger participants to be more sensitive to coffee companies whose actions have harmful repercussions on the environment. However, when taking a closer look at the participants’ answers, one can note that the youngest generation seems quite unmoved by the environment, as more than one third of them would continue to buy their favorite coffee brand even if it was not respectful of the environment. While older generations, except for retired people, seem to be more receptive to companies’ involvement in global warming.
Figure 16 - Participants' reactions to their favorites coffee brand not
respecting the environment (detailed)
Source: Adapted from the survey results (2020)
The sample size is of 83 respondents.
The last question aiming to assess the sensitivity of coffee consumers in the French-speaking part of Switzerland was focused on consumers’ reactions to companies not making sufficient effort to pursue sustainable behavior.
For an action to be qualified as sustainable, it is based on three pillars: economic, environmental and social (Grant, 2020). Consequently, when companies are described as sustainable it means that they not only pursue economic objectives but also to have a positive impact on the communities around them as well as the environment.
28% 72% 29% 71% 28% 72% 36% 64% 30% 70% 17% 83% 8% 92% 0% 100% 100% 0%
W H O L E P O P U L A T I O N
M A L E F E M A L E 1 6 - 2 4 2 5 - 3 4 3 5 - 4 4 4 5 - 5 4 5 5 - 6 4 6 5 +
Surveyed people's opinion on whether they
would continue to buy their favorite coffee
brand if the latter was not respecting the
environment (detailed)
Yes NoFigure 17 - Participants' reactions to their favorite coffee brand not trying
to be sustainable
Source: Adapted from the survey results (2020)
The sample size is of 83 respondents.
Here the data demonstrates that non-compliance with sustainability standards is the least important criteria for the surveyed population as this question had the most favorable answers for continuing to purchase the same coffee brand. Therefore, from the above results, the following ranking of importance can be drawn:
• Respect for human rights
• Environmentally friendly behavior
• Doing business with a sustainable mind-set
The fact that the sustainability factor ranked at the bottom of the scale is somewhat surprising as it englobes social, economic and environmental factors and consequently regroups human welfare and environmentally friendly behavior.
Yes 33%
No 67%
Surveyed people's opinion on whether they would
continue to buy their favorite coffee brand if the latter
4.2.4
Survey participants’ awareness of the coffee price crisis
The final objective of the research was to assess the awareness of coffee consumers living in the French-speaking part of Switzerland regarding the coffee price crisis and its impact. Out of the 83 people surveyed only 10 of them were familiar with the topic. Their understanding of the situation was assessed through the analysis of the definition they gave of the coffee price crisis. Each of them was able to provide a clear and concrete definition of the coffee price crisis, while the others 73 respondents had never heard about it, which can be illustrated as follows:
Figure 18 – Participants’ awareness of the coffee price crisis
Source: Adapted from the survey results (2020)
The sample size is of 83 respondents.
As previously mentioned, coffee consumers living in the French-speaking part of Switzerland have seen the price of coffee increase over the years and therefore they might well believe that while they are paying more for the coffee they consume, coffee producers are receiving more money as well, which is actually not the case.
Such a contrast between the price paid in Switzerland for coffee and the proceeds of coffee sales received by farmers in producing countries can be one of the factors why the large proportion of coffee consumers in the French-speaking part of Switzerland are not aware of the coffee price crisis. Moreover, a lack of awareness about the coffee price crisis does not seem to be a factor of age, as the proportion of people being unfamiliar with it is uniformly spread over the different age range categories.
Aware 12%
Not aware 88%
Figure 19 – Participants’ awareness of the coffee price crisis (detailed)
Source: Adapted from the survey results (2020)
The sample size is of 83 respondents.
To get a deeper insight into consumers’ perceptions and potential reactions regarding the situation of the coffee industry participants were asked, after being given an explanation of the crisis and its impact on producers, if they felt concerned by the coffee price crisis.
Figure 20 - Participants' opinion on the coffee price crisis
Source: Adapted from the survey results (2020)
The sample size is of 83 respondents.
The data collected from the participant’s answers which is presented above does not
12% 11% 14% 3% 17% 17% 8% 33% 50% 88% 89% 86% 97% 83% 83% 92% 67% 50% W H O L E P O P U L A T I O N M A L E F E M A L E 1 6 - 2 4 2 5 - 3 4 3 5 - 4 4 4 5 - 5 4 5 5 - 6 4 6 5 +
Surveyed people's awareness of the coffee
price crisis
Aware Not aware
43%
15% 42%
Surveyed population's mindset towards the coffee
price crise after having received further insight into
the phenomenon
Figure 21 - Participants' willingness to adapt purchasing behavior to
benefit coffee farmers after having become aware of the coffee price crisis
Source: Adapted from the survey results (2020)
The sample size is of 83 respondents.
Here even though the above graph highlights that most of the respondents positioned themselves as willing to adapt their purchasing behavior, a significant difference in answers occurred. While the general trend tends towards a willingness to adapt purchasing behavior, in one of the age range categories there is an important difference with a larger number of participants being not ready or unwilling to adapt their purchasing behavior to benefit coffee farmers.
Willing to adapt purchasing behavior 82% Not willing to adapt purchasing behavior 18%
Surveyed population's position regarding adapting their
coffee purchasing behavior to benefit coffee farmers
after having further insight into the coffee price crisis
Figure 22 - Participants' willingness to adapt purchasing behavior to
benefit coffee farmers after having become aware of the coffee price crisis
(detailed)
Source: Adapted from the survey results (2020)
The sample size is of 83 respondents.
In the above graph, the percentage of people not in favor of adjusting their purchasing behavior in the 16-24 age range stands out. Indeed, this group is the most reluctant to modify their buying habits.
The variation in the results might be explained by the fact that the 16-24 age range is composed mainly of students or people holding junior positions and thus have lower incomes. This hypothesis could explain a higher price sensitivity and consequently a higher proportion of people preferring to stick to their current purchasing habits.
On the other hand, participants belonging to the 16-24 age range also known as part of generation Z, are known for their sustainability “appetite” and willingness to interact with and purchase from sustainable companies even if it means paying higher prices (Petro, 2020). Therefore, one could have expected participants within the 16-24 years old age range to be more disposed to adapt their purchasing behavior towards a more sustainable approach. A more in-depth study into generation Z’s purchasing principles and behavior would merit further investigation.
82% 78% 90% 66% 95% 100% 92% 100% 100% 18% 23% 10% 34% 5% 0% 8% 0% 0% W H O L E P O P U L A T I O N M A L E F E M A L E 1 6 - 2 4 2 5 - 3 4 3 5 - 4 4 4 5 - 5 4 5 5 - 6 4 6 5 +