HAL Id: hal-01575636
https://hal-amu.archives-ouvertes.fr/hal-01575636
Submitted on 15 May 2018
HAL is a multi-disciplinary open access archive for the deposit and dissemination of sci-entific research documents, whether they are pub-lished or not. The documents may come from teaching and research institutions in France or abroad, or from public or private research centers.
L’archive ouverte pluridisciplinaire HAL, est destinée au dépôt et à la diffusion de documents scientifiques de niveau recherche, publiés ou non, émanant des établissements d’enseignement et de recherche français ou étrangers, des laboratoires publics ou privés.
Photodissociation Electronic Spectra of Cold Protonated
Quinoline and Isoquinoline in the Gas Phase
Géraldine Feraud, Luis Domenianni, Ernesto Marceca, Claude
Dedonder-Lardeux, Christophe Jouvet
To cite this version:
Géraldine Feraud, Luis Domenianni, Ernesto Marceca, Claude Dedonder-Lardeux, Christophe Jouvet. Photodissociation Electronic Spectra of Cold Protonated Quinoline and Isoquinoline in the Gas Phase. Journal of Physical Chemistry A, American Chemical Society, 2017, �10.1021/acs.jpca.7b01301�. �hal-01575636�
1
Photodissociation Electronic Spectra of Cold Protonated Quinoline and Isoquinoline in the Gas-Phase
Géraldine Féraud a,c; Luis Domeniannib1,b2; Ernesto Marcecab1,b2*; Claude
Dedonder-Lardeuxa; Christophe Jouveta*
a) CNRS, Aix-Marseille Université, PIIM UMR 7365, Avenue Escadrille Normandie-Niémen, 13397 Marseille
Cedex 20, France
b1) Universidad de Buenos Aires, Facultad de Ciencias Exactas y Naturales, DQIAF, Ciudad Universitaria, 1er
piso, Pab. II, C1428EGA, Buenos Aires, Argentina
b2) CONICET-UBA, Inst. Química Física de los Materiales, Medio Ambiente y Energía (INQUIMAE), Ciudad
Universitaria, 3er piso, Pab. II, C1428EGA, Buenos Aires, Argentina
c) Present address: UPMC, Pierre and Marie Curie University, Paris 6, 4 Place Jussieu, 75005 Paris, France * corresponding authors: christophe.jouvet@univ-amu.fr, marceca@qi.fcen.uba.ar
Abstract:
Photofragmentation electronic spectra of isolated single-isomeric N-protonated quinoline (quinolinium) and isoquinoline (isoquinolinium) ions have been measured at a temperature of 40 K using a mass-selective, 10 cm1 spectral resolution, photodissociation spectrometer.
Additionally, ab-initio adiabatic transition energies calculated using the RI-ADC(2) method have been employed to assist in the assignment of the spectra. Three electronic transitions having * character were clearly evidenced for both protonated ions within the UV and deep-UV spectral ranges. The corresponding spectra at room temperature were previously reported by Hansen et al.,24 together with TD-DFT calculations and a careful analysis of the possible fragmentation mechanisms. This information will be complemented in the present study by appending better resolved spectra, characteristic of cold ions, in which well-defined vibrational progressions associated to the S1S0 and S3S0 transitions exhibit clear 00
bands at h00 = 27868 and 42230 cm1, for protonated quinoline, and at h00 = 28043 and
41988 cm1, for protonated isoquinoline. Active vibrations in the spectra were assigned with the help of calculated normal modes, looking very similar to those of the structurally related protonated naphthalene. Finally, we have observed that the bandwidths associated with the deep-UV S3S0 transition denote a lifetime for the S3 excited state in the subpicosecond time
2
1. Introduction:
Polycyclic aromatic nitrogen heterocycles (PANHs) involve a group of compounds widely distributed in the Earth´s biosphere1 as a consequence of the emission caused by natural fires, incomplete combustion of fuels and discharge of industrial effluents, among other sources.2,3 The toxicity of several PANHs,4 normally exceeding that of the structurally related polycyclic aromatic hydrocarbons (PAHs), has motivated the development of analytical methods that, in many cases, must rely on the scarce photophysical information existing for these molecules.5
Additionally, many authors have hypothesized6-8 that PANHs might also exist beyond the Earth throughout the interstellar medium (ISM), as a result of the reaction between interstellar nitrogen and PAHs. The presence of PAHs in the ISM has long been postulated to account for absorption features in the diffuse interstellar bands (DIBs)9-11 and emission features in the aromatic infrared bands (AIBs).12 More recently, it was pointed out using experimental and theoretical arguments that the AIBs’ assignment is improved by considering nitrogen-containing PAHs.8,13-16 Nevertheless, very few gas phase electronic spectra are available to conclusively establish whether the visible absorption of PANH+s is part of the observed astronomical DIBs.17 In addition to the radical cations, protonated PANHs (hereafter PANHH+s) will likely be found in the ionized environments of the ISM due to the high proton affinity of the aromatic nitrogen expected for these molecules. Evidence supporting this
assumption was given by recent IR measurements15 performed on four small-size PANHH+s
that were found to reproduce closely the 6.2 m and 8.6 m AIBs. However, well resolved
electronic spectra of isolated PANHH+s are still needed18 to explore if the visible absorption of these ions is a component of the DIBs.
In this work we have measured the photodissociation electronic spectra of cold
protonated quinoline and isoquinoline, the two simplest PANHH+s comprising a pyridinium
cation fused to a six-membered carbocyclic ring. Both quinoline and isoquinoline are structurally related to naphthalene, being one CH group of the latter molecule substituted by one aromatic nitrogen atom at positions 1 and 2, respectively (Scheme 1). Protonation occurs on the nitrogen sp2 lone electron pair leading to the corresponding quinolinium (QH+) or isoquinolinium (iQH+) cations, as shown in Scheme 1. C-protonation is highly disfavored due
to the electron deficiency at the aromatic carbons caused by the inductive polarization of the electronegative heteroatom.
3
Even though the electronic spectroscopic properties of neutral quinolines19-22 and their radical cations17 have been extensively studied in the gas phase, less information is available on the corresponding isolated protonated molecules.23,24 In particular, only one spectrum at room temperature has been obtained for QH+ and iQH+ using photodissociation action spectroscopy by Hansen et al.,24 and so far well resolved vibronic spectra of cold ions are still
lacking. A careful analysis of the fragmentation mechanism has been done in the paper by Hansen et al., and we will use their calculations for further discussion. We will present new UV-vis spectroscopic data for QH+ and iQH+ in which we were able to improve the accuracy of the electronic band origins, exhibit well resolved vibrational progressions associated to the low lying excitations, and provide estimations about the lifetime of the excited states based on the observed line broadenings. All the measurements were performed using a cryogenic ion trap photodissociation spectrometer in which the ions can be cooled to temperatures of a few tens of Kelvin. Pump-probe UVUV ion-dip experiments25 were employed to explore the
contribution of possible tautomers in the spectral bands.
The photochemical processes observed for protonated quinoline and isoquinoline will be compared with former measurements on protonated naphthalene.26,27 To support the spectroscopic observations, ab-initio calculations were performed on QH+ and iQH+ ground and excited states.
2. Methods:
Electronic spectra were recorded using the same experimental set-up as in previous work.28,29 Only a brief description of the apparatus will be given here, including the ions’ preparation method and the applied spectroscopic techniques. Parent QH+ and iQH+ ions are formed in an electrospray source fed by a continuum flow of an acidulated water/methanol mixture (1:1 in volume) in which the corresponding quinoline is dissolved at a concentration
Scheme 1. Left, protonated quinoline (quinolinium ion, QH+); right,
protonated isoquinoline (isoquinolinium ion, iQH+).
1 2 1 2
4
of 0.1 mM. A mass gate controls the injection of positively charged particles into a cryogenically-cooled Paul trap, where they are stored for several tens of milliseconds. During this lapse of time the internal temperature of the ions is drastically reduced to about 40 K by collisions with cold He atoms, previously pulsed into the trap. Next, a fraction of the cold parent ions is photodissociated by a first laser pulse mildly focused in the center of the trap to a spot of 2 mm2, and all the ions (ionic fragments and the surviving parent ions) are
extracted into a linear time of flight (TOF) mass spectrometer where they are mass-analyzed. Photofragmentation electronic spectra are obtained by plotting the ion signal corresponding to each mass channel vs. the wavelength of the fragmentation laser. In auxiliary experiments, the ion extraction can be gradually delayed in order to monitor the time evolution of the amount of fragments in the trap, with the purpose of studying if different fragmentation paths are active. Laser wavelengths are selected within 10 cm1 by use of two optical parametric oscillators (EKSPLA, model-NT342B) that operate with scanning steps up to 0.02 nm, pulse energies of 0.5 mJ and a duty cycle of 10 Hz.
Additionally, a double resonance method29 can be applied to a determined ion in the trap in order to discriminate whether the observed spectral bands belong to a unique species (different transitions sharing the same ground state) or originate from different conformers (further details in the Supporting Information file).
Ab-initio calculations were performed using the TURBOMOLE package,30 following
the resolution-of-the-identity (RI) approximation to calculate the electron repulsion integrals. The ground state (S0) geometries of QH+ and iQH+ were optimized at the MP2/cc-pVDZ level
(second order Møller–Plesset perturbation theory, with the correlation-consistent polarized valence double-zeta basis set). Vertical transitions energies and oscillator strengths of the lowest excited singlet states (S1-3) were calculated using the RI-ADC(2) (second order
Algebraic Diagrammatic Construction) method,31 which was previously found to reproduce adequately the electronic excitations of other ionic systems containing aromatic nitrogen atoms,18,32,33 as well as protonated aromatic molecules having nitrogen functional groups.34
Computations were performed in C1 and Cs point-group symmetries. Under
Cs-symmetry restriction, the S1 excited states of QH+ and iQH+ are found of the A’(*) type.
Supplementary excited state optimizations starting from non-planar structures returned back to the planar geometry. Ground and excited state zero-point energies (ZPEs) have been calculated for the two protonated quinolines to correct the computed transition energy values.
5
The vibrational frequencies associated to the ground and the excited states of the QH+ and iQH+ ions have been calculated to help us assign the experimental vibronic bands. Mulliken notation was used to label the calculated normal modes.
3. Results:
3.1 Electronic spectra of QH+
In Figure 1 it is presented the difference TOF mass spectra obtained by subtraction of the ion signal corresponding to post- and pre-photodissociation of the parent ion QH+ (m/q = 130, negative peak) at fragmentation energies corresponding to h= 42230 cm1 (236.8 nm) and h= 27871 cm1 (358.8 nm). According to the observation of Hansen et al.,24 the most significant signals (positive peaks) found in the photofragmentation mass spectra for an
excitation energy between 41600-43500 cm1 (230-240 nm), at room temperature,
correspond to m/q = 77 ions (phenyl cations), formed by either loss of acetylene and hydrogen cyanide molecules or loss of C3H3N (acrylonitrile or azete), and a smaller yield of m/q = 102
ions, resulting from elimination of 28 mass units given by loss of acetylene + H2 or CN + H2.
If the fragmentation energy is decreased to wavelengths in the spectral region of 27800-29400 cm1 (340-360 nm), and hence the dissociation process evolves in a different excited state, a drastic change in the branching ratio is observed in the mass spectrum, again in agreement with reference 24. Under such conditions the most abundant fragment observed is the m/q = 103 ion, generated from loss of a hydrogen cyanide molecule, together with two additional minor fragments: m/q = 128 (loss of H2 or two hydrogen atoms) and m/q = 77 (phenyl ions).
A similar change in the fragmentation pattern is found when QH+ is studied by collision
induced dissociation (CID) mass spectrometry on going from collision energies of about 50 eV (main fragment, m/q = 77) to 30 eV (main fragment, m/q = 103).35
6 18 19 20 21 22 23 24 25 m /q = 1 02 42230 cm-1 m /q = 1 28 Io n S ig na l TOF (µs) pa re nt io n: m /q = 13 0 m /q = 7 7 m /q = 1 03 27870 cm-1
The photodissociation electronic spectra of cold QH+ measured by collecting the fragment ion signal on mass channels m/q = 77, 102, 103 and 128 are plotted in Figure 2. The onset of the absorption is more clearly visualized on the m/q = 103 and 128 channels associated to the fragment ions that dominate the mass spectrum upon excitation at lower energy. Three band systems are identified in the spectra. The first band evidences a clear 00 transition at h = 27868 cm1 followed by a well-defined vibrational structure, where the bandwidths are found only slightly broader (15 cm1) than the spectral resolution of the laser, which should correspond to the convolution of the laser width with the rotational contour. A second absorption appears quite unresolved starting at 32500 cm1, which is more clearly
distinguished on the m/q = 77 and 102 channels. From the onset of this band it is possible to estimate a transition energy in the range 32000-33000 cm1, which agrees perfectly well with the second excited state (S2) energy calculated for QH+ (see Table 1). The third transition
comes into view at h = 42230 cm1, preferentially leading to phenyl fragments (m/q = 77). It exhibits a rather intense 00 transition together with several active vibrational modes. In this
Figure 1. Difference (photodissociation laser: on off) TOF mass spectra of protonated quinoline (m/q = 130, negative peak) at h= 42230 and 27870 cm1.
Ion fragment signals (positive peaks) at m/q = 77 (phenyl cation), 102, 103 and 128 result respectively from loss of HCN+C2H2 (or C3H3N), C2H2+H2 (or
7
third electronic state, however, the bandwidths are markedly larger than those associated with the first excited state (FWHMs 30 cm1). An interesting feature in the photodissociation
spectrum of QH+ is the closing of the fragmentation channel corresponding to the elimination of hydrogen cyanide above h = 33600 cm1, as observed in the spectrum recorded in the m/q = 103 fragment (Figure 2). 30000 35000 40000 45000 m/q = 77 m/q = 102
In
te
ns
ity
(
ar
b.
un
it
s)
m/q = 103 m/q = 128excitation energy (cm
-1)
The assignment of the vibrational structure of the first and third absorption bands is shown in Figure 3 by zooming respectively the spectral region in the vicinity of S1S0 and
S3S0 transition origins. The active vibrations were labeled using the index of the calculated
normal mode that better matches the experimental energy (see Table 2). The S1S0 spectrum
of QH+ is vibrationally well resolved, having a more complex structure than expected from
Figure 2. Photofragmentation electronic spectra of protonated quinoline measured by collecting the ion signal on mass channels m/q = 77, 102, 103 and 128. Three band systems are observed: i) structured band system starting at h = 27868 cm1 (with decreasing intensities in mass channels m/q = 103, 128 and 77), ii) unresolved band starting at 32500 cm1 (better distinguished
on the m/q = 77 and 102 channels), and iii) structured band system starting at h = 42230 cm1 (m/q = 77 and 102 channels).
8
the photodissociation action spectrum measured at room temperature.25 It is dominated by three active modes observed at 481 cm1 (1 and 2 quanta, assigned to 32), 492 cm1 (1 to 4
quanta, assigned to 31) and 576 cm1 (1 to 3 quanta, assigned to 30), as well as several of
their combination bands. The modes 33, 29 and 28 are also visible in the spectrum and are
excited in combination with some of the other active modes. Even though the S3S0
vibrations are notably broader, we were able to assign vibrational progressions of modes observed at 31 = 480 cm1 (1-2 quanta), 30 = 578 cm1 (1-3 quanta) and 29 = 719 cm1 (1-2
quanta), as well as combination bands involving these modes.
0 500 1000 1500 2000 (31 + n 30) (2 8) 4 3 2 0 1 S3 S0 (30 + n 32) (3 3) (32) (m/q = 103) (30 + n 31)(30) In te ns it y (a rb .u ni ts ) (31) (m/q = 77) S1 S0 0 1 2 3 0 1 2 (2 9) (2 4 7) 2 1 0 ( + n) 3 2 1 0 ( + n) ( + n) (29) (30)
energy above origin (cm-1)
(31)
0 1 2
(2 + )
Figure 3. Photofragmentation spectra of cold protonated quinoline in the vicinity of the first (S1So) and third (S3So) band origins. The spectra were
recorded with a 0.02 nm scanning step on the indicated mass channels. Vibronic assignment of the active modes in the spectra was done with the help of S1 and S3 calculated normal modes (see Table 2).
9
3.2 Electronic spectra of iQH+
In agreement with the experiment performed by Hansen et al.,24 photodissociation mass spectra of trapped QH+ and iQH+ protonated ions are very much alike, leading to the same fragmentation pattern. For protonated isoquinoline, the main fragment observed via excitation in the 41670-43480 cm1 energy region is again the phenyl cation (m/q = 77), changing the branching ratio in favor of the hydrogen cyanide loss upon excitation in the
27780-29410 cm1 region with the consequent predominance of m/q = 103 fragments in the
mass spectrum. The same behavior is found in CID mass spectra of iQH+ for collision energies increasing from 30 to 50 eV, where the most intense fragment peak changes from m/q = 103 to m/q = 77.35
The UV-vis absorption of cold iQH+ is given in Figure 4 for the mass channels m/q = 77, 102, 103 and 128. At first sight, the electronic spectrum looks very similar to that of QH+ and the band origins almost coincide. At low energies, the band recorded on the m/q = 103 mass channel exhibits a strong 00 transition at h = 28043 cm1 (356.6 nm) while at higher energies a new band starts at h = 41988 cm1 (238.2 nm) on the m/q = 77 channel. Similarly to the QH+ case, an intermediate unresolved band appears in the m/q = 77 channel, this time at 35100 cm1, which compares well with the second excited state (S2) energy calculated for
iQH+ (see Table 1) and is shifted by ~2500 cm1 with respect to the QH+ second excited state. Just as in the case of QH+, the fragmentation channel leading to the elimination of hydrogen cyanide (m/q = 103 mass channel in Figure 4) closes above 33600 cm1 for iQH+.
10 30000 35000 40000 45000 m/q = 77 m/q = 102
In
te
ns
ity
(
ar
b.
un
it
s)
m/q = 103 m/q = 128excitation energy (cm
-1)
The first absorption band (S1S0 transition) of iQH+ shown in Figure 5 exhibits a
well-defined vibrational structure with bandwidths of FWHMs 15 cm1, again slightly
broader than the spectral resolution of the laser, which should correspond to the convolution of the laser width with the rotational contour. It is possible to distinguish two dominant modes at 31 = 492 cm1 (1-3 quanta), and 30 = 589 cm1 (1-2 quanta), and combination bands
between them and including the modes 33 and 32 as well. Bands corresponding to the modes 33, 32, 29 and 28 have also been assigned in the spectrum. In the same figure it is observed
that the vibrational bands linked to the S3S0 electronic transition are markedly broader
(FWHMs 130 cm1), which implies that the lifetime of this excited state (S
3 in our
calculations) is limited to less than 260 fs, in contrast to the S1 case. In spite of the large Figure 4. Photofragmentation electronic spectra of protonated isoquinoline
measured by collecting the ion signal on mass channels m/q = 77, 102, 103 and 128. Three band systems are observed: i) structured band system at h = 28043 cm1 (clearly observed on the m/q = 103 mass channel and more weakly for m/q = 77), ii) unresolved band starting at 35100 cm1 (better distinguished on
the m/q = 77 and 102 channels), and iii) structured band system at h = 41988 cm1 (m/q = 77 and 102 channels).
11
bandwidths, we have tentatively assigned two vibrational modes (1-3 quanta) at 32 = 461
cm1 and 30 = 599 cm1. 0 500 1000 1500 2000 (31+ 32) (2 8) (2 9) 3 S3 S0 (31+ n 33) (3 3) (31) (m/q = 103) (30 + n 31) In te ns it y (a rb .u ni ts ) (30) (m/q = 77) S1 S0 0 1 2 0 1 2 (3 2) 3 2 2 1 0
energy above origin (cm-1) (32)
(30)
0 1 3
3.3 Calculations
The protonation site of QH+ and iQH+ is limited in our calculations to the N heteroatom (see Scheme 1). The other tautomers with protonation on a carbon atom are at least 12100 cm1 (1.5 eV) higher in energy according to our calculations. It is worth to remark that high-energy tautomers cannot usually be ignored since they have been occasionally evidenced28,33 despite the low temperatures achieved in the trap. In the present case, C-protonated tautomers were not taken into account based on the results of double resonance experiments (see Supporting Information), which show that only a single species (N-protonated tautomer) is responsible for the observed spectra.
Figure 5. Photofragmentation spectra of cold protonated isoquinoline in the vicinity of the first (S1So) and third (S3So) band origins. The spectra were
recorded with a 0.02 nm scanning step on the indicated mass channels. Vibronic assignment of the active modes in the spectra was done with the help of S1 and S3 calculated normal modes (see Table 3).
12
The optimized (MP2/cc-pVDZ) ground state of protonated isoquinoline is 72 cm1
(0.009 eV) more stable than that of protonated quinoline. C1 point-group symmetry ADC(2)
adiabatic transition energies corrected by the variation of the ZPEs between the excited and the ground states, (Eo), and the respective oscillator strength values (f) are presented in Table
1 for both ions. Important differences are found between vertical (not shown in Table 1) and adiabatic transition energies, reaching 3600 and 2600 cm1 (0.45 eV and 0.32 eV ) for the corresponding S1S0 transition in QH+ and iQH+, respectively. It points out the necessity of
performing excited-state optimizations for these molecular ions in order to properly compare the experimental results with the calculations. It is observed in Table 1 that the ADC(2) energy values computed in the present work are in better correspondence with the experimental band onsets (Eexp) than the DFT calculations performed previously,24 included in
the table between brackets.
QH+ iQH+
E0/cm1 Eexp/ cm1 f E0/cm1 Eexp/ cm1 f
S1 (29 971) 27 370 27 868 (0.04) 0.040 (29 955) 27 810 28 043 (0.070) 0.07
S2 (35 737) 32 730 32 500 (0.097) 0.074 (37 052) 34 770 35 100* (0.001) 0.0007
S3 (46 247) 42 730 42 230 (0.64) 0.63 (46 494) 43 420 41 988 (0.71) 0.65
Table 1. ADC(2) adiabatic excitation energies (E0) for protonated quinoline and isoquinoline (DFT calculations
performed in reference 24 are enclosed in brackets) and oscillator strengths (f). Experimental transition energies (Eexp) are taken from band origins; (*) very weak transition, the assignment of the band onset at 35100 cm1 is
tentative. Ground state geometry optimized in C1 point-group symmetry (MP2/cc-pVDZ).
The energetics of the low lying excited states of QH+ and iQH+ is very similar, in agreement with the good correspondence between their electronic spectra in Figures 2 and 4. In both molecular ions the excitation to the first excited state (S1) involves a π-HOMO to an
antibonding π*-LUMO transition with a moderate oscillator strength, which can be perfectly assigned to the first band of the electronic spectrum (band onsets at 27868 cm1 for QH+ and 28043 cm1 for iQH+). In the case of QH+, the next excitation (S2S0) can largely be
13
strength is significant. However, the iQH+ S2S0 transition involves additional molecular
orbitals (HOMO and LUMO+1) and the calculations predict almost no absorption for this transition. This is in agreement with the experiments (m/q = 77 and 102 channels), in which a well-defined band starts at 32500 cm1 for QH+, very close to the E
0 value calculated for S2,
while only a very weak absorption at 35100 cm1 appears in the case of iQH. Supplementary
S1 and S2 optimizations have been performed starting from non-planar structures, which
converged back to planar geometry. The third excitation (S3S0) computed for QH+ and
iQH+ lies in the deep UV region, showing E0 values close to the observed band onsets at
42230 cm1 and 41988 cm1, respectively. Even though several molecular orbitals contribute to this transition in iQH+, the (LUMO+1←HOMO) transition prevails. According to our calculations, * states are not energetically accessible. Under Cs-symmetry restriction, the optimized S1 excited state of QH+ and iQH+ are found of A’(*) type and the transition
energies are the same as with the C1 symmetry calculation.
S1 and S3 low lying vibrational modes ( calc) calculated for QH+ and iQH+ are shown
in Tables 2 and 3, respectively. The assignment of the experimental bands ( exp) is done under
the assumption that at the low temperature of the experiment the vibrational modes of the electronic ground state are not excited. We have restricted the list to frequencies lower than 1000 cm1 and excluded a few unassigned experimental bands of weak intensity. Although most of calculated frequencies agree well with the measured values, in a few cases the assignment must be considered as tentative because exp calc exceeds the experimental
resolution of the apparatus (indicated with asterisks in the tables. The calculated in-plane vibrational modes 28-33 are active in the S1 excited state of QH+ under our experimental
conditions, three of them being clearly assigned to intense spectral bands: exp = 576 cm1
( 30, nonsymmetrical ring deformation), exp = 492 cm1 ( 31, symmetrical breathing), and
exp = 481 cm1 ( 32, nonsymmetrical ring deformation). The modes 30 and 31 are also active
in the S3 excited state at slightly different frequencies (578 and 480 cm1, respectively). The
low energy out-of-plane mode 47 is apparently active in the S3 state of QH+ (two quanta
match the band at exp = 220 cm1). The in-plane low frequency vibrations calculated for iQH+
do not differ much in energy from those of its structural isomer. In-plane iQH+ vibrational modes 28-33 are again active in S1, the same three modes, exp = 588 cm1 ( 30, symmetrical
14
nonsymmetrical breathing) prevailing. The modes 30-32 appear to be active in the S3 excited
state of iQH+ ( 30 at 656 cm1 and a band comprising 32 and 31 at 456 cm1), although the
assignment is not conclusive due to the large experimental bandwidths. No out-of-plane modes are visible in the experimental spectra of iQH+.
S1 S0 S3 S0
exp (cm1) calc (cm1) assignment exp (cm1) calc (cm1) Assignment
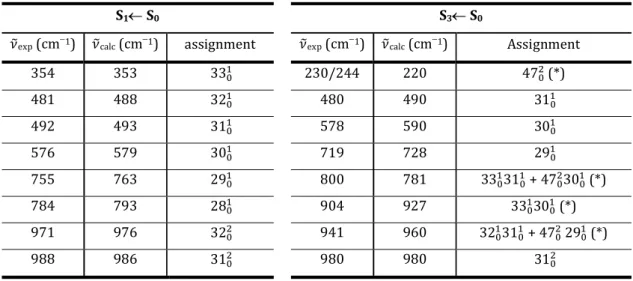
354 353 33 230/244 220 47 (*) 481 488 32 480 490 31 492 493 31 578 590 30 576 579 30 719 728 29 755 763 29 800 781 33 31 + 47 30 (*) 784 793 28 904 927 33 30 (*) 971 976 32 941 960 32 31 + 47 29 (*) 988 986 31 980 980 31
Table 2. Experimental vibrational frequencies and calculated normal modes of QH+ for the S
1So and S3So transitions. (*) Tentative assignment.
S1 S0 S3 S0
exp (cm1) calc (cm1) assignment exp (cm1) calc (cm1) assignment
344 344 33 456 461 and 497 32 and 31 467 484 32 (*) 656 599 30 (*) 486 492 31 903 922 32 (*) 588 589 30 749 763 29 783 785 28 831 830 33 31 950 976 32 31 (*) 970 984 31
Table 3. Experimental vibrational frequencies and calculated normal modes of iQH+ for the S
15
4. Discussion
The fragmentation spectra of the molecular ions QH+ and iQH+ look very similar (compare Figures 2 and 4), exhibiting two intense band systems associated with the S1S0
and S3S0 absorptions (UV and deep-UV bands, respectively) in addition to a weak broad
structure located in between, which has been assigned to the S2S0 absorption. The UV and
deep-UV band origins correspond reasonably well with previous estimations done by action spectrometry at room temperature,24 although the low temperature of the ions achieved in our experiments allow us to observe well-defined 00 bands and clear progressions of vibrational
bands (Figures 3 and 5). In the UV and deep-UV range, the electronic spectra of QH+ and
iQH+ are governed by the excitation of electrons. All the observed transitions are of * character because protonation transforms the n orbital (lone pair) on the nitrogen atom to a orbital and the resulting * transitions become too high to be observed. * transitions are also calculated beyond experimental access due to their high energies.
In coincidence with previous DFT calculations,24 the RI-ADC(2) method also shows
that the S1S0 excitation in both QH+ and iQH+ can be viewed to a great extent as a transition
from the HOMO to the LUMO, while S2S0 and S3S0 excitations involve other orbitals.
The probability density of the HOMO is somewhat larger on the non-protonated ring than on the heterocycle, whereas a more uniform distribution characterizes the LUMO. Consequently, a small degree of charge transfer (CT) is involved in the photoabsorption of quinolinium ions, in contrast to the structurally-akin protonated naphthalene (NphH+) for which the S
1S0
excitation involves a clear transition of one electron from the non-protonated to the protonated aromatic ring.26 The S1S0 band origins of QH+ and iQH+ reported in Figures 2 and 4 are
shifted about 0.5 eV to lower energies with respect to the onsets of the * transition (S2S0,
in this case) of quinoline20 and isoquinoline.21 The observed spectral shifts to the red denote an enhancement of the proton affinity in the S1 state, which is probably a common feature
among polyaromatic hydrocarbons and N-heterocycles.
An interesting observation comes out when the computed adiabatic excitation energies summarized in Table 1 are compared with the experimental results. Although the ADC(2) transition energies agree very closely with the observed band onsets, the computed oscillator strengths do not reproduce the relative band intensities found in the spectra. For example, one would expect larger f(S1S0) values in the calculations for both QH+ and iQH+, considering
16
that the experimental bands are very intense. This was also noted previously24 for the same species. An explanation for that might be that the oscillator strength effect on the band intensity can be to a great extent compensated by large Franck Condon factors.
The structural similarity of QH+, iQH+ and NphH+ can also be accounted for by plotting the vibrationally resolved photofragmentation spectra of these ions in the vicinity of the S1S0 band origin, as shown in Figure 6. The low lying active vibrational modes 28-33 of
QH+ and iQH+ match reasonably well with the modes 29-34 of NphH+ (see supplementary
information of reference 27). The first mode in the region of 340 cm1 (indicated as
33 for
the protonated quinolines and 34 for protonated naphthalene) correspond to the in-plane
symmetric bending, while the mode at 485 cm1 (
31, QH+ and iQH+; 32 NphH+) is a
symmetric breathing, and the other modes involve different in-plane deformations of the carbon skeleton. The modes 29-31 are also present in the S3S0 excitation.
0
500
1000
~ ~ ~ ~ 29 28
(cm
-1)
QH+ : 33 32 31 30 29 28 30 29 iQH+ 33 32 31 32 31 30 : 33 : 34 NphH+Figure 6. Comparison among the photofragmentation spectra of protonated quinoline (QH+), isoquinoline (iQH+) and naphthalene (NphH+) in the vicinity of the S1S0 band origin. The numbers label the low lying active vibrational modes.
17
The transition to the S2 state is observed broad and featureless in QH+ and iQH+
spectra, probably because it is involved in a fast internal conversion process. However, according to our ab-initio calculations, the excited state S2 does not lose its planar symmetry
and this makes improbable that an out-of-plane non-radiative deactivation channel towards the ground state will take place. The reason for the absence of structure is not clear.
The S3S0 absorption in quinolinium ions is found practically selective to the
fragmentation channel leading to the phenyl cation (m/q = 77) and it exhibits a fast deactivation rate estimated in terms of the experimental bandwidths (particularly for iQH+), which are much larger than the apparatus resolution. A question arises whether the photoexcitation to the S3 excited state induces the production of phenyl cations by secondary
fragmentation of m/q = 103 ions or alternatively a non-sequential fragmentation pathway takes place. Evidence supporting that the phenyl cation is not the daughter ion from the m/q = 103 fragment arises by considering the different rate of formation of both ions. It was found that while the phenyl fragments are produced in a very short time (less than 100 ns) after the fragmentation laser pulse, it takes several milliseconds for m/q = 103 fragments to appear in the trap.
The ultrashort lifetime of the S3 excited state suggested by the bandwidths appearing
in the deep-UV absorption of iQH+ and, to a lower extent, QH+ might originate from a non-radiative deactivation via isomerization processes like those occurring in other azabenzenes. For example, valence isomers such as Dewar and prefulvene structures have been proposed as intermediates associated to the 2-3 ps relaxation of the lowest * excited state measured for isolated pyridine36 and for protonated pyridine in solution37 by femtosecond time-resolved mass spectrometry and transient absorption, respectively. A conical intersection located by ab-initio calculations of the potential surfaces was found to play a determinant role in the isomerization pathway leading to the ultrafast deactivation.38 Dewar pyridines have also been produced by argon matrix isolation and UV irradiation and characterized by FT IR.39 Although the Dewar forms of protonated quinoline and isoquinoline are energetically accessible from their S3 excited state according to DFT/B3LYP calculations, no direct
evidence on the formation of these photoisomers is derived from our experiments.
Finally, photoproducts and branching ratios do not change from QH+ to iQH+ and are consistent with those obtained by action spectroscopy at room temperature, which were extensively analyzed in reference 24.
18
5. Conclusions
The key result of the present work is the presentation of cold photofragmentation spectra of single-isomeric protonated quinoline and isoquinoline ions, together with ab-initio adiabatic transitions energies that nicely match with the experimentally well-defined band onsets. Although the second band in the electronic spectra does not show any vibrational structure, the first and the third absorptions show several in-plane vibrations that have been analyzed and assigned with the help of calculations performed in the ground and the excited states.
The bandwidths measured in the deep-UV absorption of iQH+ and, to a lower extent,
in QH+ denote that the lifetime of the S
3 excited state is in the subpicosecond time scale,
possibly via a relaxation pathway involving valence photoisomers.
Finally, we have observed that the vibrational progressions in the S1 excited state of
QH+ and iQH+ look very similar and resemble that of the structurally related protonated naphthalene.
Bibliography:
1. Kozin, I. S.; Larsen, O. F. A.; de Voogt, P.; Gooijer, C.; Velthorst, N. H. Isomer-Specific Detection of Azaarenes in Environmental Samples by Shpol’skii Luminescence Spectroscopy. Anal. Chim. Acta 1997, 354, 181187.
2. Blumer, M.; Dorsey, T.; Sass, J. Azaarenes in Recent Marine Sediments. Science 1977, 195, 283285.
3. Pereira, W. E.; Rostad, C. E.; Garbarino, J. R.; Hult, M. F.
Groundwater Contamination by Organic Bases Derived from Coal-Tar Wastes. Environ. Toxicol. Chem. 1983, 2, 283294.
4. Bleeker, E. A.; Wiegman, S.; deVoogt, P.; Kraak, M.; Leslie, H. A.; de Haas, E.; Admiraal, W. Toxicity of Azaarenes. Rev. Environ. Contam. Toxicol.2002, 173, 3983.
19
5. Tucker, S. A.; Acree, W. E., Jr.; Upton, C. Polycyclic Aromatic Nitrogen Heterocycles. Part V: Fluorescence Emission Behavior of Select Tetraaza- and Diazaarenes in Nonelectrolyte Solvents. Appl. Spectrosc. 1993, 47, 201206.
6. Ricca, A.; Bauschlicher, C. W.; Rosi, M. Mechanism for the Incorporation of a Nitrogen Atom into Polycyclic Aromatic Hydrocarbon Cations. Chem. Phys. Lett. 2001, 347, 473480.
7. Bernstein, M. P.; Mattioda, A. L.; Sandford, S. A.; Hudgins, D. M. Laboratory Infrared Spectra of Polycyclic Aromatic Nitrogen Heterocycles: Quinoline and Phenanthridine in Solid Argon and H2O. Astrophys. J. 2005, 626, 909918.
8. Hudgins, D. M.; Bauschlicher, C. W., Jr.; Allamandola, L. J. Variations in the Peak Position of the 6.2 μm Interstellar Emission Feature: A Tracer of N in the Interstellar Polycyclic Aromatic Hydrocarbon Population. Astrophys. J. 2005, 632, 316322.
9. Van der Zwet, G. P.; Allamandola, L. J. Polycyclic Aromatic Hydrocarbons and the Diffuse Interstellar Bands. Astron. Astrophys. 1985, 146, 7680.
10. Léger, A.; d’Hendecourt, L. Are Polycyclic Aromatic Hydrocarbons the Carriers of the Diffuse Interstellar Bands in the Visible? Astron. Astrophys. 1985, 146, 8185.
11. Crawford, M. K.; Tielens, A. G. G. M.; Allamandola, L. J. Ionized Polycyclic Aromatic Hydrocarbons and the Diffuse Interstellar Bands. Astrophys. J. 1985, 293, L45L48. 12. Allamandola, L. J.; Tielens, A. G. G. M.; Barker, J. R. Interstellar Polycyclic Aromatic
Hydrocarbons - The Infrared Emission Bands, the Excitation/Emission Mechanism, and the Astrophysical Implications. Astrophys. J. Suppl. Ser. 1989, 71, 733775.
13. Tielens, A. G. G. M. Interstellar Polycyclic Aromatic Hydrocarbon Molecules. Annu. Rev. Astron. Astrophys. 2008, 46, 289337.
20
14. Mattioda, A. L.; Rutter, L.; Parkhill, J.; Head-Gordon, M.; Lee, T. J.; Allamandola, L. J. Near-Infrared Spectroscopy of Nitrogenated Polycyclic Aromatic Hydrocarbon Cations from 0.7 to 2.5 μm. Astrophys. J. 2008, 680, 12431255.
15. Alvaro Galué, H.; Pirali, O.; Oomens, J. Gas-phase Infrared Spectra of Cationized Nitrogen-Substituted Polycyclic Aromatic Hydrocarbons. Astron. Astrophys. 2010, 517, A15.
16. Boersma, C.; Bregman, J. D.; Allamandola, L. J. Properties of Polycyclic Aromatic Hydrocarbons in the Northwest Photon Dominated Region of NGC 7023. I. PAH Size, Charge, Composition, and Structure Distribution. Astrophys. J. 2013, 769, 117.
17. Dryza, V., Sanelli, J. A., Robertson, E. G., & Bieske, E. J. Electronic Spectra of Gas-Phase Polycyclic Aromatic Nitrogen Heterocycle Cations: Isoquinoline+ and Quinoline+. J. Phys. Chem. A 2012, 116, 43234329.
18. Noble, J. A.; Dedonder, C.; Jouvet, C. The Electronic Spectra of Protonated PANH Molecules. Astron. Astrophys. 2015, 577, A79.
19. Wanna, J.; Bernstein, E. R. van der Waals Clusters of Pyridazine and Isoquinoline: The Effect of Solvation on Chromophore Electronic Structure. J. Chem. Phys.1987, 86, 67076716.
20. Hiraya, A.; Achiba, Y.; Kimura, K.; Lim, E. C. Identification of the Lowest Energy n* States in Gas-Phase Polycyclic Monoazines: Quinoline and Isoquinoline. J. Chem. Phys. 1984, 81, 33453347.
21. Hiraya, A.; Achiba, Y.; Kimura, K.; Lim, E. C. Multiphoton Ionization Photoelectron Spectroscopy of Molecular Excited States in Supersonic Jet: Low-Lying Electronic States of Isoquinoline. Chem. Phys. Lett. 1991, 185, 303–309.
21
22. Bouwman, J.; Sztáray, B.; Oomens, J.; Hemberger, P.; Bodi, A. Dissociative Photoionization of Quinoline and Isoquinoline. J. Phys. Chem. A 2015, 119, 1127–1136. 23. Klærke, B.; Holm, A. I. S.; Andersen, L. H. UV Action Spectroscopy of Protonated PAH
Derivatives. Methyl Substituted Quinolines. Astron. Astrophys. 2011, 532, A132.
24. Hansen, C. S.; Blanksby, S. J.; Trevitt, A. J. Ultraviolet Photodissociation Action Spectroscopy of Gas-Phase Protonated Quinoline and Isoquinoline Cations. Phys. Chem. Chem. Phys. 2015, 17, 25882.
25. Féraud, G.; Dedonder-Lardeux, C.; Jouvet, C.; Inokuchi, Y.; Haino, T.; Sekiya, R.; Ebata, T. Development of Ultraviolet–Ultraviolet Hole-Burning Spectroscopy for Cold Gas-Phase Ions. J. Phys. Chem. Lett. 2014, 5, 12361240.
26. Alata, I.; Omidyan, R.; Broquier, M.; Dedonder, C.; Dopfer, O.; Jouvet, C. Effect of Protonation on the Electronic Structure of Aromatic Molecules: NaphthaleneH+. Phys. Chem. Chem. Phys. 2010, 12, 14456–14458.
27. Alata, I.; Dedonder, C.; Broquier, M.; Marceca, E.; Jouvet, C.Role of the Charge-Transfer State in the Electronic Absorption of Protonated Hydrocarbon Molecules. J. Am. Chem. Soc.2010, 132, 17483–17489.
28. Alata, I.; Bert, J.; Broquier, M.; Dedonder, C.; Feraud, G.; Grégoire, G.; Soorkia, S.; Marceca, E.; Jouvet, C. Electronic Spectra of the Protonated Indole Chromophore in the Gas Phase. J. Phys. Chem. A 2013, 117, 44204427.
29. Kang, H.; Féraud, G.; Dedonder-Lardeux, C.; Jouvet, C. New Method for Double-Resonance Spectroscopy in a Cold Quadrupole Ion Trap and Its Application to UV–UV Hole-Burning Spectroscopy of Protonated Adenine Dimer. J. Phys. Chem. Lett. 2014, 5, 27602764.
22
30. Ahlrichs, R.; Bär, M.; Häser, M.; Horn, H.; Kölmel, C. Electronic Structure Calculations on Workstation Computers: The Program System Turbomole. Chem. Phys. Lett.1989, 162, 165169.
31. Trofimov, B.; Stelter, G.; Schirmer, J. Electron Excitation Energies Using a Consistent Third-Order Propagator Approach: Comparison with Full Configuration interaction and Coupled Cluster Results. J. Chem. Phys. 2002,117, 6402–6410.
32. Taccone, M. I.; Féraud, G.; Berdakin, M.; Dedonder-Lardeux, C.; Jouvet, C.; Pino, G. A.
Communication: UV Photoionization of Cytosine Catalyzed by Ag+. J Chem Phys. 2015,
143, 041103.
33. Féraud, G.; Berdakin, M.; Dedonder, C.;Jouvet, C.; Pino, G. A. Excited States of Proton-Bound DNA/RNA Base Homodimers: Pyrimidines. J. Phys. Chem. B 2015, 119, 2219– 2228.
34. Féraud, G.; Esteves-López, N.; Dedonder-Lardeux, C.; Jouvet, C. UV Spectroscopy of Cold Ions as a Probe of the Protonation Site. Phys. Chem. Chem. Phys. 2015, 17, 2575525760.
35. Horai, H.; Arita, M.; Kanaya, S.; Nihei, Y.; Ikeda, T.; Suwa. K.; Ojima, Y.; Tanaka, K.; Tanaka, S.; Aoshima, K.; Oda, Y.; Kakazu, Y.; Kusano, M.; Tohge, T.; Matsuda, F.; Sawada, Y.; Yokota Hirai, M.; Nakanishi, H.; Ikeda, K.; Akimoto, N.; Maoka, T.; Takahashi, H.; Ara, T.; Sakurai, N.; Suzuki, H.; Shibata, D.; Neumann, S.; Iida, T.; Tanaka, K.; Funatsu, K.; Matsuura, F.; Soga, T.; Taguchi, R.; Saito, K.; Nishioka, T. J. MassBank: A Public Repository for Sharing Mass Spectral Data for Life Sciences. Mass Spectrom. 2010, 45, 703714.
36. Zhong, D.; Diau, E. W.-G.; Bernhardt, T. M.; De Feyter, S.; Roberts, J. D.; Zewail, A. H. Femtosecond dynamics of valence-bond isomers of azines: transition states and conical intersections. Chem. Phys. Lett. 1998, 298, 129–140.
23
37. Chachisvilis, M.; Zewail, A. H. Femtosecond Dynamics of Pyridine in the Condensed Phase: Valence Isomerization by Conical Intersections. J. Phys. Chem. A 1999, 103, 74087418.
38. Srinivasan, R.; Feenstra, J. S.; Park, S.; Xu, T. S.; Zewail, A. H. Dark Structures in Molecular Radiationless Transitions Determined by Ultrafast Diffraction. Science 2005, 307, 558–563.
39. Kudoh, S.; Takayanagi, M.; Nakata, Munetaka. Dewar Pyridine Studied by Matrix Isolation Infrared Spectroscopy and DFT Calculations. J. Photochem. Photobiol. 1999, 123, 2530.