Chemical Abundance Analysis of HE 2324-0215,
an r-Process-Enhanced Metal-Poor Star
by
Thanawuth Thanathibodee
Submitted to the Department of Physics
in partial fulfillment of the requirements for the degree of
Bachelor of Science in Physics
at the
MASSACHUSETTS INSTITUTE OF TECHNOLOGY
June 2016
@
2016 Thanawuth Thanathibodee. All rights reserved.
The author hereby grants to MIT permission to reproduce and to
distribute publicly paper and electronic copies of this thesis document
in whole or in part in any medium now known or hereafter created.
Signature redacted
A u th o r ... . . . . - - - - ...Department of Physics
May 13, 2016
Certified by...
Accepted by ...
MASSACHUSETTS INSTITUTE OF TECHNOLOGYJUL 0
7
2016
Signature redacted
Anna Frebel
Assistant Professor of Physics
Thesis Supervisor, Department of Physics
Signature redacted...
Nergis Mavalvala
Professor of Physics
Senior Thesis Coordinator, Department of Physics
Chemical Abundance Analysis of HE 2324-0215,
an r-Process-Enhanced Metal-Poor Star
by
Thanawuth Thanathibodee
Submitted to the Department of Physics on May 13, 2016, in partial fulfillment of the
requirements for the degree of Bachelor of Science in Physics
Abstract
We report the abundance analysis of the metal-poor halo star HE 2324-0215 for 22 neutron-capture elements and 14 light elements with Z < 30. The stellar parameters are [Fe/H] = -3.05 0.17, Teff = 4477 K, Vt = 2.70 kms-1, and log(g) = 0.70,
indicating that HE 2324-0215 is a red giant star. The [Eu/Fe] = 0.73 and [Ba/Eu]
= -0.68 suggests that this is an r-I star. Since thorium is detectable in this star, we
derived the age of the star by the means of radioactive decay, resulting in the age of
13.0 1.0 Gyr. The age and the metallicity of the star suggest that HE 2324-0215
formed in a dwarf galaxy which was later accreted and became part of the Milky Way. Thesis Supervisor: Anna Frebel
Acknowledgments
I would like to thank my wonderful thesis supervisor and mentor Anna Frebel for her
advice, support, and patience during the past three years of working with her. She is always available, in one way or another, when I need to ask some random questions about my research. I also would like to thank Heather Jacobson for her help and suggestions, be it scientifically or technically, while I was combating with these lovely syntheses. I am very thankful to Alex Ji for all of his technical help along the way and for being very resourceful when it come to the science. This thesis is impossible without them.
I would like to extend my gratitude to my family and my MIT friends, who always support me through my undergraduate years. I would not be here without them. I want to thank PN and PC for stopping by every time they walk past my bench in Building 37. Finally, I would like to thank B, for always being supportive and encouraging throughout this whole process.
I would like to acknowledge support from MIT UROP program during the early stage of this project.
Contents
1 Introduction 8
2 Observations 11
3 Abundance Analysis 12
3.1 Equivalent Width Measurements ... ... 12
3.2 Stellar Parameters . . . . 12
3.3 Spectral Synthesis . . . . 14
3.4 Carbon Isotope Ratio . . . . 15
4 Chemical Abundances of HE 2324-0215 16 4.1 Abundances of Light Elements . . . . 16
4.2 Neutron-capture Elements . . . . 16 4.2.1 Spectra Complications . . . . 20 4.3 Elements of Interest . . . . 21 4.3.1 Palladium . . . . 22 4.3.2 Barium . . . . 22 4.3.3 Praseodymium . . . . 22 4.3.4 Europium . . . . 23 4.3.5 Terbium . . . . 23 4.3.6 Osmium . . . . 24 4.3.7 Iridium . . . . 24 4.3.8 Thorium . . . . 25
27 29 31 5 Cosmochronology using Thorium
6 Summary & Discussion
List of Figures
4-1 The Abundance of Neutron-Capture Elements in HE 2324-0215 . . . 20
List of Tables
4.1 Abundances of Light Elements . . . . 17
4.2 Abundances of Neutron-Capture Elements . . . . 19
5.1 Thorium-derived Age . . . . 28
Chapter 1
Introduction
Metal-poor stars can be used to study the chemical evolution of the Universe, as they record the nucleosynthesis history of the chemical elements and their production locales. Studying metal-poor stars with different metallicities, and thus various ages, gives us an insight into when and how each elements was created, as well as their relative production rates, thus constraining theoretical predictions of nucleosynthesis in the early universe.
The only elements created in the Big Bang were hydrogen, helium, and small amount of lithium; all other elements were created in astrophysical processes during the evolution of stars. The death of the first generation of stars released large amounts of newly created elements into interstellar space. The absence of observations of first-generation stars in our galaxy, when observations of old second-first-generation metal-poor stars are available (Frebel & Norris, 2015), suggests that this release happened on a relatively short time scale since the first stars were likely very massive (Bromm & Larson, 2004) and thus exhausted their hydrogen in a short time. The later gener-ations of stars then formed from the abundant hydrogen and some metals provided
by the precursor stars. These stars were still relatively metal-poor since the metal
enrichment was only minimal until later times. The different formation conditions and production processes led to differences in the abundance evolution of individual elements. Fortunately, their signatures were captured in the stars formed at different times, thus enabling us to study the evolution of each metal.
The nucleosynthesis processes responsible for elements with atomic number higher than that of iron-peak elements are different than those that form lighter elements. The creation of heavy elements from lighter nuclei through fusion would be endother-mic. Insteadthey form by capture onto seed nuclei such as iron. The neutron-rich nuclei -decay into stable isotopes with higher atomic number. This process can be slow, called s-process, or rapid, called r-process. To overcome the strong nuclear force, the r-process nucleosynthesis requires a large neutron flux, thus requiring ex-treme astrophysical condition in order to occur (Arnould et al., 2007; Sneden et al.,
2008). Several types of dramatic events are thought to be the source of the r-process
production. The two most accepted categories of such events include neutron stars mergers (e.g. Lattimer & Schramm, 1976) and core-collapse supernovae (e.g. Meyer et al., 1992), though each model varies slightly.
Evidence for the r-process has been obtained from r-process-enhanced (r-process) stars found in the galactic halo. These stars are characterized by the relative abun-dance of barium and europium with [Ba/Eu] < 0 (Beers & Christlieb, 2005). They are further classified as moderately r-process-enhanced (r-I) stars with 0.3 < [Eu/Fe] <
+1.0 and highly r-process-enhanced (r-II) stars with [Eu/Fe] > +1.0. Large efforts,
such as the Hamburg/ESO R-process Enhanced Star survey (HERES) (Christlieb et al., 2004), have been made to discover more of these stars. Using the sample of medium resolution spectral data from the Hamburg/ESO Survey, Barklem et al.
(2005) found 35 r-I stars and 8 r-II stars. This result suggests that, among stars with
[Fe/H] < -2.5, the rate of r-I stars is 14% and the rate of r-II stars is 3%.
Follow-up study by Siqueira Mello et al. (2014) using high resolution spectra obtained the abundances of 7 r-I stars. Although r-I stars are more common among r-process stars (Barklem et al., 2005), and even with some stars characterized recently (i.e. Frebel et al., 2016), the numbers of r-I stars that have been studied in detail with high res-olution spectra are still low. Understanding the level of r-process enrichment in halo stars will have important implications for understanding the astrophysical site of the r-process which was recently suggested to be neutron star mergers (Ji et al., 2016). While r-II stars are likely the result of a prolific event, r-I stars may have originated
from the same process but within a larger gas cloud which could lead to dilution of the r-process enhancement. Therefore, more detailed, high resolution analysis of these stars are required in order to constrain the theoretical model and prediction of the production of r-process elements in the early universe.
We report the detailed high-resolution abundances analysis of 22 neutron-capture
elements in metal-poor r-I star HE 23240215 with [Fe/H] = -3.05 and [Eu/Fe] =
0.73. We also present the calculation of its age using the abundance of thorium, a
radioactive r-process element measurable in this star.
With these data, and other r-I stars, we will have a better understanding of how and when neutron-capture elements were produced in the early universe, as well as their subsequent evolution. This will enable a more complete picture of the history of the universe.
Chapter 2
Observations
HE 2324-0215 (ce = 2 3 h2 6mn5 2 2, =-01059'27'V7) was initially selected from the
Hamburg/ESO Survey (Frebel et al., 2006), where its low [Fe/H] was determined
using medium-resolution spectrum. Its relative brightness (V = 11.4) presented an opportunity to obtain high-resolution spectra in a relatively short exposure time. For this work, observations were taken with the 6.5 m Magellan-Clay telescope at Las Campanas Observatory in Chile using the MIKE spectrograph (Bernstein et al.,
2003). On 2014 June 22, we observed the entire visible range of HE 2324-0215
using the 0'!70 slit, obtaining both blue (A = 3200
A
- 5000A,)
and red (A = 4900A
- 10000 A) spectra. This yielded the resolution of ~ 35,000 and ~ 28,000 for the blue and the red spectrum, respectively. For this initial observation, the exposure times were 600s for both red and blue spectra. Once the nature of the star was realized, a follow-up spectrum was taken on 2014 September 25 using the ''35 slit
for a higher resolution of - 83,000, which was more suitable for detailed analysis of
neutron-capture lines that are usually very weak. For this observation, only the blue spectrum was used since almost all of the absorption lines of the neutron-capture elements situate at
<
4000A. The exposure time was 3600s for this higher resolution slit. All the observations utilized 2 x 2 in-chip binning. The signal-to-noise ratio are20(3500A), 70(4000A), and 140(4800A), for the 0'!70 slit. The ''35 slit gave SNR of 17, 120, and 270 at the same wavelengths. We used the MIKE Carnegie Python pipeline
Chapter 3
Abundance Analysis
3.1
Equivalent Width Measurements
We measure the equivalent width (EW) and reduced equivalent width (REW = log10(EW/A)) of an absorption line by fitting, assuming the Gaussian profile. Since
this assumption is not accurate for the very strong absorption, we only kept the lines with low REW but high enough to be above the noise. We imposed the constraint of
-9.0 < REW < -4.5. We used this method to measure the equivalent widths of the light elements except carbon, for which we utilized the synthesis method (see 3.3). The line list was obtained from Roederer et al. (2010).
3.2
Stellar Parameters
We used the O'!70 slit spectra for the determination of the stellar parameters since they cover the entire visible wavelength range. The process was completed with the
SMH software (Casey, 2014). The spectra were normalized semi-automatically and
stitched using the software. The Doppler correction was then applied by comparing the normalized spectrum with a spectrum of the metal-poor star HD 140283 in the
8450
A
- 8700A
region where the Ca II triplet is located.We measured the EWs and REWs of Fe I and II absorption lines. For Fe I, only lines with -6.0 < REW < -4.5 and without strong blends were retained. We relaxed
this constrained for Fe II to include 2 lines with REW of -6.07 and -6.04, which are in clean, high SNR regions. We measured the a of 195 Fe I lines and 25 Fe II lines.
We then fed the measurements into the software MOOG with a model atmosphere from Castelli & Kurucz (2004) and manual input of effective temperature Teff, micro-turbulence vt, surface gravity log(g), metallicity [M/H], and a-enhancement [a/H].
MOOG calculated the abundance log c of each line using the input parameters. The
resulting abundances were plotted against excitation potential x, REW, and A. We
measure Teff, Vt, log(g), and [M/H] by demanding that there is no trend between log 6
and x, and REW. The solar abundances were adopted from Asplund et al. (2009). It is known that temperatures measured spectroscopically result in cooler temper-atures than what other methods such as photometry yield. Therefore, we adjust the temperature according to Frebel et al. (2013) by
AT = 670 - 0.1T. (3.1)
Fixing Teff, we then made a final determination of vt, log(g), and [M/H] by varying their values until there was no trend between log c and REW, while the trend in log E vs x was disregarded since it was the result from adjusting the temperature. The
final stellar parameters for this star are Teff = 4477 K, vt = 2.70 km/s, log(g) = 0.70 dex, and [M/H] = -2.8 dex. The cool effective temperature and the low surface
gravity indicate that this star is a red giant. The resulting Fe abundance is [Fe/H] =
-3.05+0.17 dex, where the uncertainty is the standard deviation of the measurement.
After obtaining the stellar parameters, we used them to calculate the abundance of individual lines for other elements using MOOG. The final abundance for each element is the unweighted mean of the individual line abundance. The final uncertainty is the standard deviation of the measurement. We adopt the uncertainty of +0.15 for elements with only one measurement.
3.3
Spectral Synthesis
The abundances of all of the neutron-capture elements in our work were determined with spectral synthesis. We used the higher resolution Y'!35 blue spectrum for most of our measurements because most of the elements' absorption lines are in this region. Moreover, the higher resolution allowed us to better recognize blended line and correct for them.
We again made use of MOOG to measure the abundances. Using the derived stellar parameters and elemental abundances from the equivalent widths, we mea-sured the abundance of a line by varying its abundance and the abundances of other elements in the region until the synthesized and observed spectrum agreed. Local ad-justments of radial velocity, continuum placement, and the FWHM of the synthesized spectrum were manually assigned to aid the reproduction of the observed spectrum.
The radial velocity adjustments were checked by matching synthesized absorption lines to observed ones around the line of interest. These value ranged from 0.0-3.0
km s-1, concentrating at ~- 1.5 km s-1. The large deviation from this value generally
indicated blended lines. For each line, we tested the value of this adjustment and if the abundance was sensitive to this value, we assigned larger uncertainty accordingly.
Although the continuum normalization was determined earlier during the spec-tral processing, small local adjustments were made where necessary. For many clean regions, the adjustments were simple since the areas were mostly free from absorp-tion lines, showing large amounts of the true continuum. For the lines in crowded regions, the continuum placement was more difficult as there were rarely clean regions without any absorption lines. When this was particularly difficult, we assigned larger uncertainties due to slightly ambiguous continuum placement.
The FWHM was adjusted until the shape of the wings of the synthesized and observed absorption feature agreed. We checked this value against the trend between FWHM and A from Fe measurement. Large deviations from this indicated blended lines. For the cases where small variations in FWHM resulted in large abundance changes, we assigned larger uncertainties to account for that. However, only few such
instances were found, especially in the noisy, bluer region.
In addition, such as the Ir line at 3800A, the line lists were found to be incomplete and thus could not reproduced some absorption feature near the line of interest. In these cases, we introduce a fake line into the line lists to reproduce the features
surrounding the feature of interest.
The uncertainty for each abundance measurement were chosen such that varying radial velocity, continuum, and FWHM within a reasonable range would still result in an abundance within the uncertainty bound.
The details of the synthesis of each element is discussed in 4.
3.4
Carbon Isotope Ratio
Since there are carbon absorption bands present in the region of wavelengths between ~ 4000 - 4300
A,
carbon features have to be included in almost every synthesis. The two isotopes of carbon, 12C and13C, absorb at different but very close wavelengths. To determine the isotope ratio of carbon, a region that includes clean 1 2C and 13C
features is needed. We determined the isotope ratio by synthesizing carbon doublet at 4217A and large mixed absorption features at 4305 - 4313A. We also constrained the ratio with the abundance and doublet near the thorium line at 4019A. We varied the carbon abundance and balancing the isotope ratio at the same time, so that the synthetic spectrum matched the observed spectrum. The synthesized spectra that
best agreed with the 13C amount is 10-20%. We finally adopted a 13C/12C = 1/9,
and an abundance of log c(C) = 4.87 because it could best reproduce the lines in the thorium region.
Chapter 4
Chemical Abundances of
HE 2324-0215
4.1
Abundances of Light Elements
We measured the abundance of 15 light elements with Z < 30 using the equivalent
width method. All of these elements, except Fe from which the metallicity was derived, are outside of the immediate scope of this work. However, the abundances of these elements were used in the synthesis when obtaining abundances of neutron-capture elements and thus are needed to be measured with good precision. The abundances of these elements are shown in Table 4.1. The minimum uncertainty of
0.10 dex was adopted for elements with small numbers of measurement.
4.2
Neutron-capture Elements
We measured the abundances of 22 neutron-capture elements using the synthesis method described in 3.3. The individual measurement of each line is shown in Ta-ble A.1, where -signifies the uncertainty we adopted for each line. We calculated the total abundance for each element using weighted mean, where for each line the weight
Wi = 1.. The uncertainties for the abundances were calculated with two methods: (1) standard deviation of the weighted mean, and (2) small sample statistics. The
Table 4.1. Abundances of Light Elements
Ele AO A a N [X/H] [X/Fe] (dex) (dex) (dex) (dex) (dex)
Nal 6.24 3.55 0.10 2 -2.69 0.36 MgI 7.6 5.08 0.10 6 -2.51 0.53 Al l 6.45 2.82 0.15t 1 -3.63 -0.58 Si I 7.51 5.11 0.15t 1 -2.40 0.65 CaI 6.34 3.65 0.11 24 -2.69 0.35 Sc II 3.15 0.15 0.12 10 -3.00 0.05 Ti I 4.95 2.03 0.08 28 -2.92 0.13 Ti ll 4.95 2.20 0.09 38 -2.75 0.30 VII 3.93 1.04 0.10 4 -2.89 0.16 Cr 1 5.64 2.30 0.09 15 -3.34 -0.29 Cr 11 5.64 2.66 0.10 2 -2.98 0.06 MnI 5.43 1.79 0.10 4 -3.64 -0.59 Fe I 7.5 4.45 0.17 195 -3.05 ... Fe ll 7.5 4.47 0.12 25 -3.03 ... Co I 4.99 1.96 0.12 8 -3.03 0.01 Ni l 6.22 3.15 0.10 12 -3.07 -0.02 Zn I 4.56 1.67 0.10 2 -2.89 0.15
Note. - AG and A are log E(X) of the Sun and the
star respectively.
t
We adopted a =one measurement.
standard deviation of the weighted mean takes into account the uncertainty for each measurement but disregards the range of the data. This is given by
1 1
og = o:g = x, (4.1)
where N is the number of lines used for the calculation.
Since the maximum number of lines for all the element is only 14, the sample size is not large enough for vigorous statistics. Therefore, we utilized small sample statistics that consider the range as the unbiased estimator. This approach disregards the uncertainty of each measurement.
To be conservative, we chose the larger value of both methods. However, we notice that our calculated uncertainties are very small and may not represent the actual uncertainties due to unaccounted systematic error. Thus, we adopted the uncertainty of 0.10 dex for all elements with a lower calculated uncertainty. We report the final abundances of neutron-capture elements in Table 4.2, where we also list the uncertainties.
In summary, the [Eu/Fe] = 0.73 indicates a considerable enhancement of neutron-capture elements in HE 2324-0215. [Ba/Eu] = -0.68 suggests that this star is an r-I star (Beers & Christlieb, 2005). As shown in Figure 4-1, this star exhibits the abundance pattern common in all other r-process stars (Burris et al., 2000). The elements with 59 < Z < 70 agree very well with the scaled solar r-process abundance
pattern. The thorium abundance is below the shifted solar pattern, given that it is a radioactive element. The element can be used to calculate the age (see 5).
The observed and synthesized spectra in the regions of interesting, and difficult elements are shown in Figure 4-2. The plots show the location of the absorption line and other elements in the surrounding area that might affect the final abundance. Also shown is how the synthesized spectra vary if the abundances are changed. The variations shown in the plots are the respective uncertainties. The ranges and the scales for each axis are different for each element, depending on the relative strength of the line.
Table 4.2. Abundances of Neutron-Capture Elements
Ele AO A a U-r 9-a N [X/H] [X/Fe]
(dex) (dex) (dex) (dex) (dex) (dex) (dex) Sr II 2.87 -0.63 0.06 0.06 0.10 2 -3.50 -0.45 YII 2.21 -0.90 0.01 0.04 0.10 9 -3.11 -0.06 Zr II 2.58 -0.23 0.01 0.05 0.10 12 -2.81 0.24 RuI 1.75 -0.73 0.11 0.03 0.11 2 -2.48 0.57 Pd I 1.57 -0.85 0.20 0.20 0.20 1 -2.42 0.63 BaII 2.18 -0.82 0.02 0.04 0.10 6 -3.00 0.05 LaII 1.10 -1.70 0.01 0.03 0.10 13 -2.80 0.25 Ce ll 1.58 -1.30 0.01 0.02 0.10 9 -2.88 0.17 Pr II 0.72 -1.83 0.05 0.14 0.14 2 -2.55 0.50 Nd II 1.42 -1.25 0.01 0.03 0.10 13 -2.67 0.38 Sm II 0.96 -1.50 0.02 0.00 0.10 4 -2.46 0.59 Eu II 0.52 -1.79 0.03 0.02 0.10 2 -2.31 0.73 Gd II 1.07 -1.37 0.02 0.03 0.10 6 -2.44 0.61 TbII 0.30 -2.07 0.04 0.04 0.10 4 -2.37 0.68 Dy II 1.10 -1.12 0.01 0.03 0.10 11 -2.22 0.83 Ho II 0.48 -1.90 0.10 0.06 0.10 2 -2.38 0.67 Er II 0.92 -1.56 0.03 0.08 0.10 5 -2.48 0.57 Tm II 0.10 -2.22 0.10 0.00 0.10 2 -2.32 0.73 Yb II 0.84 -1.50 0.20 0.20 0.20 1 -2.34 0.71 OsI 1.40 -0.79 0.10 0.10 0.10 1 -2.19 0.86 Ir I 1.38 -0.90 0.15 0.15 0.15 1 -2.28 0.77 Th II 0.02 -2.41 0.05 0.05 0.10 1 -2.43 0.62
Note. - The columns are the same as in Table 4.1, except for the
uncertainties. Here, o-r, ar, and 9-a signify the weighted, range-derived
0.0 - Te Xe-Sr Z -0.5 Sn Pt RuPd Cd Ba P -1.0 Nd r bD -1.5 Sb y U -2.5 0.5 0.0 0.5 40 50 60 70 80 90 Atomic Number
Figure 4-1 The abundance of neutron-capture elements in HE 2324-0215 (red dots) and the shifted solar r-process pattern (black line). The shifting was calculated by
the averaging log c(X) - log e(X®). The deviations from the pattern are shown in
the bottom part of the figure, and the error bars are the adopted uncertainty (oJ
in Table 4.2). For the most part, the abundances agree very well with the pattern, especially for 59 < Z < 70. Large deviations are seen for well-sampled Y, Zr, Ce,
while that for Sr or Os is because of only small number of spectral lines available. Thorium is well below the pattern, suggesting an older-than-solar age.
4.2.1 Spectra Complications
As shown in Table A.1, many of the lines are clean (Flag = 0) and free of any blends with other lines. However, some of them are affected severely by many blends that need to be accounted for in the synthesis. We only report measurements of the lines that we could synthesize, by correcting each complication. We discuss each complication and its effect on the final abundance. We also assigned a flag for each complication.
Blending (Flag = 1)
When the line of interest is in the wing or near a strong absorption line, blending becomes problematic since the derived abundance will depend on the abundance of the blending line. To correct for this, accurate radial velocity adjustment is crucial
since deviations from the observed spectrum at one wing can be compensated for by adjusting the abundance on the other side. This is often degenerate with a change in radial velocity. This problem is very prominent in the low SNR region of the bluer part of the spectrum.
Low Signal-to-Noise Ratio (Flag = 2)
This is particularly problematic in the bluer region of the spectrum. This problem makes it difficult to accurately identify the continuum, and thus we assign larger uncertainty for that. Moreover, the blending problem is particularly difficult in this region, since the increased noise changes the spectral profile making the blending more difficult to assess. We rejected many lines in our initial synthesis list because of the issue of low SNR. Higher resolution spectra with higher signal-to-noise ratio are needed to correct this problem.
Incomplete Line List (Flag = 3)
For many absorption lines, there exist several absorption features nearby that can-not be accounted for by the line list and using reasonable abundances. This may be because of incorrect log(gf) values, or the missing of the line(s) entirely. We reject lines that are blended with lines that appear to be obviously missing from our line list and do not report it. For the lines that are not blended, the missing lines gen-erally only affect their outer wings. In these cases, we introduced a fake line at the wavelength where the line appears to be missing and test to ensure that the presence of the introduced line does not affect the core of the feature of interest. However, we limited the use of this technique to the minimum to ensure that we do not introduce any bias in the measurement.
4.3
Elements of Interest
The synthesis details of important neutron-capture elements are listed below, as well as rare elements with particularly difficult syntheses. For each element, we report an
average abundance along with three types of uncertainties discussed earlier.
4.3.1
Palladium
The observed palladium line is in the noisy region at 3634A. In addition to low SNR, the synthesis of this line was complicated by the presence of strong absorption lines from Fe I, Ni I, and Ti I, which resulted in the uncertainty of the continuum placement. Furthermore, the line list on the left side of the Pd feature seems to be incomplete, thus we relied on the right wing of the feature for the synthesis. The final abundance is [Pd/Fe] = 0.63 t 0.20/0.20/0.20 where we adopted a large uncertainty due to all of the complication factors.
4.3.2
Barium
Ba is an important element for characterizing an r-process star. Fortunately, it is relatively simple to measure. We measured the abundance using the blue ''35 slit spectrum at 4130A, 4554A, and 4934A and the red 0'!70 slit spectrum at 5853A, 6141A, and 6496A. For the Ba line at 4130.645A, the moderate amount of neighboring lines does not significantly affect the line abundance. However, the blending with a strong Ce line at 4130.705A complicates the synthesis, and we adopted -= 0.20 to account for that. All other Ba blue lines are strong and in very clean regions with no blending (see Figure 4-2 top-left, for example). However, the strong line causes the line strength to be less sensitive to abundance. Therefore, the uncertainty of 0.20-0.25 dex was adopted for those lines. The Ba lines in the red region are less strong and thus more sensitive to the abundance. All of these lines are in clean regions with high SNR
(~ 200 at 5853A) and no blending. These lines give better uncertainty of 0.1 dex. The final abundance is [Ba/Fe] = 0.05 t 0.02/0.04/0.10.
4.3.3
Praseodymium
We identified and synthesized two Pr lines at 4143A and 4408A, both of which are in regions with moderate neighboring proximity and medium SNR. The continuum of
the line at 4143A suffers from the presence of two strong Fe lines. This is also found in the Pr line at 4408A, where Fe and Ti lines are in close proximity (see Figure 4-2 top-right). However, the blending is modest and the resolution and SNR is high enough to synthesize these line with reasonable uncertainty of 0.1 dex. We measured
the final abundance to be [Pr/Fe] = 0.50 0.05/0.14/0.14.
4.3.4
Europium
A signature r-process element, europium is an important, but simple, element to
measure when the abundance is large enough. The abundance of Eu is also used to calculate the age by comparing it to the Th abundance (see 5). We measure the Eu abundance from lines at 4129A and 4205A, both of which are moderately strong, and are very sensitive to abundance. The lines are in relatively uncrowded regions of the spectrum and even though there are some incomplete lines nearby, they do not affect the synthesis. For example, the right wing of Eu 4219A line is next to an unaccounted absorption (see Figure 4-2). This line only affects the top part of the wing and thus has no effect on the overall line shape. The left wing of this line is close to a Dy line, and it was accounted for by using the measured Dy abundance. The 4205A Eu line is in fact a group of lines. This group is in the region where CH, CN, and C2
absorption bands are present and thus requires the C isotope ratio. These molecules affect both wings of the Eu feature but do not affect the final abundance measured from the depth of the line's core. We measured the final abundance to be [Eu/Fe]
0.73 t 0.03/0.02/0.10.
4.3.5
Terbium
We measured four Tb lines at 3509A, 3702A, 3848A, and 3874A. With low signal-to-noise ratio, the blending problem is common for these lines. Except for Tb 3848A (Figure 4-2 middle-right), we adopted the uncertainty of 0.20-0.30 dex to account for the blending issue. The 3848A line has less blending problems but the presence of an unaccounted line near the right wing complicated the synthesis. Even though the
line does not have large effect on the Tb line, we adopted the uncertainty of 0.1 dex for the abundance to account for the incomplete line list, the modest blending, and the low SNR. The final abundance for Tb is [Tb/Fe] = 0.68 0.04/0.04/0.10.
4.3.6
Osmium
We only synthesized the Os line at 4420A, since the other Os lines are badly blended with other elements with stronger absorption. This line, shown in Figure 4-2 bottom-left, shared the absorption feature with Sm and Nb. The presence of a Nb line directly at the core of the feature may complicate the synthesize. However, we tested the effect of the Nb blend by applying the Nb solar abundance (since we cannot measure Nb in this star). Varying the abundance in the synthesis by i1.0 dex shows negligible difference in the synthesis feature. Therefore, we consider Os and Sm as the main contributors to this feature.
The absorption from Os is on the left wing of the feature, while the Sm line is closer to the center, but on the right side. With an appropriate abundance of Sm obtained from averaging the abundances of all the Sm lines measured, the abundance of Os is measured by synthesizing both wings of the feature. We measured the Os abundance to be [Os/Fe] = 0.86 t 0.10/0.10/0.10. We note that this measurement is very sensitive to the radial velocity correction, so other lines in the region were fitted to make sure that the velocity is correct. The presence of Sm and velocity correction result in large, conservative uncertainty of 0.1 dex.
4.3.7
Iridium
The Ir line at 3800A is in the blue, noisy region of the spectrum. The close proximity to strong Fe and Ti absorption lines add to the complexity of the synthesis. Even though there is no blended line at the Ir wavelength, our line list cannot account for a small absorption feature near both wings of the Ir line, and thus the wing profiles were not matched. Therefore, in order to measure the abundance correctly for Ir, we had to add two fake absorption lines just outside the Ir region near both wings to reproduce
the wings' profile. Adding these lines had a small effect on the Ir abundance, and we account for this by adopting large uncertainty of 0.15 dex.
4.3.8
Thorium
The abundance of Th is important for calculating the age (see 5). For this star, we have only one measurable Th line at 4019A, due to blending and other effects on other Th lines. This line also suffers from blending and a somewhat incomplete line list, but it was sufficiently clean to be able to derive a meaningful abundance. The right wing of the Th absorption is distorted by the presence of Co I. Whereas the abundance of Co was easily adjusted, the small peak between Th and Co (see Figure 4-2 bottom-right) could not be accounted for. We suspect that this may be because of incomplete line list, but this should not affect the derived abundance from the Th line further away to the left. The left wing of the feature is crowded with Ni, Ce, Fe, and CH absorption. Since they are quite far away from Th, we only had to adjust those abundance to make the wing fit. Since, this is quite sensitive to radial velocity, we tested this effect by changing the radial velocity and try to synthesize again. We found that the shape of the feature could not be reproduced without changing the nearby elements' abundance significantly from the EW-derived values. Additional absorption features at 4019.4-4019.6A also helped to constrain the continuum adjustment. Even though the synthesis uncertainty is +0.05, we adopted oa = 0.10 for the fact that 2 out of 3 complexities discussed in 4.2.1 are present in
I I 1 1 7 - -Sm! Ti 1 Nd 11 1.0 - Ba II Fe 11 0.8 0.6 0.4-0.2 - loge(Ba) = -1.25, -1,00, -0.75 4554.0 4554.5 4555.0 4555.5 4556.0 Wavelength (A) Dy 11 Eu II Tg E(Eu) 1.83, -l.78, -- 1.73 4129.4 4129.6 4129.8 4130.0 Wavelength (A) 1.18Th OsI 1 Sm11 Sc! Sm!! 0.951. 0.90- log e(Os) - -0.89, -0.79. -0.6T-4420.4 4420.6 4420.8 4421.0 Wavelength (A) 0.9 0.8--log E (Pr) = 2.05, -1.95, -1.85 7' D 6.8. 0.95 0.90 0.85 4408.5 4409.0 4409.5 Wavelength (A) Tb II Nd!1 Nd 11 La rr Fe! Cell1 log E(Tb) - -2.20. -2.10, -2.00 18.0 3848.2 3848.4 384S,6 3848.6 3849.0 Wavelength (A) Ce 11 1.00 NiI Nd 11 Pr 11 F Fe I Th I 0.95 0.90 4018.8 4(19.0 4019.2A Wavelength (A) 4019.4
Figure 4-2 Examples of the synthesis of neutron-capture elements. Top(left): Ba at 4554A. This strong line shows that the abundance sensitivity is lower increase line
strength. We had to adopted A log e(Ba) = 0.25 to make the difference in the
synthetic spectra visible. Top(right): Pr at 4408A. This synthesis is influenced by strong absorption of Fe I and Ti II on either side. Middle(left): Eu at 4129A. The absorption feature near the right wing is not in the line list, but it is very unlikely to affect the Eu abundance given its small size. Middle(right): Tb at 3848A. Being in the noisy region, this line is affected by strong absorption, uncertainty in radial velocity and continuum, and incomplete line list. Still, a reasonable fit is achieved. Bottom(left): Os at 4420A. This line shares very strong absorption with Sm and thus depends very strongly on the radial velocity. An absorption near Sc is unaccounted for but it should not affect the final abundance. Bottom(right): Th at 4019A. The absorption feature is largely dominated by Th, C, and Fe. Co and Pr abundance, while important for fitting the wings, are not important in this case.
1.0
0.6
Chapter 5
Cosmochronology using Thorium
Since thorium is a radioactive element, the detection of Th in this star allowed us to determine the age of the star, given an initial abundance as produced by the r-process. These initial yields can be calculated because all elements follow the uni-versal r-process pattern (see Figure 4-1). Ages can then be derived by comparing the radioactive element to a stable r-process element such as Eu, and compared to the initial production ratio. With the measurement of Th at 4019A, we calculated the age of HE 2324-0215 using the approach and initial abundance described by Schatz et al. (2002). The age of the star is given by
t* = 46.7 x [log(Th/X)o - log(Th/X)*] Gyr, (5.1)
where log(Th/X) = log e(Th) - log c(X). We identified 9 neutron-capture elements
for X and calculated the age from the mean abundances and the adopted uncertainty for those elements. The result is shown in Table 5.1. The age calculated using the ratio of Th and Eu is highlighted.
We used the age and the uncertainty o-a from each element to calculate the average age. Following the same method as described in 4.2, we calculated the weighted average of the age to be 13.0 1.0 Gyr.
Table 5.1. Thorium-derived Age
Ele Ro ARo R* t* O-, Ur Ua
(dex) (dex) (dex) (Gyr) (Gyr) (Gyr) (Gyr)
Ce -0.79 0.13 -1.11 14.9 6.5 6.6 9.0 Pr -0.30 0.12 -0.58 12.8 6.5 9.1 9.9 Nd -0.91 0.12 -1.16 11.7 6.1 6.2 8.7 Sm -0.61 0.12 -0.91 14.2 6.1 6.1 8.7 Eu -0.33 0.12 -0.62 13.3 6.2 6.1 8.7 Gd -0.81 0.12 -1.04 10.8 6.1 6.3 8.7 Tb -0.12 0.12 -0.34 10.4 6.4 6.3 8.7 Tm 0.12 0.12 -0.19 14.5 7.7 6.1 8.7 Ir -1.18 0.12 -1.51 15.4 9.3 9.3 10.1
Note. - Ratio R = log(Th/X). The uncertainties are based
Chapter 6
Summary & Discussion
Using high-resolution spectroscopy, we were able to measure the abundances of 22 neutron-capture elements of metal-poor star HE 2324-0215 using the synthesis method. We utilized the EW method to measure the stellar parameters and the abundances of 14 light elements. The cool effective temperature of 4477 K and the low surface gravity of log(g) = 0.70 indicate that this star is a red giant. With the metallicity
of [Fe/H] = -3.05 0.17, this star is classified as an Extremely Metal-Poor (EMP)
star. The relative abundance of europium and barium of [Ba/Eu] = -0.68 suggests
that this star is an r-process-enhanced star, confirming our initial selection from the Hamburg/ESO survey (Frebel et al., 2006). The europium abundance of [Eu/Fe]
0.73 places this star into the r-I group (Beers & Christlieb, 2005).
The r-process pattern of this star agrees very well with the scaled solar r-process pattern, especially for the heavier elements with higher atomic number (i.e., above Ba), suggesting that HE 2324-0215 also displays the universality of the r- process pat-tern. We note that there are discrepancies between the abundance of a few elements and the r-process pattern, which may suggest the contamination from other nucle-osynthesis processes. This has already been suggested for the light neutron-capture elements (e.g. Sr, Y, Zr) by Travaglio et al. (2004). However, further investigation is required for the full analysis.
Using the abundance of thorium and nine other neutron-capture elements, we calculated the average age of this star to be 13.0 t 1.0 Gyr. Given the Universe's age
of 13.80 0.02 Gyr (Planck Collaboration et al., 2015), this star is very old, which confirms expectations given the low metallicity of HE 2324-0215. With this age, the star likely formed when the Milky Way just started its formation process. Since
HE 2324-0215 is in the halo of the Galaxy, it further suggests that this star might
in fact formed in a dwarf galaxy that experienced a massive r-process event such as a neutron star merger and which was later incorporated into the Milky Way. This suggestion agrees with the discovery of several metal-poor strongly r-process enhanced stars in a dwarf galaxy by Ji et al. (2016). If halo r-process enhanced stars reflect the population of r-process dwarf galaxies then more of these stars should be studied because they provide an opportunity to better understand r-process nucleosynthesis and the r-process site (e.g. neutron star mergers or supernovae) in the early universe.
Appendix A
The Measurement of Individual
Synthesized Line
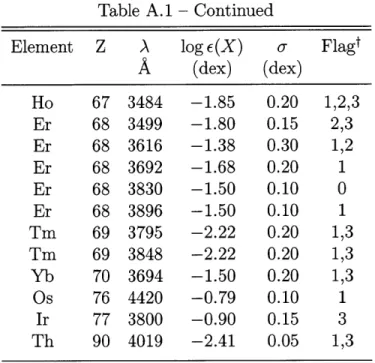
Table A.1: Measured Abundances of Individual Line
Element Z A log E(X) u Flagt
A (dex) (dex) Sr 38 4077 -0.55 0.20 0 Sr 38 4215 -0.65 0.10 0 Y 39 3549 -0.75 0.30 2,3 Y 39 3600 -0.65 0.30 2,3 Y 39 3774 -0.90 0.15 3 Y 39 3950 -0.90 0.10 0 Y 39 4398 -0.87 0.10 0 Y 39 4682 -0.89 0.10 0 Y 39 4883 -0.91 0.08 0 Y 39 4900 -1.05 0.10 3 Y 39 5087 -0.83 0.10 0 Zr 40 3457 -0.10 0.20 2 Zr 40 3479 -0.60 0.15 2 Zr 40 3505 -0.37 0.20 2 Zr 40 3551 -0.30 0.20 1,2,3 Zr 40 3573 -0.30 0.20 1,2,3 Zr 40 3836 -0.27 0.15 1,3 Zr 40 3998 -0.20 0.10 0 Zr 40 4050 -0.15 0.15 3
Table A.1 - Continued
Element Z A log E(X) - Flagt
A
(dex) (dex) Zr Zr Zr Zr Ru Ru Pd Ba Ba Ba Ba Ba Ba La La La La La La La La La La La La La Ce Ce Ce Ce Ce Ce Ce Ce Ce Pr Pr Nd Nd 4161 4149 4208 4317 3728 3798 3634 4130 4554 4934 5853 6141 6496 3794 3849 3949 3988 3995 4077 4086 4123 4196 4322 4333 4429 4921 3942 3999 4053 4073 4083 4137 4222 4562 4628 4143 4408 3784 3838 -0.25 -0.35 -0.20 0.00 -0.75 -0.70 -0.85 -0.90 -1.00 -0.97 -0.75 -0.83 -0.78 -1.85 -1.80 -1.87 -1.80 -1.80 -1.75 -1.79 -1.83 -1.80 -1.65 -1.55 -1.60 -1.59 -1.30 -1.45 -1.23 -1.35 -1.30 -1.25 -1.35 -1.25 -1.25 -1.72 -1.95 -1.30 -1.43 0.10 0.10 0.10 0.10 0.20 0.25 0.20 0.20 0.25 0.20 0.10 0.10 0.10 0.10 0.10 0.07 0.10 0.10 0.10 0.10 0.10 0.10 0.15 0.05 0.10 0.05 0.30 0.10 0.10 0.10 0.10 0.10 0.05 0.05 0.10 0.10 0.10 0.10 0.10. Table A.1 - continued 0 0 0 0 1,2 1,2 1,2,3 1 0 0 0 0 0 1 2,3 0 0 0 1 0 0 1 1 0 0 0 3 0 3 0 0 0 0 0 0 0 0 3 3
Table A.1 - Continued
Element Z A log E(X) - Flagt
A
(dex) (dex) Nd Nd Nd Nd Nd Nd Nd Nd Nd Nd Nd Sm Sm Sm Sm Eu Eu Gd Gd Gd Gd Gd Gd Tb Tb Tb Tb Dy Dy Dy Dy Dy Dy Dy Dy Dy Dy Dy Ho 60 60 60 60 60 60 60 60 60 60 60 62 62 62 62 63 63 64 64 64 64 64 64 65 65 65 65 66 66 66 66 66 66 66 66 66 66 66 67 3991 4012 4021 4023 4061 4109 4109 4135 4385 4462 4706 4318 4434 4467 4519 4129 4205 3768 3796 4085 4130 4215 4251 3509 3702 3848 3874 3454 3460 3534 3538 3563 3944 4050 4073 4077 4103 4449 3456 -1.35 -1.20 -1.37 -1.20 -1.33 -1.28 -1.10 -1.30 -1.25 -1.18 -1.14 -1.50 -1.48 -1.50 -1.50 -1.78 -1.81 -1.42 -1.25 -1.38 -1.45 -1.45 -1.35 -2.10 -1.95 -2.10 -2.00 -1.10 -1.30 -1.30 -1.00 -1.00 -1.15 -1.14 -1.23 -1.18 -1.05 -1.00 -1.95 0.10 0.20 0.10 0.15 0.05 0.05 0.10 0.15 0.10 0.05 0.05 0.10 0.10 0.05 0.15 0.05 0.05 0.10 0.10 0.15 0.15 0.15 0.15 0.30 0.20 0.10 0.30 0.30 0.30 0.30 0.30 0.30 0.10 0.20 0.10 0.15 0.10 0.10 0.20Table A.1 - continued 0 1 0 3 0 0 0 1 0 0 0 0 0 0 0 0 0 2 3 0 1 0 0 1,2 1,2 2 1,2 1,2,3 1,2,3 1,2,3 2,3 1,2,3 0 1 0 1 0 0 1,2,3
Table A.1 - Continued
Element Z A log E(X) - Flagt
A
(dex) (dex) Ho 67 3484 -1.85 0.20 1,2,3 Er 68 3499 -1.80 0.15 2,3 Er 68 3616 -1.38 0.30 1,2 Er 68 3692 -1.68 0.20 1 Er 68 3830 -1.50 0.10 0 Er 68 3896 -1.50 0.10 1 Tm 69 3795 -2.22 0.20 1,3 Tm 69 3848 -2.22 0.20 1,3 Yb 70 3694 -1.50 0.20 1,3 Os 76 4420 -0.79 0.10 1 Ir 77 3800 -0.90 0.15 3 Th 90 4019 -2.41 0.05 1,3Bibliography
Arnould, M., Goriely, S., & Takahashi, K. 2007, Phys. Rep., 450, 97
Asplund, M., Grevesse, N., Sauval, A. J., & Scott, P. 2009, ARA&A, 47, 481 Barklem, P. S., Christlieb, N., Beers, T. C., et al. 2005, A&A, 439, 129 Beers, T. C., & Christlieb, N. 2005, ARA&A, 43, 531
Bernstein, R., Shectman, S. A., Gunnels, S. M., Mochnacki, S., & Athey, A. E. 2003, in Proc. SPIE, Vol. 4841, Instrument Design and Performance for Optical/Infrared Ground-based Telescopes, ed. M. lye & A. F. M. Moorwood, 1694-1704
Bromm, V., & Larson, R. B. 2004, ARA&A, 42, 79
Burris, D. L., Pilachowski, C. A., Armandroff, T. E., et al. 2000, ApJ, 544, 302 Casey, A. R. 2014, PhD thesis, Australian National University. Research School of
Astronomy & Astrophysics
Castelli, F., & Kurucz, R. L. 2004, ArXiv Astrophysics e-prints, astro-ph/0405087 Christlieb, N., Beers, T. C., Barklem, P. S., et al. 2004, A&A, 428, 1027
Frebel, A., Casey, A. R., Jacobson, H. R., & Yu,
Q.
2013, ApJ, 769, 57Frebel, A., & Norris, J. E. 2015, ARA&A, 53, 631
Frebel, A., Yu,
Q.,
& Jacobson, H. R. 2016, Journal of Physics Conference Series, 665, 012051Frebel, A., Christlieb, N., Norris, J. E., et al. 2006, ApJ, 652, 1585 Ji, A. P., Frebel, A., Chiti, A., & Simon, J. D. 2016, Nature, 531, 610 Kelson, D. D. 2003, PASP, 115, 688
Lattimer, J. M., & Schramm, D. N. 1976, ApJ, 210, 549
Meyer, B. S., Mathews, G. J., Howard, W. M., Woosley, S. E., & Hoffman, R. D.
Planck Collaboration, Ade, P. A. R., Aghanim, N., et al. 2015, ArXiv e-prints, arXiv: 1502.01589
Roederer, I. U., Sneden, C., Thompson, I. B., Preston, G. W., & Shectman, S. A.
2010, ApJ, 711, 573
Schatz, H., Toenjes, R., Pfeiffer, B., et al. 2002, ApJ, 579, 626 Siqueira Mello, C., Hill, V., Barbuy, B., et al. 2014, A&A, 565, A93 Sneden, C., Cowan, J. J., & Gallino, R. 2008, ARA&A, 46, 241 Travaglio, C., Gallino, R., Arnone, E., et al. 2004, ApJ, 601, 864