-1-A CHOICE SYSTEM
FOR ENVIRONMENTAL DESIGN AND DEVELOPMENT by
John P. Boorn
A.B., Princeton University (1961)
B. Arch., Massachusetts Institute of Technology (1964)
M.C.P., University of California, Berkeley (1966)
Submitted in partial fulfillment of the requirements for the
degree of Doctor of Philosophy in City and Regional Planning
at the
Massachusetts Institute of Technology January, 1969
Signature of Author... ... r...
.-Department o ityland RegionalPlanning, January 13, 1969 Certified by...
Thesis Supervisor Accepted by - -- -- - -. - - - -- -.--- .-- - - -- -
-Chairman, Departmental Committee on Graduate Students
Archives
ss.
INST.rc,
JUN
20
1969
-IBRARIES V, r".
-2-ABSTRACT
A Choice System for Environmental Design and Development John P. Boorn
Submitted to the Department of City and Regional Planning on January 13, 1969 in partial fulfillment of the requirement for the degree of Doctor of Philosophy in City and Regional Planning.
This research has been directed towards the development of a
computer-aided evaluation system for use in environmental planning and design. The system is called CHOICE.
An introduction to utility and social welfare theory as well as an understanding of the nature of environmental design problems provides the basis for representing choice. Measurement models of design and evaluation are suggested as the formal construct on which the system is based.
CHOICE may be thought of as an urban accounting system which permits the planner to rapidly compare and analyze proposed actions and objectives. The planner may perform complex cost/benefit analysis with respect to more than one group or individual. He may check
alternative programs for fulfillment of absolute criteria and test alternative objectives for conflicting spenification.
CHOICE is implemented on M.I.T.'s CTSS time-sharing computer system. This allows the planner to have a flexible method for specifying alternative evaluation schemes. He may define each evaluation
account, the relative preferences and absolute goals associated with each evaluation, and the parameters on which evaluations are to be performed.
The consequences to be evaluated may be directly specified by the planner or accessed from other simulation or design models. The planner may input these consequences in either an ordinal or car-dinal form, thus allowing him to represent judgments as well as measured parameters. He may combine cardinal and ordinal represen-tations to obtain a variety of measurement scales. The use of multiple accounts allows the planner to represent time-series
out-comes. Operations for computing cumulative totals, rates of change, and discounted present value are available. Operations also permit statistics of mean and standard deviation to be performed. The
-I
-3-planner may employ matrix and arithmetic operations such as weighted sum, difference, total, and number of occurrences. Expected values can be computed by specifying probability of an event's occurrences. CHOICE permits the planner to define and test alternative benefit, cost, effectiveness, or utility functions. He may design social welfare functions and voting schemes. The flexibility of the system permits the planner to rapidly alter evaluation arguments such as weighting assumptions, probabilities, interest rates, and
defini-tions of the accounts.
Experiments in the use of alternative choice rules provide a demonstration of different types of evaluation schemes.
Thesis Supervisors: Kevin A. Lynch
Professor of City and Regional Planning Aaron Fleisher
-I
TABLE OF CONTENTS
ABSTRACT
ACKNOWLEDGEMENTS
CHAPTER 1. INTRODUCTION
1.1 Purposes and Outline of Research 1.2 Design Evaluation and Choice CHAPTIER 2. UTILITY AND SOCIAL WELFARE THEORY
2.1 Interpretations 2.2 Optimal Choice
2.3 Welfare Analysis and CHOICE CHAPTER
3.
MEASUREMENT3.1 Definition 3.2 Types of Scales
3.3 Kinds of Measurement Functions 3.4 Measurement and the CHOICE System CHAPTER 4. A MEASUREMENT MODEL OF DESIGN
4.1 The Dimensions of Design
4.2 Design as Dimensional Transformation and Value Specification 4.3 Two Dimensional Representations: Parametric and Metric Forms 4.4 Parametric Form
4.5 The Metric Form
4.6 Operations on Elements 4.7 Operations on Parameters
4.8 Parameters of Including Elements CHAPTER 5. CONSEQUENCES OVER TIME
5.1 Dynamics of Design 5.2 Uncertainty and Time
5.3 Derived Parameters for Streams of Design States CHAPTER 6. A MEASUREMENT MODEL OF EVALUATION AND CHOICE
6.1 Goals and Constraints 6.2 Absolute Comparison 6.3 Relative Comparison 6.4 Implied Preference
6.5 Goal Relationships as Derived Measurement 6.6 Special Cases of Derived Measurement
-I
-5-CHAPTER
7.
EVALUATORS AND ACCOUNTING FOR CHOICE7.1 Evaluators
7.2 Conflicts of Goals
7.3
Partial and Complete7.4
Accounting for ChoiceCHAPTER 8. CHOICE - A COMPUTER-AIDED EVALUATION SYSTEM 8.1 Overview of the System
8.2 Data Bases for Evaluation
8.3 Creation of Accounts 8.4 Comparison 8.5 Derived Parameters 8.6 Ordering 8.7 Ordinal Input 8.8 Ordinal Operations 8.9 Goal Files
8.10 Summary of CHOICE Commands CHAPTER 9. EXPERIMENT IN SCORING
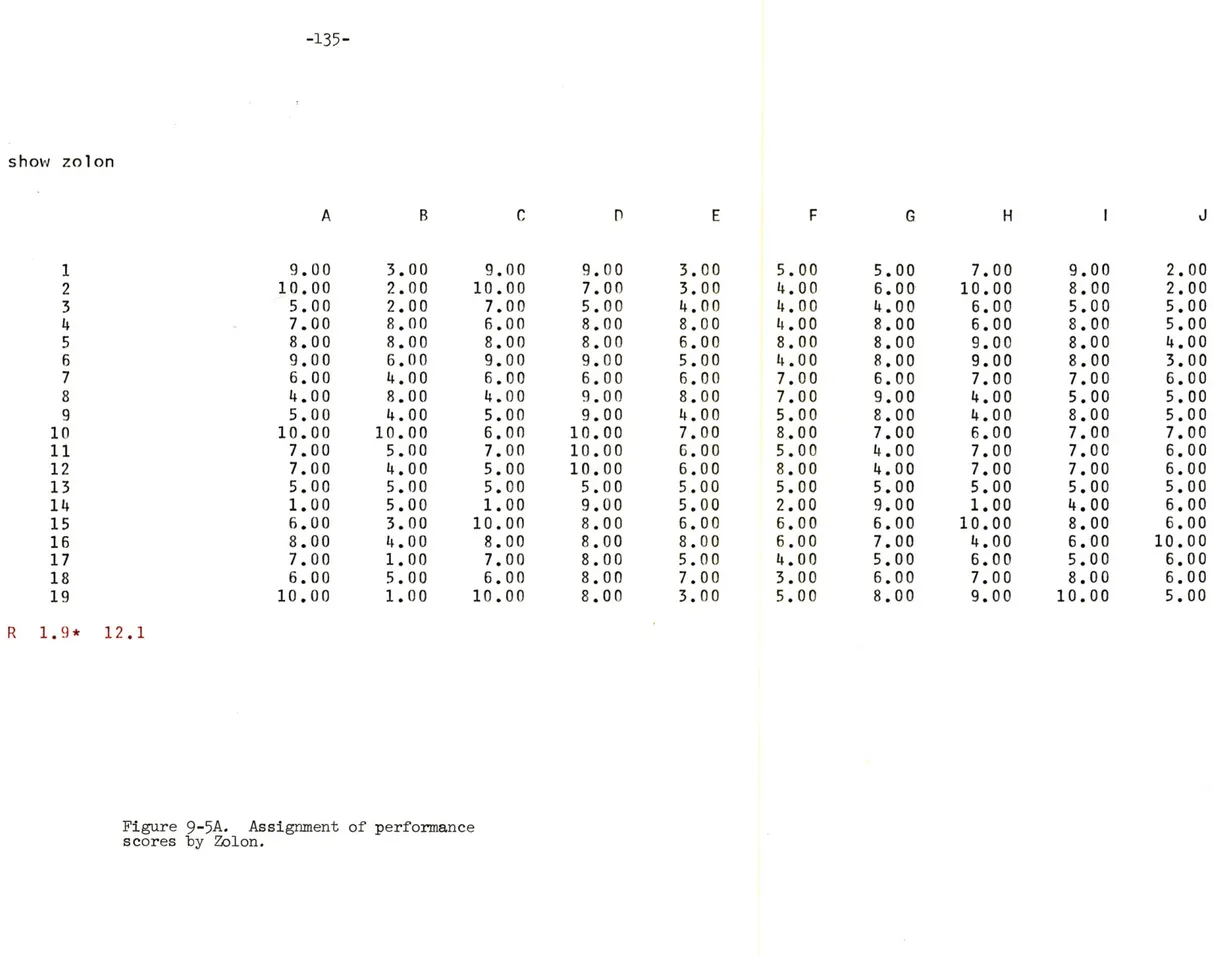
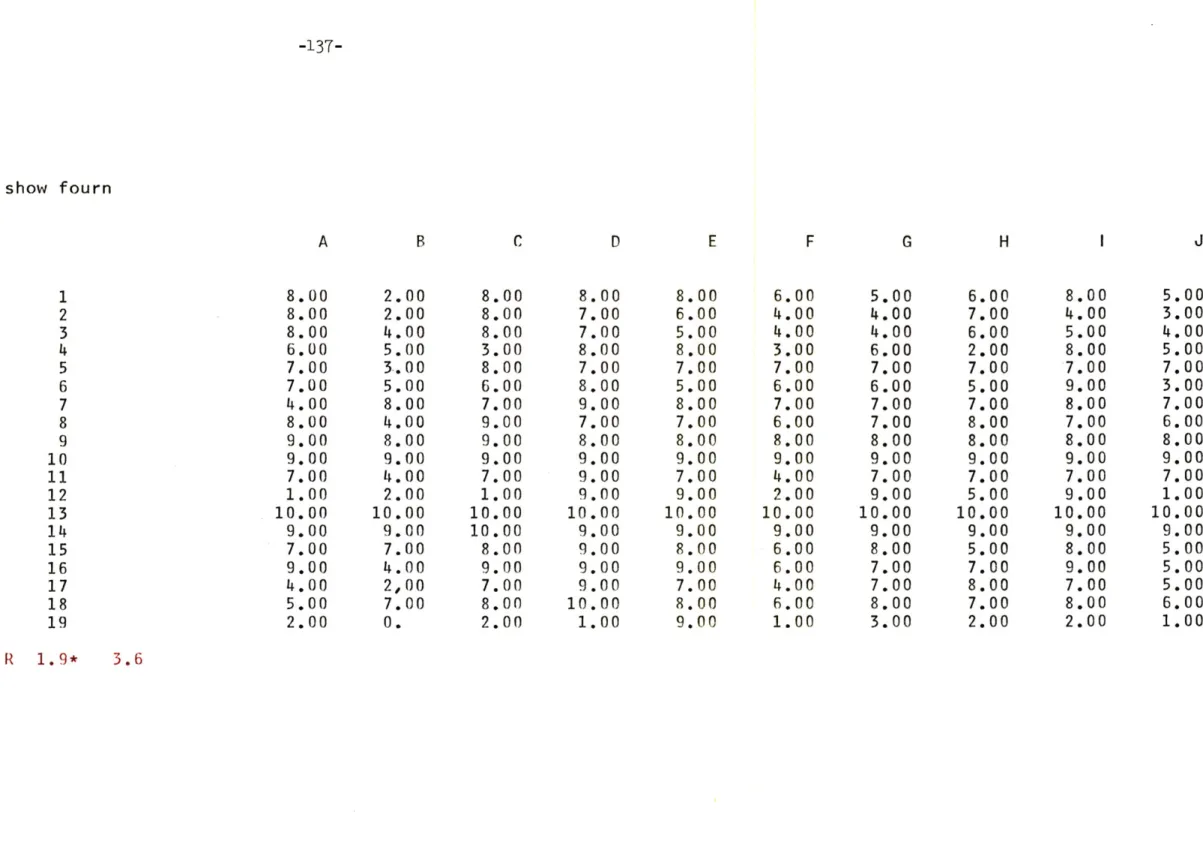
9.1 Scores
9.2 Performance Measurement
9.3 Relative Value
9.4 Parameters for Evaluation 9.5 Prior Scores
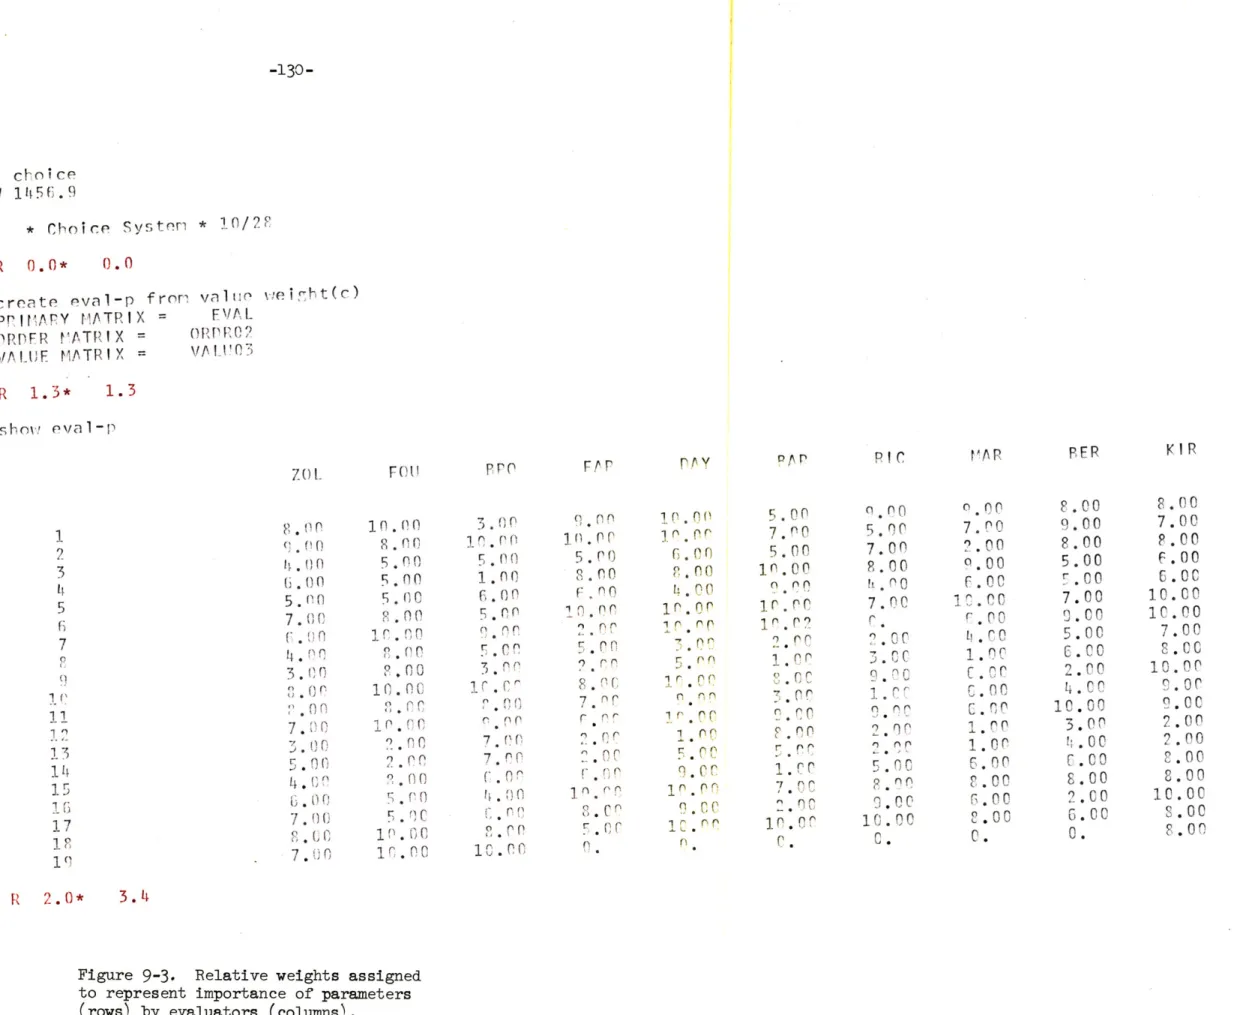
9.6 Relative Weights
9.7 Parameter Scores by Evaluators 9.8 Three Rules of Choice
9.9 Choice Rankings by Evaluators
9.10 Comparison of Disagreement Among Evaluators and Choice Rules 9.11 Results
CHAPTER 10. CONCLUSIONS AND EXTENSIONS 10.1 CHOICE
10.2 Extensions of CHOICE
10.3 Conflict and Resolution of Goals
10.4 Management of Design and Development: A Second Level of Choice
BIBLIOGRAPHY BIOGRAPHICAL NOTE
qi
-6-ACKNOWLEDGEMENTS
The author wishes to express his gratitude to the many sources of assistance during the development of the CHOICE system. Funding for the author and his family was provided by the United States Department of Health, Education, and Welfare in the form of a
National Defense Educational Act doctoral fellowship. The generous resources of the Department of City Planning provided by
Professor John T. Howard, and funds from the Urban Systems Labora-tory are also gratefully acknowledged.
In addition to financial support, the author wishes to express his thanks to Professors Kevin A. Lynch and Aaron Fleisher for their supervision, guidance, and academic support. To a colleague in research, Assistant Professor William L. Porter, goes a special note of thanks for the critical and supportive discussions, as well as his efforts through the development of DISCOURSE. Appreciation is also extended to Richard Bertman and his class at the Boston Architectural Center for their participation in this work. General systems programming was supplied by Wren McMains and Kathy Lloyd and specifically for CHOICE by Stanley L. Hoderowski and Cornelia D. Menger. Their patient work and expertise made the system operational.
Much appreciation is extended to Megan Whiting for her careful and industrious work in typing this manuscript.
Throughout the time spent on this research, the most constant source of hope and encouragement has been my wife, Mary Ann. To her goes my most affectionate gratitude and thanks.
-7-CHAPTER 1. INTRODUCTION
1.1 Purposes and Outline of Research
The purpose of this research is to identify some basic operations of evaluation and choice which can represent part of the decision-making process of environmental planning and design. Such an identification provides the basis to develop a computer-aided system for performing these operations rapidly, precisely, and consistently.
Problems of environmental planning and design are characterized by many criteria for evaluation and choice. Often these criteria are non-economic, lying outside the private marketplace for determining effi-ciency of resource allocations. Public decision-making assumes the additional burden of equity or distribution of consequences as well as efficiency or total level of results. In general, many groups and individuals are concerned about the consequences of implementing a proposed set of actions. Each evaluator seeks to bring its own set of objectives, aspirations, and needs to bear on the problem.
This research seeks to provide a structure for representing such multiple evaluation and choice criteria. No specific procedure or
criterion shall be championed. Rather, the objective is to generalize a common set of operations from alternative evaluation schemes in order to construct a computer-aided system which allows different choices to be derived.
-I
-8-The introductory section of this research outlines the various positions held by different proponents of evaluation schemes. It shall be argued that the problem of stating rational choice has been conceptually
solved, but the provision for a generalized framework for choices which do not satisfy its conditions has not been stated. In addition to the remarks about rigorous evaluation and choice, the introduction shall include a summary of the types of measurement scales and kinds of measurement operations. These form the basis for the computer-aided system of evaluation and choice.
The second section of this research deals with representing a planning or design project for evaluation and choice. A "measurement model of design" shall be suggested. This model is extended to represent the project over time and under uncertainty.
The third section describes a "measurement model of evaluation and choice." Operations of evaluation and accounts for making choices are defined and related to the design model. The explicit framework for deriving choice criteria is defined.
The next section presents the computer-aided evaluation system called CHOICE. This system provides a data structure and set of commands which allows a planner to define criteria, measure and compare alter-native proposals, and generate consequences of choice by specifying different preference orderings. CHOICE permits one to design the
-9-evaluation scheme and learn about consequences of choice which the model produces. The system is introduced by illustrating different evaluation schemes and operations. Finally, an experiment using the system to generate different choices is presented.
The last section points to additional uses of CHOICE as a planning management tool for use in program budgeting and control. The experiences of using the system are noted for areas in which CHOICE
can be extended and improved in terms of new or easier operations.
1.2 Design Evaluation and Choice
Bross,1 in his discussion of decision-making, entitles a section, "The Problem of Choice: Alternative Futures and Conflicting Values." Alter-native futures are represented as the different possible results which one may expect from an implemented set of actions. Conflicting values indicate the limited resources and the various objectives and needs of different evaluators.
There are three components to Bross' decision model: a prediction system.for projecting, estimating or predicting future results from proposed actions; a value system for determining the desirability of
1lIrwin D. Bross, Design for Decision, Free Press, New York, 1953, p. vii.
-10-predicted outcomes; and a choice rule for selecting among the different desirabilities of alternative outcomes.
Manheim groups these components of prediction, evaluation, and choice into the problem-solving activity of "selection." He couples selection to a second set of operations called "search." Search represents the specification of alternative actions.
To Bross' scheme for describing the problem of choice, one must add the condition of alternative sets of proposed actions, each one of which may precipitate an uncertain set of possible futures.
Such a scheme of proposing alternative actions, predicting distributions of possible consequences from each action, evaluating these consequences, and choosing the preferred action-consequence combination is very familiar
3
to the literature of decision theory. Much criticism exists regarding the irrelevance of such a structured decision-making approach in the
2W
Marvin L. Manheim, "Problem-solving Processes in Planning and
Design," Technical Paper P-67-3, Department of Civil Engineering, M.I.T., January, 1967.
3As a reference to this model applied to planning, see Paul Davidoff and Thomas A. Reiner, "A Choice Theory of Planning," Journal of the American Institute of Planners, Vol. XXVII, No. 1, February, 1962, pp. 103-115. For extensive references to decision theory, see
John W. Dyckman, "Planning and Decision Theory," Journal of the American Institute of Planners, Vol. XXVI, No. 4., November, 1961, pp. 333-345.
-11-pragmatic world of actual choice. Braybrooke and Lindblom call the formal approach "synoptic" and criticize its requirements for inadap-tability in a changing problem setting and its severe informational requirements from which choices are derived. They argue that incre-mental choices, remedial and serial in nature, are more appropriate in actual planning situations.
In a sense, the dichotomy between synoptic and incremental approaches is the same raised by Ackoff's definition of evaluative and develop-mental research.5 An evaluative problem is one in which the alternative courses of action are completely specified in advance and the solution consists of selecting the "best" of these. A developmental problem, on the other hand, involves searching for (and perhaps construction or synthesis of) instruments which yield a course of action that is better than any available at the time.
This dichotomy may seem strained to anyone with planning and design experience. One would assume that many choices take place throughout the developmental process of suggesting and selecting actions to be
4 D. Braybrooke and C. W. Lindblom, A Strategy for Decision, Free Press, New York, 1963.
5Russell L. Ackoff, Scientific Method: Optimizing Applied Research Decisions, John Wiley and Sons, Inc., New York, 1962, p. 24.
-12-implemented. However, choice by definition only occurs when alternatives are available from which to choose. The CHOICE system presented in this research is evaluative in nature, dealing with a set of existing alternatives from which to choose. The system, however, is structured in such a way to be available for use whenever choices must be made during the developmental process of planning and design. Consequences of selection for a given set of alternatives and evaluation schemes can be used as new information in an ongoing decision process. CHOICE is
viewed as but one set of operations available in an unspecified process of determining appropriate future actions.
-13-CHAPTER 2. UTILITY AND SOCIAL WELFARE THEORY
2.1 Interpretations
Theories of utility and social welfare deal with people's choices and judgments of preference. The literature pertaining to this concern is extensive,1 but generally can be discussed in either prescriptive (normative) or predictive (behavioral) interpretations. The prescrip-tive theory emphasizes how choices ought to be made based on a set of consistent assumptions for computing preferences.
The primary purpose of prescriptive utility theory is in helping a decision-maker explicitly identify preferences. The prescriptive structure can help one to learn about his preferences among complex alternatives. The effect of most assumptions in prescriptive utility theory is to give order and structure to an individual's preference. His initial preference statements are transformed into corresponding numerical data which is manipulated to derive numerical utility compari-sons between actual alternatives. One must assume the comparison of
complex alternatives in terms of preferences. This does not mean such comparisons are easy to make. It does imply, however, that such opera-tions are helpful in discovering preferences between alternatives which are difficult to compare.
1
For a complete review, see Peter C. Fishburn, "Utility Theory," Management Science, Vol. 14, No. 5, January, 1968, pp. 335-378. In this article, Fishburn cites 315 references to utility theory. The above
If, as Fishburn suggests, a utility theory consists of a set of assumptions about the available courses of action and preference statements assigned to properties of these actions, then such familiar evaluation schemes as
cost-benefit analysis and statistical decision theory are forms of a
utility theory. Both provide a set of consistent assumptions and preference rules for selecting preferred actions. The range of arguments surrounding the construction of choice rules leads one to believe no claims for the set of rules to be used for evaluation.
2.2 Optimal Choice
The classical prescriptive for choice based on a single criterion is well documented.3 The formal theory of the finn is based on profit
maximi-zation which occurs when marginal revenue equals marginal costs. Mathe-matical derivation of this argument indicates that a firm should utilize each resource input to a point where the value of its marginal producti-vity equals its price. Similarly, the basic postulate of consumer theory is that he maximizes utility. With limited income, the consumer maximizes utility subject to a budget constraint. Mathematically, the ratio of the marginal utilities of each commodity consumed must be equal to the price
2
For a collection of writings on various theories and assumptions on which they are based, see Utility Theory: A Book of Readings, edited by Alfred N. Page, John Wiley and Sons, Inc., New York, 1966.
3A comprehensive mathematical development of consumer behavior and the firm is available by James M. Henderson and R. E. Quandt, Microeconomic Theory, McGraw-Hill, New York, 1958, Chapters 1 and 2.
-15-ratio of the commodities. Analogous arguments for optimal level public expenditures are developed for the maximization of net benefits, a form of social profit. When both the level and distribution of net benefits is of concern, the optimal conditions are met when the marginal contribu-tion of relaxing each budget constraint is equal. Such a cursory
treatment is given to the formal development of utility because the con-ceptual problem has been solved as indicated by the references and the mathematical conditions necessary for their relevant application are so severe.
2.3 Welfare Analysis and CHOICE
Rothenberg identifies the following elements in a structure of welfare analysis:5
(1.) The subjects referred to by the analysis
(i.e., the individuals or groups whose welfare is of concern).
(2.) The set of assertions, E, defining the welfare ends or goals.
4 Robert Dorfman, "Basic Economic and Technological Concepts: A
General Statement," in Design of Water-Resource Systems, Arthur Maass, et al, Harvard University Press, 1966, pp. 88-158. Also see Chapters 2 and 4,
Stephen A. Marglin, for optimal conditions for budget constrained project design.
5
Jerome Rothenberg, The Measurement of Social Welfare, Prentice-Hall, Englewood Cliffs, New Jersey, 1961, pp. 6-7.
-16-(3.) The particular set of alternative policies, P, whose ordering is the basis for choice. (4.) The set of consequence states, S, deriving
from policies, P.
(5.) The laws, L, relating the derivation of S from P.
(6.) The criterion, C, by which the consequence states are ordered in terms of the degree to which they fulfill the welfare ends, E.
He suggests that a particular policy is chosen if the set of welfare ends, E, and the criterion for choice, C, are accepted by the decision-maker. The ends and criterion for choice are not absolute truths. Ends are definitions; choice criteria are rules. They cannot be proved or disproved by observation. Both the welfare ends and criterion for choice are value judgments. Welfare analysis, therefore, consists of generating the choice implications from the value judgments of ends and criteria for describing how well different alternatives fulfill these ends.
The approach taken in developing the CHOICE system is one of devising a structure for operating on the value judgments of ends and criteria. The facility allows one to explicitly state the preferences, measurements, and utility or welfare functions in order to generate a prescriptive
choice. The system does not contain a behavioral or predictive capability. It could, however, be viewed as a logical equivalent to a behavioral pro-cess of choice. In that respect, the CHOICE SYSTEM can be used to
-17-construct a set of definitions and rules which allows an explicit representation of making a choice. This representation may assist the decision-maker in his understanding of the choice problem.
-18-CHAPTER 3. MEASUREMENT
3.1 Definition
The literature of measurement seems to have grown rapidly during the early 1950's when the attention of contributors was focused on quali-fication versus quantiquali-fication in the field of perception and
psychology. The following is a summary of that discussion and conclu-sions drawn to help understand the issues of evaluation in environmental design. This introduction provides the necessary conditions to perform
computer-aided evaluation and choice.
Measurement is defined as "the assignment of numerals to objects or events according to rules -- any rule."1 Only random assignment of numbers is excluded measurement. Stevens' basic point is that once a
set of items is measured by numerical assignment according to rules, the assignments may be transformed by whatever functions will preserve the
empirical information contained in the measurement scale. Hodge,2 however, suggests that problems of measurement in city planning stem
from a lack of adherence to the rules for constructing and operating on
1S. S. Stevens, "Measurement, Psychophysics, and Utility,"
Measure-ment: Definitions and Theories, edited by C. W. Churchman and P. Ratoosh, John Wiley and Sons, New York, 1959, p. 19.
2Gerald Hodge, "Use and Mis-Use of Measurement Scales in City Planning," Journal of the American Institute of Planners, Vol. XXVIII, No. 2,
-19-measurement scales. The CHOICE system represents a set of measurement scales and operations for performing evaluation. Its use, however, is also limited to the same rules of measurement.
3.2 Types of Measurement Scales
Torgerson's3 discussion of measurement will serve well in outlining the range of measurement concerns. He suggests that we cannot "measure" objects or systems of interest, only properties which define the system. With little disagreement among the various contributors to the field, three types of scales are identified by the following characteristics:
(1.) order (2.> difference
(3)
origin.Torgerson continues:
"For some, but not necessarily all properties, it is possible to give empirical meaning to one or more characteristics which are analogous to the charac-teristics of numbers listed above (order, difference, origin). It is then possible to establish a one-to-one relationship between objects possessing this property and those characteristics of numbers.
Numbers are then assigned to the objects so that the relations between numbers reflect the relations between the objects themselves with respect to the property. Having done so, we have measured the property; i.e., established a scale of measurement."
3Warren S. Torgerson, Theory and Methods of Scaling, John Wiley and Sons, Inc., New York, 1958, Chapters 1, 2, and 3.
-20-Nominal scales have no order, distance, or origin. Values assigned to such scales represent classifications. Correspondence between numeral and object is all that is required. Counting is the only available operation. Numerals on players' uniforms is a nominal measurement.
Ordinal scales describe the relation of differences between pairs of objects. Assigned numbers represent the order of magnitude of the property. The relationships of "greater than, less than, or equal to," describe rankings of objects relative to each other. No arith-metic operations are permitted; any monotonically increasing
trans-formation is order preserving. Ranking contestants of a race in the order of their finishing is an example.
An interval scale includes ordinal information as well as a measure of the distance between pairs of objects. Multiplication and division are permitted as well as addition and subtraction of these differences; any linear transformation (y = ax + b) preserves both the order and distance relationships of the original assignment. Interval scales have an arbitrary origin. Temperature scales are examples of interval measurement.
Ratio scales include order and distance relationships as well as having a fixed origin for permitting addition of assigned values. All arith-metic operations can be performed on values; transformations which do
-21-not change the origin (y = ax) preserve order, distance, and ratio characteristics.
Additional scales of measurement are summarized by Fishburn. These include partially ordered, bounded interval and ordered metrics. It is sufficient to say that these additional scales can be formed by using combinations of ordinal, interval, and ratio scales. Their use
seems to be beyond the scope of most evaluation efforts, even though Fishburn maintains such scales represent an evaluator's sense of
"relative value" between different consequences.
3.3
Kinds of Measurement FunctionsTypes of measurement scales are based on characteristics of order, distance, and origin. The type of scale indicates how much information
about the property is contained in the numerical representation. Kinds of measurement functions, however, deal with the operations which assign values to a particular scale. The kind of measurement function describes how the representation was formed or valuation was made. It should be noted that values assigned to a particular scale can be a mixture of different kinds of measurement functions.
Peter C. Fishburn, Decision and Value Theory, John Wiley and Sons, New York, 1964, Chapter
h.
He suggests that many scales are needed in order to represent an evaluator's different states of information and(2.)
Density = mass/volume.
A derived measurement is an explicit transformation which accepts measured properties as arguments (mass, volumel and assigns the value to a dependent scale (density) by a set of operations or functions such as division in the above example.
Fundamental measurement.
Fundamental measurement is a means by which numbers can be assigned according to natural laws to repre-sent the property but does not presuppose the
measurement of any other variable.
Length = units of length Qbserved
(3.>
Definitional or arbitrary measurement.
Measurement by definition depends on a presumed relationship between some set of observed property and the measured property. Definitional
measure-
-22-Torgerson suggests three types of measurement functions:
(1.) Derived measurement.
The property represented on a scale derives its meaning through laws relating the property to other properties. For example,
-23-ment has no set of natural laws by which the indice's relation to different quantities can be tested. Definitional measurement is a looser form of derived measurement.
Socio-economic Index = arbitrary function of income, job status, educational level, etc.
3.4 Measurement and the CHOICE System
All types of measurement scales and kinds of measurement functions described above can be represented in the CHOICE system. It should be noted, however, that most operations are performed on ordinal or ratio scales. The nominal scale is a more general type of classifi-cation scheme not readily used in evaluation except to check for the existence of a property. CHOICE does not work well as a descriptive system for design.
In CHOICE, interval and ratio scales are represented as floating-point numbers; ordinal rankings as integers. Because values assigned to different scales may be represented simultaneously, ordering the differences between pairs of objects (i.e., both ordinal and interval measurements) permits all types of scales to be represented as combi-nations of measurements.
The task of evaluation and choice in environmental design is often more complicated than the explicit kinds of measurement functions just described. One may not be able to explicitly define the rule which, according to Stevens, is essential to measurement. Fundamental and derived measurements may be implicitly represented by the evalua-tor's judgments. In CHOICE, he may explicitly derive measurements or assign values to scales after making judgments which imply rules that cannot be represented by formal means.
-25-CHAPTER 4. A MEASUREMENT MODEL OF DESIGN
4.1 The Dimensions of Design
The description of a design project at any particular moment or the dynamics of the project over any given time interval takes a large number of aspects into consideration. The choice of qualities referred to in the design project depends on the persons making the description (e.g., designer, client, customer, contractor, etc.). These qualities used to describe the design project will be referred to as "the dimen-sions of design." The dimensions of design are different measurement scales as previously defined.
The number and types of design dimensions in community-scale projects is very large. Roger Lewis1 attempts to list these dimensions and classify them according to shared characteristics. His research points up the open-ended quality of specifying a set of design dimensions. One's ability to generate an exhaustive set of dimensions is by no means certain. It is assumed, therefore, that some subject of all dimensions is sufficient for any one description of design. It is further assumed that the number of dimensions necessary for making choices about the design project is finite.
1Roger K. Lewis, Community-Scale Design Variables, Master's Thesis in Architecture, M. I. T.., July, 1967.
-26-From Lewis' point of view, some of the sets of relevant dimensions describing community design are summarized as follows:
A. CONTEXT VARIABLES B. PARTICIPANTS D. PHYSICAL CONSTRUCTS Physical Site Designers Structures
Consultants
Geography Clients Surfaces
Topology Underwriters Volumes
Climate Producers Lineals
Composition Conduits
C. GOALS Connections
Population
Performance Landforms
Behavioral
Cultural Comfort Earth
Social Safety Water
Political "Fit" Vegetation
Economic Activity
Composition
4.2 Design as Dimensional Transformation and Value Specification
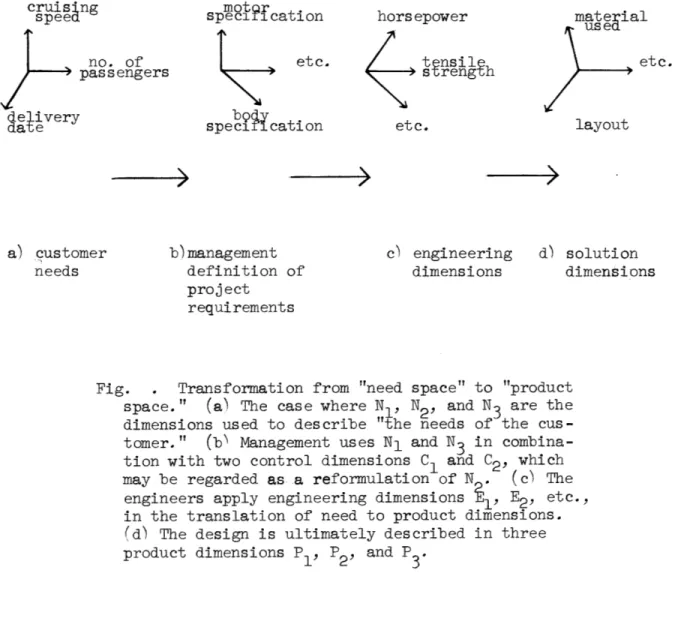
In an attempt to describe the development of an engineering project, Ramstrom and Rhenman define project dimensions of needs, control, engineering and product. The design process can be formally described as "a transformation of the problem defined in the space formed by the need dimensions to the solution given in the space formed by the pro-duct dimensions."
2
D. Ramstrom and E. Rhenman, "A Method of Describing the Development of an Engineering Project," IEEE Transactions on Engineering Management, Vol. EM-12, No. 3, September, 1965.
-27-The problem-solving process involves choosing relevant product dimensions and assigning values to these dimensions. In order to choose the relevant product dimensions, a transformation of need to product takes place by utilizing control and engineering dimensions as outlined below: spgoffcation no. of passengers bpdva. specification horsepower tcnsi :I strength etc. materialusea etc. layout al customer needs b)management definition of project requirements c) engineering d) solution dimensions dimensions
Fig. . Transformation from "need space" to "product space." (a) The case where NJ, N2, and N3 are the
dimensions used to describe "the needs of the cus-tomer." (b> Management uses Ni and N3 in combina-tion with two control dimensions C1 and C2, which
may be regarded as a reformulation of N (c) The engineers apply engineering dimensions K , E2, etc.,
in the translation of need to product dimensions. (d) The design is ultimately described in three product dimensions P , P2, and P3
cruis ing 5peed
delivery
-28-Ramstrom and Rhenman recognized that such a transformation is not linear, but includes reformation of the various dimensions and values as new information is generated in design.
From these two examples, one sees the vast number and types of dimensions that can be considered in community design projects and the changing transformations from one set to another as problems and solutions are recognized and specified. The remainder of this section shall be devoted to a formal presentation of the dimensions of design. Two forms of the dimensionsl model shall be defined. The first, a parametric form, shall include all possible types of dimensions much like the Lewis example. The second, a metric form, shall be restricted to dimensions where distance
can be measured in the spirit of the "spaces" discussed by Ramstrom and Rhenman.
-29-4-.3 Two Dimensional Representations: Parametric and Metric Forms
Two forms of representation will be used to introduce the measurement model of design. The first form will be called "parametric"; the
second, "metric." The parametric form is more inclusive, for it merely classifies a project by values on any type of dimension or measurement scale. A parameter is defined as an arbitrary constant characterizing a particular element by each of its values. The metric form presents a model of design where distances and origins of measurement scales are defined. The metric form is a special case of the parametric form, limited to those dimensions which have distance defined (at least an interval scale.) The metric form is useful, because it permits a design project to be visualized as points in a space of design dimensions.
4.4 The Parametric Form
Let us assume that many important aspects of a design project can be
identified at least by a name. These aspects of a design shall be referred to as the "parameters of design."
One can see that the set of design parameters encompasses the many
considerations of environmental quality, costs, distributions of benefits, responsibilities, jurisdictions, locations, etc., which are familiar to persons dealing in urban planning and design. One can also see that the
-30-set of parameters represent different types of measurement scales, some indicating existence or absence, quantity or quality, of the various aspects of a design project.
Definition 1: A design parameter, p., is a measurement scale of some aspect of the design. It is assumed that a design project can be represented by values assigned to a finite number of parameters, p , p2' n'
P is the set of all design parameters.
A design project, however, is more complex than a single set of values assigned to the design parameters. A design is in fact a set or sets of values assigned to the design parameters. There are many different speci-fications used to represent the many different elements of a project.
Environmental design projects are characterized by a multiplicity of parameters and many sets of values assigned to these parameters.
Definition 2: A design element, e1, is a set of values
assigned to the design parameters, p. A design element, e = p 1, pi2, ... , p. where p.. is the i-th value of the j-th parameter.
E is the set of all design elements.
A design element, e., is a unique assignment of at least one design
parameter, p.. If two "elements", e. and e., have the same values on
ee
a
-'-A design project, D , is a set of design elements. Each element is m
uniquely defined by an n-tuple of parameter values; each design project is merely a collection of such elements.
Definition 3: A design project, Dm, is the set of all design elements, E. Dm (el, e '' 'e m) where each element, e = p, pi2' ' in' is an n-tuple of values assigned to the design parameters.
A design project, Dn , is distinguishable as an alternative from design, Dm if one of the following conditions occurs:
(1.) Different values are assigned to the same set of design parameters. D = (el, e2 ' 'k' ' e m where ek kl k2' ' kn and Dn = (e e2' '' e k e m but ek kl k2 ' ' kn such that pk2 k2*'
Thus, (e k) does not correspond to (e k . k mkn
-32-(2.) Different parameters define different sets of design elements. D =(e,ee m 12' ' ek m where ek Pkl' k2' '' kn and ID =(el, e . em n 1 2 ek9 but ek = kl' k2' '*'pkn' Pkn+1'
Thus, (e ) does not correspond to (e ) because different parameters
k m k n
define the elements. This is a special case of (1.) in which the value of a non-specified parameter is assumed to be zero.
(3.) Different elements simply define different designs.
D = (e1' e2' ' m and
D = (el, e2 ' ' ' m+
This is also a special case of (1.) in which all values of the missing element in D are assumed to be zero.
m
Definition 4: A design, Dn, is a distinct alternative to design, D , when the values assigned to each para-meter for each element do not correspond.
A designer's use of the term "alternative" usually refers to "schemes" or designs which have easily recognized sets of obviously different parameters
develop-
-33-ment this type of alternative scheme is often generated by parallel design efforts such as Boeing versus Lockheed in the SST competition. Case (1.) is a more subtle form of presenting alternative designs. This type of alternative is often the result of sequential specification of several values on the same parameter in order to evaluate their impli-cations.
At any stage of specification, all types of alternatives may exist. This situation can be represented as follows:
Scheme Scheme
py p2' ' ' '' Yk'L ' ''m' Pn
where the elements of D are defined by m
values of parameters pl, ... , PL, and
the elements of Dn by values on para-meters pk' PL' ''' ' n'
Both schemes share assignment of values on common parameters, pk' L'
Each scheme, however, may have alternative specifications on its own
set of design parameters. This can be represented as a common element, e , having two alternative specifications on one parameter, pm'
where the element e. of D, has some value pm, ' on the m-th parameter, and the same element of D " has a different
n value p p ' .
In further discussions no distinctions shall be made between schemes and alternatives of a particular scheme. It shall suffice that an "alternative" design does not have a 1:1 correspondence of values for each element on each parameter. Both types of noncorrespondence discussed above shall be termed alternative specifications.
-35-4.5 The Metric Form
The metric form of the measurement model of design is more restricted. A "metric" is an aspect of a design which can be defined in terms of a quantity. The term metric shall be used to denote a dimension on which
distance or interval between values is defined. In this more limited sense, a design metric defines a Euclidean or vector space.
Gerard Debreu3 uses such a concept to construct a choice framework in an economic setting. Although the formal treatment is well beyond the scope of this research, his definition of dates, locations, and commodi-ties fit this discussion of the metric form.4
(1.) Time: The interval of time over which an activity takes place is divided into a finite number of compact elementary intervals of equal length. These elementary intervals are numbered in chronological order; the origin is the present. The unit length is chosen small enough for all the instants of an ele-mentary interval to be indistinguishable from the point of view of the analysis. An elemen-tary interval is called a date.
3Gerard Debreu, Theory of Value: An Axiomatic Analysis of Economic Equilibrium, Monograph #17, Cowles Foundation, John Wiley & Sons, Inc., New YorkT1959.
Debreu. Ibid. pp. 29-30. The discussion on time, location, and commodities is paraphrased for compactness.
-36-(2.) Location: A region of geographic space over which an activity takes place is divided into a finite number of compact elementary regions. These regions
are chosen small enough for all the points within one of them to be indistinguishable from the points of view of the analysis. An elementary region is called a location.
(3.)
Commodity: A commodity is defined by a specification of all its physical characteristics, its date, and location. A quantity of a commodity is expressed by any (non-negative) real number. It is assumed that there is a finite number of k distinguishable commodi-ties. The space Rk is called the commodity space. An action is a specification for each commodity ofthe quantity. An action is a point, a, in space, R
Definitions 1, 2, and 3 can be rephrased in a metric form as follows:
Definition 1E: A design metric, mi., is a measurement scale of some aspect of the design. It is assumed that such a scale is at least an interval (or ratio) scale on which distance is a meaningful representation of a quantity. It is further assumed that a design can be partially represented
No two elements e. and e. may exactly correspond. If 1. J
they do, e. = e.. In the metric form, one point 1u
r
would represent both e. and e .
-37-by a finite number of such dimension, mi, m2, ... , in
M is the set of all design metrics.
M is a subset of P, the set of all design parameters.
Definition 2B: A design element, e., is a point in the space formed by the design metrics, M. The quan-tity of each metric specified by the element, e., is the projection of the point e. on the metrics, M. An
element, e., is a vector of quantities of M.
m1
e01
-38-Definition 3B: A design, Dm, is also the set of points (e1, e2' ''' ' em) in the metric space, M, where each element e1 is a vector of quantities of M.. m 1 *e. m12 m 2
-39-Definition 4B: A design, D n, is a distinct alternative to design D when different sets of points in the
m
space, M, define each design.
There is a corresponding example for different schemes being specified in spaces defined by different metrics (values along unshared metrics being equal to zero in one alternative). Similarly, more elements (points or actions) may be specified in one alternative than another.
-40-4.6 Operations on Elements
There are two methods for naming a set. The first is to name its members. An element, e., is defined by the list of values assigned to each para-meter, as in Definitions 2 and 2B. Similarly, a design, Dm, is defined by naming its members, the list of elements, E, as in Definitions 3 and 3B.
The second method of naming a set is to condition set membership by some property which characterizes the members of the set. Such a set might be the collection of elements which have a particular value (or range of values) on a specified parameter. A set which includes other elements either by naming or conditioning the list of elements is a partial design. It is a subset of E, whereas a design is the set, E.
Definition 5: An including element, em+1, is a set of
elements whose members are specified (el, e2' .. ' em), or meet a condition for inclusion such as p.. must be
equal to some prescribed value. Operations for naming or conditioning such including elements merely construct sets of elements or partial representations of the pro-ject. The design, Dm, actually includes all combinations
of including elements as well as the set E = (el, e2' ''' e m'
-41
-The design, Dm, can be thought of as a hierarchy of all possible including elements:
E = (el, e
2' '' e m
where E = (el, e 5
E2 = (el, e8, '' ' k and Ek = (El, E2), etc.
so that D = (E, E, EE, ...E 3 ,
m 1 23 m
4.7 Operations on Parameters
Parameters may be derived from other parameters in much the same way that elements may be derived from other elements (4.6). A parameter, however, does not "include" another parameter as a set relation. A parameter is "derived" from other parameters in terms of functional
dependency. If a particular parameter, benefit, and a second parameter, cost, are used to define some design elements, a third parameter,
cost/benefit ratio, can be derived from the first two parameters. It was shown that this type of operation is defined as a "derived measure-ment." In the metric form, a "basis" is composed of the including
(independent) dimensions. The derived dimensions are those formed by some linear combination of the basis.
Definition 6: A derived parameter, pn+1, is a dependent parameter functionally related to the set of independent or basis parameters, p1, .. , pn. Elements defined with respect
to the basis parameters are also defined with respect to the derived parameters, even if the value of the derived parameter is assumed to be zero.
4.8 Parameters of Including Elements
An including element (Definition 6l refers to a set of elements, each of which satisfy some membership condition. An including element is merely a set of elements, and is formally the same as a design, D .n It is also true, however, that an including element may have a set of values on parameters which refer to the including elements. These
parameters refer to macro characteristics of the included elements taken as a whole. Parameters of including elements can be viewed statistics of the included elements.
Typical examples of derived parameters can be stated as follows: If the including element is em = (el' e2' ''' ' k and e = (pl ,p2' '' ' pj .' '. n for i = l, k,
then (a.) mean of p; for including element,
e = 1 k
m+1l
-k p..
(b.) variance of p. for including element, em+l = 1 k
k (p.. - mean of p. for em+l
or 1 k
k (p.. - (a.)
i=1 (c., range of p. for element e
is the difference between the largest and smallest value of p.., i=1, 2, ... , k.
13]
(d.) extreme of p for element em+l
is the largest or smallest value of p. .. It represents the positive or negative mode.
(e.) median of p. for element em+l
is the value of the i-th element's j-th parameter when the i-th element represents the 50 percentile of all elements' j-th parameter.
-44lt-(f.) total number of included elements having membership in the including element, em+l, is the number of included elements.
(g.) total value of a particular parameter, p, for all included elements,
e. (i=1, 2y, ., k) =k i=1
-45-The idea of inclusion is central to Manheim's hierarchically-structured decision process.5 In Manheim's model, the designer attempts to assign values to parameters in an optimal sequence from most inclusive to ele-mental based on Bayesian decision rules. No such assumptions are
presented in the measurement model of design. Rather, it is assumed that many different "levels" of the design are derived or assigned in
order for the decision-maker to specify appropriate actions. The only aspect of the designer's efforts which is sequential is the obvious time
dimension in which he operates. The "level" of specification, however, need not be assumed to be sequentially specified in the hierarchical
direction from most inclusive to least. In order to operate in Manheim's model, the designer must be able to specify all elements (actions) at a particular level of inclusion that make up a design. It is easier to assume that the designer makes partial specifications at various "levels" of the design. These specifications, although sequential because of the designer's time dimension, need not be thought of as "derived" or
included from the previous specification.
5
Marvin L. Manheim, Highway Route Location as a Hierarchically-Structured Sequential Decision Process, Department of Civil Engineering, M.I.T., May, 1964, pp. 39-47. (Also published as Hierarchical Structure:
A Model of Design and Planning Processes, M.I.T. Report
7,
M.I.T. Press,CHAPTER 5. CONSEQUENCES OVER TIME 5.1 Dynamics of Design
Given a design, Dm, a set of values assigned to one can represent the life of a project in the following way. As in Debreu, (pp. 35),
a parameter, pt, is defined as the "time" dimension. The remaining values of the n-l parameters for all elements are specified for each "date" or unit specified on the time dimension. At any particular value of pt, the other values on each of the remaining n-l design para-meters for all elements represent the "state of the design." This
representation is analogous to a phase space in physics. From the preceding definitions (4 and 4B), each state of the design is actually an alternative, for at least the value of one parameter, pt, changes for every design state.
However, this definition is not an alternative in its usual sense. In fact, it is just the opposite. Alternatives generally refer to more than one set of actions which are expected to occur at the same time. Consequently, a choice must be made among alternatives for they are mutually exclusive and cannot occur simultaneously.
Alternatives are defined by the difference occurring among sets of elements and the values assigned to their parameters at the same time.
It is also of great interest to describe streams of design states as they change over time. At a particular time, design D is a set of
- 7
T-elements; over several periods, D is a set of sets of elements. This m
can be illustrated as follows:
et = 1 et , = 2 et,, = T
The condition required for two design states to be part of the same stream is that the state with a higher value on ptr is reachable from the state with p
>
ptr' This use is appropriate for it is meant that a transformation of values assigned to parameters for all ele-ments of Dml, exists which produces the values of D .5.2 Uncertainty and Time
It is well documented in the literature of decision theory1 that the models for choice under uncertainty involve the indetermination
resulting D from the transformation at D . Thus, the reachability
m2 ml
condition must be relaxed to include an expectation of reachability. Under uncertainty, the stream of design states which can be part of an ?alternative" stream can be diagrammed as follows:
1ere p' is the parameter of p
probable occurrence
,ondition: p p + p = 1.0)
wnere p ,, is parameter of probable
occurrence
'N.
M. Smith, "A Calculus for Ethics: A Theory of the Structureof Value - Part I," Behavioral Science, April, 1956, pp. 111-142. The value of a particular design state is equated to the expected values reachable from that state.
5.3 Derived Parameters for Streams of Design States
Typical examples of derived parameters can be stated as follows:
(a.) The change or difference in value of some p. between two time periods.
Actually, because this temporal representation is the same as the representation of alternatives, D and D , the operation of difference is a very
m n
important comparative technique in evaluation.
(b.) The rate of change in value of some p. between two time periods.
If the function relating p. to changes in alternatives is assumed to be continuous, this
operation denotes the derivative or marginal contri-bution or change.
(c.) Cumulative total is the summation of a particular value of p. for each time period.
(d.) Discounted present value is a function which maps values of each p. for future time periods to t=O.
Further characteristics of relations on the time dimension include sequence, precedence, simultaneity, etc. Because we are interested in evaluating strategies of choice over time, this particular
-50-CHAPTER 6. A MEASUREMENT MODEL OF EVALUATION AND CHOICE
6.1 Goals and Constraints
Typical goals and objectives in planning literature include such phrases as "use land efficiently, protect natural resources, maintain large open spaces, provide efficient transportation, and encourage greater variety of living environments."1 Other lists include phrases such as "functional adequacy, optimum communication, least cost, adap-tability and image quality."2 On the other hand, standards such as maximum families per net housing acre equals forty, or families per gross acre of total development between 20 and 24,-3 can be found in zoning manuals and performance specifications.
Robert C. Young makes the distinction between these two types of
statements, calling the general type a "goal" and the specific standard an "objective" which contributes to the satisfaction of a goal. He
1
General Plan for The Maryland-Washington Regional District, The Maryland-National Capital Park and Planning Commission, 1962, pp. 16-19.
2
Kevin Lynch, Site Planning, M.I.T. Press, 1962, pp. 11-13.
3Proposed Minimum Standards for Permanent Low-Cost Housing, Division of International Affairs, Department of Housing and Urban Development, Washington, D.C., May, 1966, p. 12.
14
Robert C. Young, "Goals and Goal-Setting," Journal of the American Institute of Planners, Vol. XXXII, Number 2, March, 1966, pp. 76-85.
-51-considers goals as providing a direction for choice, but objectives as being capable of obtainment and measurement.
It seems to me that the distinctions between goals and objectives or goals and constraints tends to be both arbitrary and misleading. The following chapter shall show the equivalence among goals, constraints, and objectives.
6.2 Absolute Comparison
Intermingled in these phases are two basic ideas. The first is a sense of absolute comparison between an expected outcome of some action and a set of desired or required results. Often budget constraints and per-formance standards are phrased in this way. Such an absolute statement prescribes a set of values assigned to parameters which must be obtained. If the prescribed values of the goal and the expected outcome of an
action correspond, then the design is acceptable relative to that abso-lute criterion.
This idea is most easily described in the metric form of design. In the space defined by the set of design parameters, goals or constraints are desired, required, or forbidden regions on some of the parameters.
If, for instance, "distance to school" was a parameter of the project, a goal could be that the value obtained on this parameter must be "less than one-quarter of a mile."
-52-Graphically, this can be illustrated as follows:
region of performance dis-satisfaction
distance to school, miles
The constraints of linear programming problems fit this metric form of design. Feasible and infeasible regions are those locations in which an element may or may not be specified. Simon5 also defines
such regions of acceptability in his model of satisficing behavior.
unsatisfactory
sfactory m
n
5Herbert A. Simon, Models of Man. John Wiley and Sons, New York,
It is easy to note that a goal or performance standard stated positively (greater than 50) is the equivalent to a negatively stated constraint (less than 10). It is generally held that goals tend to indicate posi-tive aspirations and constraints mean negaposi-tive conditions. They are, however, both prescriptions of a desired or required design state. Whether the system is striving towards some state or away from some state does not change the logical equivalence between goals sad con-straints. Perhaps they should be called prescriptions regardless of their positive or negative connotation.
6.3
Relative ComparisonThe second type of evaluation addresses the question of which design is preferred from a set of designs being considered.
The prescriptions such as "more" of a particular design quality or the "maximum" amount from among all feasible alternatives are types of preference statements which rank one design relative to another. The absolute scheme compares a given design alternative to a set of points or regions which were defined as desired, required, satisfactory, etc. The relative scheme compares a given design alternative to other alter-natives and relates their differences to a preference ordering.
The objective function of the linear programming example is used to measure one alternative relative to another. Such a function provides
-53-a score for e-53-ach design -53-altern-53-ative. The prescription for choosing the largest of these scores (maximum) or smallest (minimum) indicates which design is preferred.
Having both absolute and relative goals partitions the selection of a preferred solution to those which do not violate any absolute con-straints. Linear programming provides such a scheme for mixed
prescriptions if a single objective function is specified.
6.4 Implied Preference
Goal statements which describe a desired or required outcome are merely a special form of the design state. It is a sort of ideal alternative. Absolute comparison describes the difference between the desired state and the expected state. If several alternatives are being evaluated, relative comparison describes the proximity of each alternative to the desired state. If an absolute statement such as "greater than 50" is
satisfied by more than one alternative (or not satisfied by any), an ordering of the alternatives relative to their proximity to an absolute
constraint can be used to imply preferences among those alternatives considered.
The implied preference is "less travel time is preferred to more," even though the existing alternatives do not satisfy the absolute criteria.
-55-6.5
Goal Relationships as De-rived MeasurementMost of the authors concerned with the relationships among goals have viewed their linkages as hierarchies of means and ends. The hierarchy of evaluation often follows the division of the project into subsystems, each of which contributes to the design's overall effectiveness. An example of such an evaluation scheme is contained in POED , a technique for computing performance of complex systems.
It can be described as follows:
Overall score L task 2 . . . tE
Subsystem 1
Subsystem 2
I
sk K parameter 1 (cost) parmeter 2 (reliability) parameter G (weight)6
D. R. J. White, D. L. Scott, R. N. Schulz, "POED - A Method of Evaluating System Performance," IEEE Transactions on Engineering Management, December, 1963, pp. 177-182. For a similar scheme, seeJames R. Miller, III, "The Assessment of Worth: A Systematic Procedure and Its Experimental Validation," Ph.D. Dissertation, M.I.T. Sloan School of Management, June, 1966.
-56-6.6 Special Cases of Derived Measurement
Although such a goal hierarchy may be an appropriate scheme for
describing the relationships among goals, a more general statement is made by Hall. He recognizes that such a tree of relationships
requires independence of subsystems or subgoals which is unrealistic in most complex problems.
His scheme accommodates the view of goal relationships as a semi-lattice rather than a tree.
This semi-lattice consists of the following four types of relationships: (1.) means-end
(2.) particularization-inclusion
(2.> value-wise independence, dependence (4.) vector-connected.
Although I concur with the view that goal relationships can be most generally described as a semi-lattice, the effort to distinguish among types of linkages seems misleading. It can be shown that all such relationships are merely special cases of viewing the semi-lattice as a set of derived measurements.
7
Fred L. Hall, "A Method for Dealing with Complex Goals and Indefinite Utilities in Decision Problems," Master's Thesis, Sloan School of Manage-ment, M.I.T., 1967.