HAL Id: hal-00756953
https://hal.archives-ouvertes.fr/hal-00756953
Submitted on 24 Nov 2012HAL is a multi-disciplinary open access archive for the deposit and dissemination of sci-entific research documents, whether they are pub-lished or not. The documents may come from teaching and research institutions in France or abroad, or from public or private research centers.
L’archive ouverte pluridisciplinaire HAL, est destinée au dépôt et à la diffusion de documents scientifiques de niveau recherche, publiés ou non, émanant des établissements d’enseignement et de recherche français ou étrangers, des laboratoires publics ou privés.
Concrete properties evaluation by statistical fusion of
NDT techniques
Zoubir Mehdi Sbartaï, S. Laurens, Sidi Mohammed Elachachi, Cedric Payan
To cite this version:
Zoubir Mehdi Sbartaï, S. Laurens, Sidi Mohammed Elachachi, Cedric Payan. Concrete properties evaluation by statistical fusion of NDT techniques. Construction and Building Materials, Elsevier, 2012, 37, pp.943. �10.1016/j.conbuildmat.2012.09.064�. �hal-00756953�
Concrete properties evaluation by statistical fusion of NDT techniques
Zoubir Mehdi Sbartaïa, Stéphane Laurensb, Sidi Mohammed Elachachia, Cédric Payanc
a Université de Bordeaux, I2M-GCE, CNRS, INRA, 351 cours de la libération, Talence, France
b Université de Toulouse, UPS, INSA, LMDC, 135, Avenue de Rangueil, F-31077 Toulouse Cedex 4, France
c Aix Marseille Université, LMA CNRS UPR 7051, LCND, Avenue Gaston Berger, 13 625 Aix en Provence Cedex 1, France
Abstract:
Measurements from Non-Destructive Testing (NDT) techniques are affected in different ways by concrete properties such as porosity, complexity of the pore network, water content, strength, etc. Therefore, extracting one concrete property from one NDT measurement appears to result in uncertainties. This highlights the benefit of NDT data fusion to evaluate accurately concrete properties. In this paper, NDT measurements from GPR, electrical resistivity and ultrasonic pulse velocity were combined to predict more accurately concrete properties such as strength and water content. Two techniques of data fusion were used namely Response Surface Method (RSM) and artificial neural networks (ANN).
The results obtained show the effectiveness of the statistical modeling to predict the properties of concretes by fusion of NDT measurements. In the context of this study, the performances of the two techniques of fusion appear relevant in terms of water content and concrete strength prediction. ANN models exhibit better predictive ability than RSM ones.
1. Introduction
For a decade, research investigations have been carried out for examining the potential of NDT techniques for concrete condition evaluation. However, the measurement of NDT physical parameters such as velocity of ultrasonic waves, electrical resistivity or GPR wave is affected by noise “error” either from the accuracy of the measurement and/or the variability of the material. It is important to notice the limited ability of a single NDT technique to directly evaluate concrete property. For example, GPR technique is sensitive to moisture and also to chlorides [1,2], ultrasound is able to evaluate the modulus of elasticity but it is also sensitive to moisture and density [3], etc. For these reasons, some researchers have proposed the combination of techniques [4-6] or of several physical parameters obtained with the same technique [7-9] in an attempt to improve the interpretation of measurements and to reduce the uncertainty in predictions arising from surface condition, concrete condition, mix proportions, etc. This original approach is very interesting but only if the additional cost is balanced by the enhancement of the quality in the assessment [10]. Knowledge of the assessment quality is very important in order to be able to take a decision regarding additional cost or quality enhancement of the assessment by the use of several different measurements. Determining whether combination provides complementary or only redundant information is needed. This approach can lead to the selection of the best combination for the optimal evaluation of the concrete property [11].
The results presented in this research work focus on the implementation of a general strategy for enhancing the assessment of RC structures by NDT techniques. A large laboratory and on site experimental programme was implemented as part of the SENSO national French project [12]. This paper deals with the implementation of two approaches of data fusion using statistical modelling with an aim of evaluating concrete properties from the measured NDT parameters. The two selected methods are the Response Surface Method (RSM) and the Artificial Neural Networks technique (ANN). The predictive performances of these two approaches are discussed.
2. Experimental programme
81 slabs (50 cm x 25 cm x 12 cm), made from eight different compositions of concrete, were used in this study. They were conditioned at various water saturation degrees. The mixes covered a range of water-to-cement ratio sufficiently extended to be representative of what is usually found in structures (0.3 to 0.8). A large number of different NDT measurements were performed.
Table 1 summarizes the first laboratory benchmark: mixtures, number of slabs, and the corresponding properties (degree of saturation, porosity, modulus of elasticity and strength). These properties were measured on cylindrical cores (modulus of elasticity, compressive strength, porosity), or by monitoring the slab’s weight (degree of saturation). For each slab, the different techniques provided 52 NDT measured physical parameters (e.g. Ultrasonic Pulse Velocity). About 12,700 numerical values were collected and stored in a database. The first purpose of the data analysis was aimed at reducing the set of values. The second one was aimed at finding the most relevant NDT parameters for the prediction of each concrete property [11].
3. NDT methods 3.1 Ultrasound
Ultrasonic Pulse Velocity (UPV) measurements were performed in direct transmission mode by 250kHz compressional transducers. The emitter (Panametrics V1012) was driven by a high voltage pulser/receiver (Panametrics 5058 PR) in transmission mode, with a 40 dB pre-amplification for the receiver. The transmitted signal was recorded using an oscilloscope (Lecroy WS 442). The processed signal was the mean of 40-recorded signals. The time of flight is obtained by a zero crossing method (Fig.1). The signal is voluntarily over saturated, the noise level is estimated. The first point of the signal exceeding 3 noise level is expected to correspond to the time of flight (tf). The velocity (v) is obtained by
v=d/tf where d is the distance between the emitter and the receiver. This distance was measured at 3
measured distances. To ensure the reproducibility of the measurements, the transducers were placed and held in place by mechanical holders attached to the samples.
3.2 Ground Penetrating Radar (GPR)
A radar system equipped with a ground-coupled antenna with a central frequency of 1.5 GHz was used. The antenna was first placed in air far from objects in order to record the direct wave signal as can be seen on figure 2, which was used as a reference for data normalization. The antenna was subsequently placed on the surface of the sample, radiating the EM energy through the material. The direct signal and the signal of the wave reflected by the bottom of the sample were recorded (Fig. 3). The processing of the radar data focused on the signal of the direct wave and consisted in applying a band-pass filter between 0.3 and 3 GHz. The signal amplitude was extracted and normalized with respect to the amplitude of the air wave signal as follows:
A
=
A
bA
aæ
èç
ö
ø÷
Ab is the peak-to-peak amplitude of the direct wave signal recorded in concrete (Fig. 3).
Aa is the peak-to-peak amplitude of the air wave signal (Fig. 2).
3.3 Electrical resistivity
The four-point method in a Wenner configuration, commonly used for the on-site measurements, was used for the measurement of the electrical resistivity of concrete. A low frequency electrical current (I) was applied through the external electrodes and this generated an electrical potential field in the material. The electrical potential (V) measured between the internal electrodes enables the electrical resistance to be calculated according to Ohm's theory (R = V/I). In a semi-infinite medium the electrical resistivity can be calculated using the following relation:
r
=
2
p
a
V
I
Eq. 1a is the distance between electrodes (5 cm in the case of this study)
4. Experimental results and discussions
The figures presented in this section show some relationships between data collected during the SENSO project. These experimentally determined relationships highlight the concomitant effects of several concrete properties on the physical parameters extracted from NDT measurements and, consequently, the benefit of their fusion to assess concrete properties.
Figure 4 shows experimentally determined relationships between electrical resistivity and volumetric water content for two types of concrete: high performance concrete (w/c=0.3 in Tab.1) and normal strength concrete (w/c=0.55 in Tab.1). These concretes were made with the same aggregate and cement type.
As expected, the electrical resistivity was highly influenced by the water content of concrete. The electrical resistivity increased as the water content decreased. A stronger increase in the resistivity was observed when the saturation degree became lower than 60 %, i.e. when there was no longer liquid phase continuity. However, it was also observed that electrical resistivity depended on concrete porosity since, for a given water content, the high performance concrete showed higher resistivity. To predict water content by the use of electrical resistivity, additional NDT methods are necessary to correct the effect of porosity. A resistivity of 1500 ohm.m could imply a water content of 4.2 % for an ordinary concrete while a 10.5 % for a high performance concrete. This noticeable uncertainty could be reduced by an additional NDT measurement.
Figure 5 shows, for the same concrete types, the experimental relationship between the direct wave amplitude of GPR measurements at 1.5 GHz and the volumetric water content of the concrete. One can
see a weak effect of the porosity compared with resistivity measurements. GPR measurement is primarily sensitive to the volumetric water content since it involves quite exclusive propagation phenomena of electromagnetic energy. On the other hand, resistivity measurements involve conduction phenomena. Therefore, resistivity is not only sensitive to the volumetric water content, but also to the complexity of the pore microstructure network.
Figure 6 shows the experimental relationship between concrete strength and ultrasonic wave velocity in transmission mode (Ultrasonic Pulse Velocity “UPV”). As the data number available was not sufficient to find the appropriate fitting procedure, a linear one was used. This figure highlights correlation between concrete strength and UPV measurements. However, the water content influenced this relationship showing that ultrasonic measurements alone are not sufficient to predict accurately the concrete strength. Therefor, the water content needs to be assessed in order to accurately predict concrete strength from UPV measurements [11].
These examples illustrate that the prediction of a concrete property from a single NDT measurement appears challenging since it is affected by other concomitant effects. This highlights the possible benefits that can be achieved by combining data from GPR, resistivity and ultrasonic pulse velocity measurements, in order to accurately evaluate concrete properties such as water content, strength, porosity, etc, which are important indicators of the durability of reinforced concrete structures.
5. Fusion of NDT techniques
Several techniques of data fusion are available for combining NDT measurements in order to improve results and reduce uncertainties, in particular for the on site assessment. For instance, several methods were employed in the literature. The probabilities were already often explored. The Dempster Shaffer theory [13] is well adapted to the classification of information to detect defects [14-15]. The theory of the possibilities is able to take into account the information given by both experts and indicators analysis [16,17]. In this study, methods based on training laws (response surface and artificial neural networks), are implemented and tested.
4.1 Response Surface Method (RSM)
A response surface is the output representation of a physical process to input variables [18]. The studied property or response "y", results from the transfer, by an explicit response function or transfer function, of the input variables of the system. Modification of the input data results in a change of the response value.
Input variables, xi (i = 1, ..., n) also called basic variables of the phenomenon, are characterized by a
set of recorded statistical information j (j = 1, ..., p) as distribution functions (which could be correlated
or not), standardized moments, etc.
The variables xi are generally spatial-temporal processes, called stochastic process and reduced to
random variables when time and space indices are fixed. To create a response surface model, one must provide:
• Representative and ordered basic variables {x} = {x1, ..., xn}. Their representativeness is
to use only explanatory variables and one need also to order the measured values of each variable from its lowest value to its greatest,
• The statistical information set of the vector {x} (distribution functions { } = { 1, ..., n}),
• The function which is an approximation of the response "y", explicitly formulated in terms of {x} knowing the variables statistics,
• A metric (distance function) for the basic variables and the response space. This metric measures how good the fit of the approximation function is to the response "y".
Several criteria enable preselecting the formulation type of the chosen response function to represent changes to the response "y". These may be:
• the level of complexity which determines the computation time; • the possibility of an experimental approach;
The construction of response surfaces consists therefore in fitting an approximate transfer model from a selected database using the usual functions, such as polynomial functions (analytical response surface).
The coefficients of the polynomial function are determined such as to minimize the error between simulated values obtained with this approximated function and real values. The estimation of these coefficients requires the completion of a series of experiments with input variables selected in accordance with an experimental design.
The choice of the degree of the polynomial function, its features and design of the experimental plan are linked. The number of coefficients to be determined increases (and similarly, the size of the experimental programme of work) with the degree of the polynomial function. Because of the mathematical form of correlations between observable-measured values NDT techniques and state indicators, full quadratic response surface (with cross terms) was used. The response y (x) has the form:
Cx
x
B
x
A
x
y
(
)
T
T Eq. 2Where A is a scalar, B and C are respectively vectors and matrix consisting of coefficients of polynomials that can be defined by:
Eq. 3 and nn n n c c c c C . . . . . . . . 1 1 11 Eq. 4
The matrix of the experimental design x is defined as follows:
x
=
x
11.
.
x
p1.
.
.
.
x
1n.
.
x
pné
ë
ê
ê
ê
ê
ê
ù
û
ú
ú
ú
ú
ú
Eq. 5Knowing the matrix x (n: number of variables, p : number of measurements), entities A, B and C are determined from the least squares method.
4.2 Artificial Neural Networks technique
Artificial neural networks (ANN) have been widely described by several authors [19-21]. In civil engineering applications, ANNs have generally been applied for evaluation of concrete properties such as compressive strength [22]. The ANN concept consists in learning experimental relationships between input and output data using mathematical training processes. An artificial neuron is presented in the Fig. 7, where Xi refers to input information i, wi refers to the weight affected to input Xi, b refers to neuron
bias, Y is the neuron output and F refers to the activation function that processes input information. Artificial neurons may be interconnected in order to generate an ANN able to model linear or nonlinear relationship between any type of data. The Multi-Layer Perceptron (MLP) is most popular ANN. An example of MLP is given in Fig.8. Training this type of network consists in optimizing model parameters (weights and bias) in order to minimize an error function computed from predicted and target data using, in the case of this study, back-propagation (BP) algorithm. BP is a gradient descent algorithm, which consists of changing network parameters (weights and bias) according to the negative of the error function. The new weights and bias are expressed by equations 5 and 6. The experimental database has to be divided into two parts: the training database (involved in the mathematical training process) and the testing database (used to stop the training process before achieving overtraining).
w i i i
w
E
w
1
/ Eq.6 b / i i 1 ib
E
b
Eq.7wi+1 and bi+1 are the corrected weight and bias values, wi and bi are the weight and bias values at
iteration i, η refers to the learning rate, i is the error gradient computed at iteration i:
w
E
E
i w i
/ Eq.8Ei designates the Root Mean Square Error (RMSE) and it is defined by:
N n i ie
N
E
1 21
Eq.9 where ei is the absolute error between predicted and actual data6. Results from data fusion
The implementation of a statistical model by RSM or ANN requires first a selection of the inputs of the model. This selection must be based on an optimum combination of the inputs allowing a better prediction of concrete properties [23]. In this study, an application of fusion methods on a set of 3 inputs is presented. These inputs were considered as the most relevant regarding the prediction of strength and water content. The presented methodology will be the same for other properties such as the modulus of elasticity, porosity, etc. All this data is available and summarized in the SENSO project database [12].
The first step for the implementation of the RSM or the ANN consists in dividing the database into two groups of data so as to use the first to carry out the identification of the model parameters (regression for the RSM and training process for ANN). In the case of this study, the first group of data (training) represents 80% of the total data. For a test of the RSM, the 3 inputs available were used to identify the coefficients of the models of compressive strength and water content. In this study, full quadratic response surface (with cross terms) is used because of the mathematical form of the correlations between the physical parameters of NDT techniques (e.g. UPV) and concrete properties (e.g. compressive strength). Regarding ANN models, the number of neurons and the number of layers are fixed according to an optimisation process that minimizes the error between actual and predicted values.
The presented results were used to systematically compare the measured data (actual values) and those calculated by the model on the training and testing groups of data. Figures 9 to 12 present typical results of the RMS and ANN models trained for compressive strength and volumetric water content predictions. Good correlations can be observed between actual data and those calculated by the models of RSM. These results confirm the choice of the form of the quadratic models. However, the accuracy of prediction of the ANN is lower as can be seen in figures 10 and 12. This is because the ANN model takes into account the testing group of data during the training process.
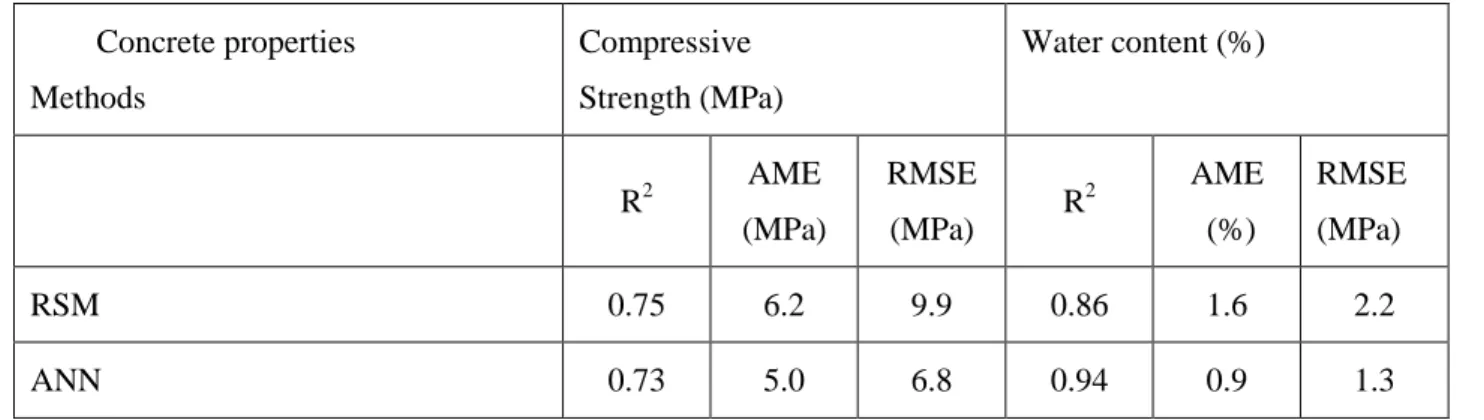
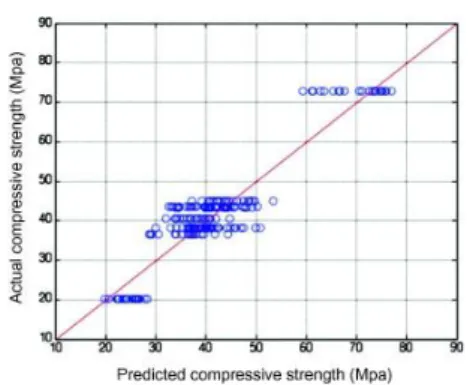
The results obtained from both techniques are presented on figures 13 to 16 for the group of testing data. From these figures, the ANN models have a better predictive ability than the RSM for testing database. It is recognized that the validation of a statistical model is exclusively based on the ability of the model to predict new data not used for the training process “optimization of the parameters of the model”. Comparing the two techniques of statistical modelling on the basis of their prediction ability on new data, the ANN showed better results. For example, although the R2 are similar in Table 2, the RSM model evaluates compressive strength with a mean absolute error of ± 6.2 MPa that is higher than that of ANN model (5 MPa). Table 2 shows that the ANN model with R2 = 0.94, AME = 0.9 and RMSE = 1.3 predicted concrete water content with more accuracy than the RSM (R2 = 0.86, AME = 1.6, RMSE = 2.2). Moreover, figure 13 shows that the RSM model tends to over-estimate the compressive strength.
From these results, ANN appears to be more promising in its predictive ability on new data. However, It is important to point out that RSM has the advantage of being simple to implement and in addition the model parameters are more easily determined.
7. Conclusions
NDT measurements are affected by several factors, and as a result of this, attempts at predicting a concrete property from a single NDT measurement may lead to considerable uncertainties. For example, the determination of concrete strength using ultrasonic pulse velocity is affected by water content. GPR and electrical resistivity are affected by both water content and concrete porosity. Developing methodologies for the assessment of concrete structures based on fusion of NDT techniques are needed to evaluate concrete properties on site. In this paper, two methodologies were tested, the method of response surfaces (RSM) and the artificial neural networks (ANN). The results of this study show that both techniques have satisfactory ability to predict concrete properties based on the fusion of ultrasonic, GPR, and electrical resistivity measurements. The surface response technique is simple to implement but its prediction ability on new data is, however, lower than that of the ANN. Taking into account material variability: moisture variation, water/cement ratio, and type of aggregates and dimensions, the combination of NDT parameters using ANN enables concrete compressive strength determination within +/- 5 MPa. Regarding water content prediction, the determination is within +/- 1.3 %.
To complete this study, new measurements are being implemented to assess the ability of NDT and data fusion techniques to quantify carbonation depth and chloride concentrations. On-site measurements data are being processed to evaluate the efficiency of the developed approach.
Acknowledgements
The authors thank the participants involved in the SENSO project for their contributions to this paper. The SENSO team is acknowledged for its contributions. The French National Agency for Research (ANR) is acknowledged for its financial support.
References
[1] Hugenschmidt, J., Loser, R. (2008), “Detection of chlorides and moisture in concrete structures with ground penetrating radar”, Materials and Structures, Vol. 41, 2008, pp. 785–792.
[2] Sbartaï, Z.M., Laurens, S., Rhazi, J., Balayssac, J.-P. (2007), “Nondestructive Evaluation of Concrete Structures Using Geophysical Methods: Correlation between electrical resistivity and radar measurements.” Journal of applied geophysics. 62 (4) 361-374.
[3] Etsuzo Ohdaira., Nobuyoshi Masuzawa. (2000), “Water content and its effect on ultrasound propagation in concrete — the possibility of NDE”. Ultrasonics, Volume 38, Issues 1-8, Pages 546-552. [4] Kheder, G. F. (1999) “A two stage procedure for assessment of in situ concrete strength using combined non-destructive testing”. Materials and Structures, Vol. 32, pp 410-417.
[5] Qasrawi, Hisham Y, (2000). “Concrete strength by combined non-destructive methods Simply and reliably predicted”, Cement and Concrete Research, 30, 739-746.
[6] D.G. Aggelis, E.Z. Kordatos, M. Strantza, D.V. Soulioti, T.E. Matikas. NDT approach for characterization of subsurface cracks in concrete. Construction and Building Materials, Volume 25, Issue 7, July 2011, Pages 3089-3097.
[7] Zaid, M., Gaydecki, P., Quek, S., Miller, G., Fernandes, B. (2004), “Extracting dimensional information from steel reinforcing bars in concrete using neural networks trained on data from an inductive sensor”. NDT&E International, V.37, 7, pp. 551-558.
[8] Sbartaï, Z.M., Laurens, S., Viriyametanont, K., Balayssac, J.P., Arliguie, A. (2009), “Non-destructive evaluation of concrete physical condition using radar and artificial neural networks” Construction and Building Materials, Volume 23, Issue 2, Pages 837-845.
[9] R. Hamid, K.M. Yusof, M.F.M. Zain. A combined ultrasound method applied to high performance concrete with silica fume. Construction and Building Materials, Volume 24, Issue 1, January 2010, Pages 94-98
[10] Gehlen, C., Dauberschmidt, C., Nürnberger, U. (2006), “Condition control of existing structures by performance testing”, Otto-Graf-Journal, Vol. 17, 19-44.
[11] D.Breysse, M.Larget, Z.M Sbartaï, J-F.Lataste, J-P.Balayssac. Quality of NDT measurements and accuracy of concrete physical properties quantitative assessment. European Journal of Environmental and Civil Engineering. Vol 15, N°4, 2011.
[12] Balayssac JP, SENSO: a French project for the evaluation of concrete structures by combining non-destructive methods. In SACoMaTiS 2008, Binda L, di Prisco M, and Felicetti R, editors, Varenna, Italy, 1-2 september 2008.
[13] Shafer G A. mathematical theory of evidence. Princeton University Press: 297 p; 1976. [14] Gros, XE. NDT data fusion. John Wiley & Sons New York: 205 p; 1997.
[15] Moysan J, Durocher A, Gueudre C, Corneloup G. Improvement of the non-destructive evaluation of plasma facing components by data combination of infrared thermal images. NDT&E International 2007; 40: 478–485.
[16] Zhang Shao-Fei Jiang, Chun-Ming Zhang, Shuai. Two-stage structural damage detection using fuzzy neural networks and data fusion techniques. Expert Systems with Applications, Volume 38, Issue 1, January 2011, Pages 511-519
[17] Marie-Aude Ploix, Vincent Garnier, Denys Breysse, Joseph Moysan. NDE data fusion to improve the evaluation of concrete structures. NDT & E International, Volume 44, Issue 5, September 2011, Pages 442-448
[18] Montgomery, D. C. (2005), Design and Analysis of Experiments (6th edition). John Wiley & Sons, New York.
[19] Rumelhart, D.E., Hinton, G.E., Williams, R.J. (1987) ‘Learning internal representations by error propagation - Parallel Distributed Processing’, D.E Rumelhart and J.L Mac Clelland Ed., MIT Press, Cambridge, MA, USA
[20] Bishop, C.M. (1995) ‘Neural Networks for Pattern Recognition’, Oxford University Press, USA [21] Rafiq, M.Y., Bugmann, G., Esterbrook, D.J., (2001) ‘Neural network design for engineering applications’, Computers & Structures, Vol. 79, Issue 17, pp 1541-1552
[22] Jafar Sobhani, Meysam Najimi, Ali Reza Pourkhorshidi, Tayebeh Parhizkar. Prediction of the compressive strength of no-slump concrete: A comparative study of regression, neural network and ANFIS models. Construction and Building Materials, Volume 24, Issue 5, May 2010, Pages 709-718. [23] Z.M Sbartaï, D. Breysse, M. Larget, J-P. Balayssac.Combining NDT Techniques for Improving Concrete Properties Evaluation. Cement and Concrete Composites. Accepted paper, 2011.
Tables
Table 1 Mixtures and characteristics (SENSO project – First benchmark, Sr is the water saturation).
Aggregates Round Siliceous
0 – 14 mm Round Siliceous 0-20 mm Crushed Siliceous 0-14 mm Crushed limestone 0-14 mm W/C (Porosity) 0.30 0.45 0.55 0.65 0.80 0.55 0.55 0.55 Reference G1 G2 G3 G3a G7 G8 G4 G5 G6 Number of batches 1 1 2 1 1 1 1 1 Series Sr (%) Number of slabs Series 1 0 9 9 9 9 9 9 9 9 9 Series 3 40 3 3 3 3 3 3 3 3 3 60 3 3 3 3 3 3 3 3 3 80 3 3 3 3 3 3 3 3 3 Series 2 100 9 9 9 9 9 9 9 9 9 Porosity (%) 12.5 14.3 15.5 16.0 15.9 18.1 14.2 15.2 14.9 Modulus of elasticity (GPa) 0 35.75 30.92 29.72 28.91 29.18 22.86 30.76 33.32 39.36 100 35.46 28.36 30.04 27.93 27.45 21.27 26.71 29.71 35.8 Strength (MPa) 0 77.2 55.6 - 46.0 44.0 27.0 47.0 53.0 44.0 100 77.9 43.3 43.5 40.5 38.3 20.2 36.6 45.0 38.2
Table 2. Prediction performance of RSM and ANN for the testing dadabase Concrete properties Methods Compressive Strength (MPa) Water content (%) R2 AME (MPa) RMSE (MPa) R 2 AME (%) RMSE (MPa) RSM 0.75 6.2 9.9 0.86 1.6 2.2 ANN 0.73 5.0 6.8 0.94 0.9 1.3
List of figures
Fig.1. Signal processing used for wave velocity measurements
Fig.2. GPR signal recorded in air
Fig.3. Typical GPR signal recorded on concrete slab
Fig.4. Electrical resistivity vs Water content of concrete
Fig.6. Experimental relation between concrete strength and transmission velocity of US waves
Fig.7. Artificial neuron
Fig.8. Example of MLP
Fig.10. Actual compressive strength versus predicted compressive strength by ANN on training database
Fig.11. Actual water content versus predicted water content by RSM on training database
Fig.12. Actual water content versus predicted water content by ANN on training database
Fig.14. Actual water content versus predicted water content by RSM on testing database
Fig.15. Actual compressive strength versus predicted compressive strength by ANN on testing database