HAL Id: inserm-02159373
https://www.hal.inserm.fr/inserm-02159373
Submitted on 18 Jun 2019HAL is a multi-disciplinary open access archive for the deposit and dissemination of sci-entific research documents, whether they are pub-lished or not. The documents may come from teaching and research institutions in France or abroad, or from public or private research centers.
L’archive ouverte pluridisciplinaire HAL, est destinée au dépôt et à la diffusion de documents scientifiques de niveau recherche, publiés ou non, émanant des établissements d’enseignement et de recherche français ou étrangers, des laboratoires publics ou privés.
Hyperoxia Challenge in Healthy and Anemic Subjects
using BOLD MRI
Chau Vu, Julie Coloigner, John Wood
To cite this version:
Chau Vu, Julie Coloigner, John Wood. Hyperoxia Challenge in Healthy and Anemic Subjects using BOLD MRI. ISMRM, May 2019, Montreal, France. �inserm-02159373�
Hyperoxia Challenge in Healthy and Anemic Subjects using BOLD MRI
Chau Vu, Julie Coloigner, and John Wood
Synopsis
This study explores the brain’s response to 100% oxygen inhalation in anemic subjects using BOLD MRI. Hyperoxic challenge has previously been used to identify brain regions with
increased oxygen extraction fraction from inadequate perfusion. After controlling for changes in peripheral oxygen saturation, hyperoxic BOLD response was not significantly different between sickle cell disease patients, non-sickle anemic patients and healthy controls. Therefore, our results suggest that chronically anemic patients do not have increased oxygen extraction fraction from inadequate resting oxygen delivery under resting conditions.
Introduction
Hyperoxia is a popular medical technique employed in the emergency room for cases of stroke,
cardiac arrest, respiratory failure and major trauma.1 It is also frequently used in MR brain
studies to investigate cerebral metabolic rates2 and oxygen extraction.3 The addition of 100%
oxygen increases oxygen content by approximately 7% in patients with normal hemoglobin levels and 11% in patients with chronic anemia syndromes such as sickle cell disease or
thalassemia. If there are brain regions with flow limitation and higher oxygen extraction (OEF) under baseline conditions, hyperoxia would be expected to increase BOLD signal to a greater degree than normally perfused brain tissue. Therefore, in this study, we used a hyperoxic challenge to determine whether patients with chronic anemia syndromes are flow-limited under resting conditions.
Methods
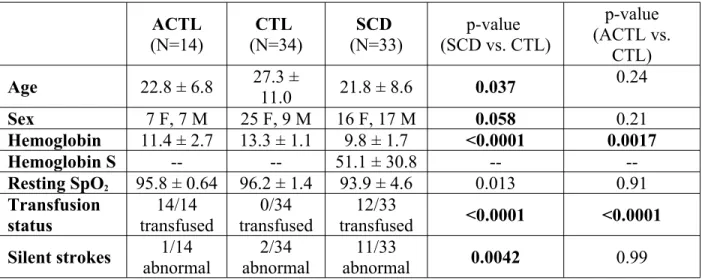
A total of 82 subjects were studied; the demographics and hematologic results are detailed in Table 1. All subjects underwent an MR study using Philips 3T Achieva with an 8-element head coil accompanied by complete blood work.
MR acquisition: For each subject, anatomical 3D T1 MR and BOLD MR were acquired.
Anatomical 3D T1-weighted images were acquired with the following parameters: TR = 8.20ms, TE = 3.77ms, flip angle = 8°, in-plane resolution = 1mm × 1mm, FOV = 256mm × 256mm, 160 slices and slice thickness = 1.0mm. BOLD images: TR = 2000ms, TE = 50ms, flip angle = 90°, in-plane resolution = 2.3mm × 2.3mm, FOV = 220mm × 220mm, 26 axial slices, slice thickness = 5mm and 150 volumes.
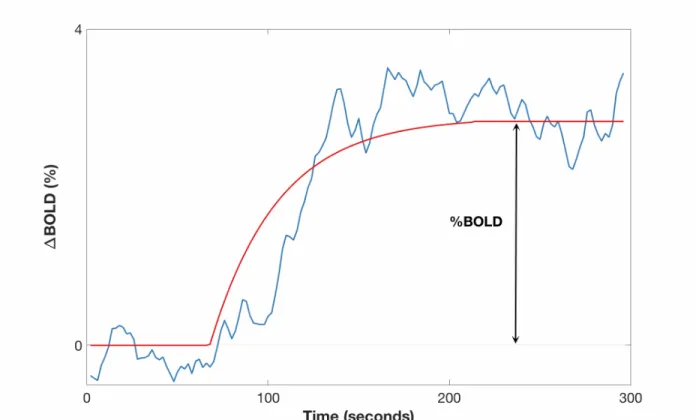
Hyperoxia challenge: At the start of the BOLD experiment, patients wore a breathing mask connected to a source of pressurized room air. After 50 seconds, the breathing circuit was switched to 100% oxygen gas until the end of the experiment.
Image processing: The BOLD datasets were pre-processed with FMRIB Software library (FSL)
with a pipeline described elsewhere.4 Ratio in individual normalized BOLD signal between
hyperoxia and normoxia was computed as illustrated in Figure 1. For linear regressions and statistical analyses, Ratiohyperoxia was log-transformed to ensure a normal distribution.
Results
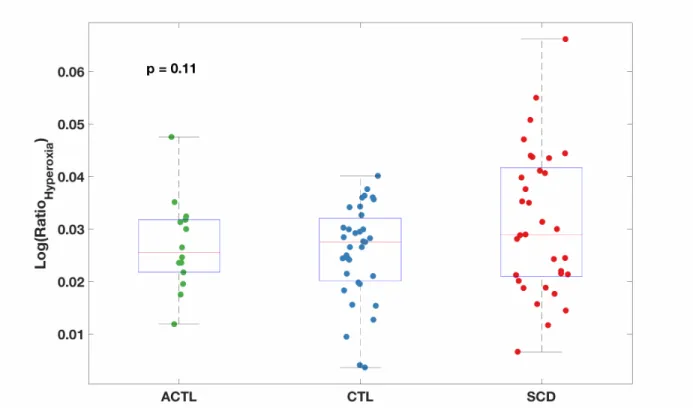
There was no statistically significant difference in BOLD hyperemic response between the three participating groups (p = 0.11). Hyperemic response was significantly higher in the grey matter than the white matter, while external veins exhibited the largest BOLD changes.
Significant correlation was observed between Ratiohyperoxia and SpO2 in Figure 2 (r2 = 0.10,
p = 0.0072). After regressing SpO2 from our model, the residuals did not show any
between-group difference (p = 0.26) as shown in Figure 3. The residuals were also independent of sex, age, transfusion status, cell-free hemoglobin and all components of the complete blood count on univariate regressions.
Discussion
We used a hyperoxic challenge to probe for evidence of increased OEF in chronically anemic patients. Published works have validated increased OEF in flow-limited conditions such
as in carotid artery stenosis5 as a compensation mechanism for impaired oxygen carrying
capacity. Therefore, if SCD patients were flow-limited with increased OEF under resting conditions, we would have expected the hyperoxic BOLD effect to be larger in SCD subjects.
However, our results demonstrated no significant difference in the hyperoxic effect
between SCD and control subjects after controlling for SpO2. Therefore, our results were not
consistent with previous reports suggesting increased OEF in SCD.6 Additionally, our results
also did not support previous hyperoxia experiments done in mice.7 However, these experiments
did not control for the differences in oxygen saturation changes in response to hyperoxia. In our
study, most of the hyperoxic difference could be explained by a lower resting SpO2 in the SCD
subjects,8 so correcting for saturation was necessary to disentangle the OEF effect from the
saturation effect. The differences in resting SpO2 could be secondary to right shift in the
hemoglobin dissociation curve or lung disease, both of which are relatively common in SCD patients.
In conclusion, we were unable to demonstrate evidence of increased OEF and flow limitations under resting conditions for SCD and chronically anemic patients. 100% oxygen does not appear to provide a useful imaging contrast, in contrast to carbon dioxide challenges.
Acknowledgements
This work is supported by the National Heart Lung and Blood Institute
(1RO1HL136484-A1, 1U01HL117718-01), the National Institute of Clinical Research Resources (UL1 TR001855-02) and by research support in kind from Philips Healthcare.
Figure 1: Representative global BOLD time course (blue) and the least-squares fit (red) during the hyperoxia challenge. Percent signal change BOLD was computed as the percent difference between the initial baseline and the stable value during hyperoxia.
Figure 2: The significant correlation between BOLD and SpO2 shows a large fraction of the
hyperoxic response was derived from the change in resting arterial saturation during 100% oxygen inhalation.
Figure 3: Group mean maps for the hyperoxic BOLD effect show similar grey matter – white matter differentiation in all three subject groups.
Figure 4: Boxplot of percent signal change log-transformed Ratiohyperoxia shows no significant
ACTL (N=14) (N=34)CTL (N=33)SCD (SCD vs. CTL)p-value p-value (ACTL vs. CTL) Age 22.8 ± 6.8 27.3 ± 11.0 21.8 ± 8.6 0.037 0.24 Sex 7 F, 7 M 25 F, 9 M 16 F, 17 M 0.058 0.21 Hemoglobin 11.4 ± 2.7 13.3 ± 1.1 9.8 ± 1.7 <0.0001 0.0017 Hemoglobin S -- -- 51.1 ± 30.8 -- --Resting SpO2 95.8 ± 0.64 96.2 ± 1.4 93.9 ± 4.6 0.013 0.91 Transfusion status 14/14 transfused 0/34 transfused 12/33 transfused <0.0001 <0.0001 Silent strokes 1/14 abnormal 2/34 abnormal 11/33 abnormal 0.0042 0.99
Table 1: Patient demographics and hematologic marker results.
References
1. O’Driscoll R. Emergency oxygen use. BMJ. 2012;345:e6856. doi:10.1136/bmj.e6856
2. Chiarelli PA, Bulte DP, Wise R, Gallichan D, Jezzard P. A calibration method for
quantitative BOLD fMRI based on hyperoxia. 2007. doi:10.1016/j.neuroimage.2007.05.033
3. Merola A, Murphy K, Stone AJ, et al. Measurement of oxygen extraction fraction (OEF):
An optimized BOLD signal model for use with hypercapnic and hyperoxic calibration.
Neuroimage. 2016;129:159-174. doi:10.1016/J.NEUROIMAGE.2016.01.021
4. Coloigner J, Phlypo R, Coates TD, Lepore N, Wood JC. Graph Lasso-Based Test for
Evaluating Functional Brain Connectivity in Sickle Cell Disease. Brain Connect. 2017;7(7):443-453. doi:10.1089/brain.2016.0474
5. Derdeyn CP, Yundt KD, Videen TO, Carpenter DA, Grubb RL, Powers WJ. Increased
oxygen extraction fraction is associated with prior ischemic events in patients with carotid occlusion. Stroke. 1998;29(4):754-758. http://www.ncbi.nlm.nih.gov/pubmed/9550507. Accessed November 7, 2018.
6. Jordan LC, Gindville MC, Scott AO, et al. Non-invasive imaging of oxygen extraction
fraction in adults with sickle cell anaemia. Brain. 2016;139(3):738-750. doi:10.1093/brain/awv397
7. Kennan RP, Suzuka SM, Nagel RL, Fabry ME. Decreased cerebral perfusion correlates
with increased BOLD hyperoxia response in transgenic mouse models of sickle cell disease. Magn Reson Med. 2004;51(3):525-532. doi:10.1002/mrm.20014
8. Quinn CT, Sargent JW. Daytime steady-state haemoglobin desaturation is a risk factor for
overt stroke in children with sickle cell anaemia. Br J Haematol. 2008;140(3):336-339. doi:10.1111/j.1365-2141.2007.06927.x