HAL Id: hal-02981649
https://hal.archives-ouvertes.fr/hal-02981649
Submitted on 18 Dec 2020
HAL is a multi-disciplinary open access
archive for the deposit and dissemination of
sci-entific research documents, whether they are
pub-lished or not. The documents may come from
teaching and research institutions in France or
abroad, or from public or private research centers.
L’archive ouverte pluridisciplinaire HAL, est
destinée au dépôt et à la diffusion de documents
scientifiques de niveau recherche, publiés ou non,
émanant des établissements d’enseignement et de
recherche français ou étrangers, des laboratoires
publics ou privés.
Floristic evidence for alternative biome states in tropical
Africa
Julie Aleman, A. Fayolle, C. Favier, A. Staver, K. Dexter, C. Ryan, A.
Azihou, D. Bauman, M. Te Beest, E. Chidumayo, et al.
To cite this version:
Julie Aleman, A. Fayolle, C. Favier, A. Staver, K. Dexter, et al.. Floristic evidence for alternative
biome states in tropical Africa. Proceedings of the National Academy of Sciences of the United States
of America , National Academy of Sciences, 2020, 117, pp.202011515. �10.1073/pnas.2011515117�.
�hal-02981649�
1
Floristic evidence for alternative biome states in tropical
Africa
J. C. Aleman1,2, A. Fayolle1, C. Favier3, A. C. Staver4, K. G. Dexter5,6, C. M. Ryan5, A. F. Azihou7, D.
Bauman8,9, M. te Beest10,11,12, E. N. Chidumayo13, J. A. Comiskey14,15, J. P. G. M. Cromsigt10,11,16, H.
Dessard17,18, J-L. Doucet1, M. Finckh19, J-F. Gillet1, S. Gourlet-Fleury17,18, G. P. Hempson20, R. M. Holdo21,
B. Kirunda22, F. N. Kouame23, G. Mahy1, F. Maiato P. Gonçalves24, I. McNicol5, P. Nieto Quintano5, A. J.
Plumptre22,25,26, R. C. Pritchard5,27, R. Revermann19,28, C. B. Schmitt29,30, A. M. Swemmer31, H. Talila32, E.
Woollen5, M. D. Swaine33
PNAS 2020 117 (45) 28183-28190 https://doi.org/10.1073/pnas.2011515117
1 Gembloux Agro-Bio Tech, Université de Liège, Passage des Déportés 2, 5030 Gembloux, Belgium. 2 Département de Géographie, Université de Montréal, Montréal (Québec), H2V 0B3, Canada. 3 ISEM, Université de Montpellier, CNRS, EPHE, IRD, 34000 Montpellier, France.
4 Department of Ecology and Evolutionary Biology, Yale University, New Haven, CT 06520, USA. 5 School of GeoSciences, University of Edinburgh, Edinburgh, EH8 9YL, UK.
6 Royal Botanic Garden Edinburgh, Edinburgh, EH3 5LR, UK.
7 Laboratory of Applied Ecology, Faculty of Agronomic Sciences, University of Abomey-Calavi, Cotonou, Benin.
8 Environmental Change Institute, School of Geography and the Environment, University of Oxford, Oxford, OX1 3QY, UK. 9 Plant Ecology and Biogeochemistry, Université Libre de Bruxelles, 1050 Bruxelles, Belgium.
10 Copernicus Institute of Sustainable Development, Utrecht University, 3584 CS Utrecht, The Netherlands. 11 Centre for African Conservation Ecology, Nelson Mandela University, Port Elizabeth, 6031, South Africa. 12 South African Environmental Observation Network, Pietermaritzburg, 3201, South Africa.
13 Makeni Savanna Research Project, PO Box 50323, Ridgeway, Lusaka, Zambia.
14 Inventory and Monitoring Program, National Park Service, Fredericksburg, Virginia, 22405, USA. 15 Smithsonian Institution, Washington, DC 20002, USA.
16 Department of Wildlife, Fish, and Environmental Studies, Swedish University of Agricultural Sciences, Skogsmarksgränd, SE-901 83, Umeå, Sweden.
17 Forêts et Sociétés, Université de Montpellier, Cirad, 34000 Montpellier, France. 18 Cirad, Forêts et Sociétés, 34398 Montpellier, France.
19 Biodiversity, Evolution and Ecology of Plants, Institute of Plant Science and Microbiology, University of Hamburg, 22609 Hamburg, Germany.
20 Centre for African Ecology, School of Animal, Plant and Environmental Sciences, University of the Witwatersrand, Johannesburg, 2000, South Africa.
21 Odum School of Ecology, University of Georgia, Athens, GA 30602, USA. 22 Wildlife Conservation Society, Kampala, Uganda.
23 University Nangui Abrogoua, Nature Sciences Unit, 31 BP 165 Abidjan, Côte d’Ivoire.
24 Herbário do Lubango, ISCED – Huíla, Rua Sarmento Rodrigues No. 2, C.P. 230, Lubango, Angola. 22 Head KBA Secretariat, c/o BirdLife International, Cambridge, CB2 3QZ, UK.
25 Conservation Science Group, Zoology Department, Cambridge University, Cambridge, CB2 3EJ, UK. 27 Global Development Institute, University of Manchester, Manchester, M13 9PL, UK
28 Faculty of Natural Resources and Spatial Sciences, Namibia University of Science and Technology, Windhoek, Namibia. 29 Center for Development Research (ZEF), University of Bonn, 53113 Bonn, Germany.
30 Nature Conservation and Landscape Ecology, University of Freiburg, 79106 Freiburg, Germany. 31 South African Environmental Observation Network, Phalaborwa, 1389, South Africa.
32 Department of Ecotourism and Biodiversity Conservation, College of Agriculture and Natural Resource, Madda Walabu University, Bale Robe, Ethiopia.
33 Institute of Biological and Environmental Sciences, University of Aberdeen, Aberdeen, AB24 3FX, UK.
Keywords: Alternative stable states | Tropical biomes | Tree species composition | Precipitation and
2
Abstract: The idea that tropical forest and savanna are alternative states is crucial to how we manage these
biomes and predict their future under global change. Large-scale empirical evidence for alternative stable states is limited however and comes mostly from the multimodal distribution of structural aspects of vegetation. These approaches have been criticized, as structure alone cannot separate out wetter savannas from drier forests for example, and there are also technical challenges to mapping vegetation structure in unbiased ways. Here, we develop an alternative approach to delimit the climatic envelope of the two biomes in Africa, using tree species lists gathered for a large number of forest and savanna sites distributed across the continent. Our analyses confirm extensive climatic overlap of forest and savanna, supporting the alternative stable states hypothesis for Africa, and this result is corroborated by paleo-ecological evidence. Further, we find the two biomes to have highly divergent tree species compositions and to represent alternative compositional states. This allowed us to classify tree species as forest vs savanna specialists, with some generalist species that span both biomes. In conjunction with geo-referenced herbarium records, we mapped the forest and savanna distributions across Africa and quantified their environmental limits, which are primarily related to precipitation and seasonality, with a secondary contribution of fire. These results are important for the ongoing efforts to restore African ecosystems, which depend on accurate biome maps to set appropriate targets for the restored states, but also provide novel empirical evidence for broad scale bistability.
Significance statement: We develop a biogeographic approach to analyzing the presence of alternative
stable states in tropical biomes. Whilst forest-savanna bistability has been widely hypothesized and modeled, empirical evidence has remained scarce and controversial, and here, applying our method to Africa, we provide large scale evidence that there are alternative states in tree species composition of tropical vegetation. Furthermore, our results have produced novel and more accurate maps of the forest and savanna distributions in Africa, which takes into account differences in tree species composition, and a complex suite of determinants. This result is not only important for understanding the biogeography of the continent, but also to guide large-scaled tree planting and restoration efforts planned for the region.
Introduction
Tree cover and canopy openness are commonly used to differentiate tropical forests and savannas, but the difference between the two biomes is not just a matter of structure (1). Whereas tropical moist forests form a closed canopy with a complex vertical structure, savannas are more open, allowing fire- and drought-adapted grasses to grow in the understory. Typically, forest dominates in wetter areas while savannas occur in drier, seasonal areas (1, 2), although transitions between forest and savanna are not rigidly determined by climate (2–4). Soils and topography can be locally and regionally important, but at intermediate rainfall (between 1,000-2,500 mm globally), forest and savanna, both widespread, potentially represent alternative stable states maintained by feedbacks between tree cover and disturbances —specifically fire (3, 5–7) and chronic herbivory (8). As a result, forest and savanna tree species show contrasting adaptations (9, 10), and transitions across the forest-savanna boundary are characterized by high species turnover (10, 11).
Despite these functional and floristic differences, most recent efforts devoted to understanding forest-savanna transitions have relied solely on information about the canopy structure, whether using satellite-based maps of percent tree cover (3, 5, 6, 12), canopy height (13), or using field data on tree basal area (14). However, these studies have two types of shortcomings. The first type is linked to the use of remote sensing products which are ill-suited to capture the structural difference between savanna and forest. Most tree cover products are parameterized to identify trees greater than 5 m in height (15, 16) and their spatial resolution is not sufficient to correctly characterize vegetation structure. Even though Landsat-based tree cover is available at 30 m resolution and MODIS tree cover at 250 m, the accuracy of these
3 products is low in open systems (16), and although it increases with spatial aggregation, it then fails to represent the fine-scale heterogeneity characteristic of savanna. Moreover, the tree cover threshold used to differentiate forest from savanna seems to depend strongly on calibration, with higher thresholds (75%) for Landsat tree cover (12) and lower (55-65%) for MODIS tree cover (3, 17). The second type of shortcomings is even more important since defining forest and savanna using only canopy structure misses key aspects of forest vs savanna function tied to differences in the structure of the grass layer and in the tree species composition (1). The relatively open canopies of drier forests can be structurally similar to those of wetter savannas (18) but are not separable with a structural approach, even though the two differ dramatically in terms of species composition and ecosystem function (19). Also, systems with similar physiognomies can have different histories, reflecting human land-use practices and recent disturbances (12). For instance, forests subjected to human disturbances (such as clearing) can appear more like savannas, while some practices (particularly fire suppression) can make savannas appear more like forests (19, 20).
Biodiversity data available for sub-Saharan Africa (21–23) and for tropical Africa (24–27), offer new opportunities to differentiating and mapping the tropical forest and savanna biomes at continental scale. Here, we delineate the distribution of forest and savanna, and test for forest-savanna bistability, using a biogeographic approach, which reflects the evolutionary history and ecology of each biome, and does not rely on any structural metrics. We combined data on native tree species for sites identified earlier as forest (ref 26, n=455) and savanna (ref 27, n=298) and covering the full extent of these biomes in Africa (28). Each site consists of a species list assigned to either forest or savanna by the original authors or by the data contributors who conducted the floristic surveys according to vegetation structure, species composition and/or ecosystem functioning (see Materials and methods). We used tree species composition from these 753 floristic surveys to determine the climatic envelopes of the forest and savanna biomes (and their overlap) and to analyze the differences in tree species composition between them. We then used georeferenced herbarium collections (24, 25) to expand the floristic information spatially and describe the complete distribution of forest and savanna across Africa, and to identify the determinants of their present day distribution.
Extensive climatic overlap of forest and savanna in Africa
Alongside the expected patterns of forest in wetter areas and savanna in drier and more seasonal ones (1, 2), also retrieved here (Fig. 1A and SI Appendix, Fig. S1), we found an extensive climatic area (Fig. 1B-C, S2) within which both forest and savanna sites are widespread, which we term the ‘bistable’ region. Mean Annual Precipitation (MAP) partly differentiates the forest, the bistable region, and the savanna; although the climatic gradient used to determine and map them is more complex and integrates precipitation and seasonality (see Materials and methods for the details of the Principal Component Analysis on gridded climate data). We find a large extent of forest, 1.8 million km², covering almost the whole Guineo-Congolian Region (Fig. 1D), in line with the stability of forest in Lower Guinea suggested over the last two millennia by pollen records (29), but challenging previous findings of bistability across the entire Congo basin (3). Savanna was found to occupy the majority of the areas north, east and south of the Congo Basin, under drier and more seasonal conditions, and totaling almost 8.4 million km². The savanna notably includes the west coast of southern Africa (Fig. 1D), which contrasts with description of this area as thicket, scrub or bush land (28). This is due to the presence of northern (Sahel) and eastern (Horn) savanna sites with extremely arid climate in the floristic surveys, which extended the climatic envelope of savanna this far, and also because northern and western savannas are not completely analogous climatically to southern and eastern ones (27).
4
Paleo-ecological evidence
Figure 1. Climatic envelope of the forest and savanna biomes in Africa. To determine the climatic envelopes of the two
tropical biomes, the dominant climatic gradients were first identified with a Principal Component Analysis of gridded climatic variables. (A) Each point corresponds to the center of a 0.5° pixel, with pixels containing floristic surveys in forest (green) and savanna (orange) sites indicated. Red and blue arrows indicate the influence of temperature and precipitation variables, respectively. (B) Distribution of forest (green) and savanna (orange) sites along an axis of mean annual
precipitation (MAP, in mm). (C) Frequency distribution of forest (green) and savanna (orange) sites along a complex precipitation and seasonality gradient (PC1, A), with the climatic area where savanna and forest both occur plotted in light orange (where savanna is more common) and light green (where forest is more common). The dashed line corresponds to an equal probability of savanna and forest. (D) Map of forest and bistable forest, bistable savanna and savanna, with the locations of floristic surveys in forest (green) and savanna (orange) sites. White pixels are outside the geographic extent and/or the environmental range covered by the floristic surveys. The latter was defined by a convex hull on the site scores on PC1 and PC2 (dashed line in A). Major waterbodies and rivers are shown in blue. The paleo-ecological data available around the Gulf of Guinea retrieved from published records of lacustrine fossil pollen (n=24), lacustrine phytoliths (n=1), phytoliths (n=4) and δ13C of soil organic matter (n=14) from soil profiles are shown in inset.
The paleo-sites provided information on stable (black) and transitional (grey) sites during the Holocene (see Dataset S2 for the code correspondence of paleo-sites).
5 Meanwhile, the bistable region covers a vast area of more than 7.5 million km², often described as woodland (28) and spans a broad MAP range (700-1900 mm, SI Appendix, Fig. S2). The bistable region was previously proposed to span a 1,000-2,000 mm MAP range in Africa (6) or, alternately, to extend to drier sites (> 650 mm) in a study restricted to savannas (30) and to wetter sites (1,000-2,500 mm) in the global tropics (3, 12). Our bistable region can be separated into two sub-regions: a wetter region more likely to be forest (hereafter, bistable forest) and a drier and more seasonal one more likely to be savanna (hereafter, bistable savanna). Bistable forest is located in the periphery of the Guineo-Congolian Region, but also includes the Congolese Batéké Plateau and the Dahomey gap, which are currently dominated by savanna. This stresses the importance of factors other than climate in the outcome of forest-savanna bistability. The Batéké Plateau corresponds to the northern limit of the hyper-well-drained relict dunes of the Kalahari sands, while the Dahomey gap is well known to have shifted to savanna between 4,500 and 3,400 years ago following an abrupt climatic change (31). Thus, the predominance of savanna in areas more likely to be forest has arisen either because of soil characteristics (i.e., sandy soils, 30) or the legacy of past climatic changes (29) and/or past disturbances (31, 32).
Long-term paleo-ecological data (from lacustrine and soil cores) around the Gulf of Guinea largely corroborates these areas of biome transition and stability (inset, Fig. 1D). For the bistable region, forest-to-savanna transitions were predominant with 16 transitional vs nine stable sites, while for the forest, stable biome identity was retrieved for ten out of 13 paleo-sites. For the savanna, the stability of savanna vegetation has been demonstrated around Lake Tilla (#21 on the map) in Nigeria (33).
Current fire regime is also an important determinant of savanna distribution worldwide (2, 3, 6), specifically in relatively wetter areas (20, 30), and here we found that bistable savanna is more likely to burn than either forest or bistable forest, and also than savanna (SI Appendix, Fig. S3). The latter is explained by the lower productivity of drier savannas (30), but could also be linked to the presence of semi-desert grasslands (28) in our study area (Sahel, Namib, Kalahari), where the discontinuous grass layer prevent the spread of fires.
African forests and savannas have distinct floristic composition
We found a marked dissimilarity in tree species composition between forest and savanna sites, based on floristic surveys. Pairwise comparisons showed a mean species turnover of 98% between forest and savanna sites, much higher than the turnover within the same biome (SI Appendix, Fig. S4). This result confirms the divergence of the forest and savanna floras (22) and is consistent with the results of plot-based studies of forest-savanna transition in South Africa (10), Ghana (11), and across the tropics (18). Because forest and savanna represent alternative compositional states, we were confident in categorizing tree species into significant indicators of forest, or forest specialists (n=825 species, 48%), and significant indicators of savanna, or savanna specialists (n=523, 31%). Species that were not a significant indicator of either forest or savanna were interpreted as generalists (n=359, 21%). Our group of generalists included true generalists but also rare species or those otherwise rarely represented in the floristic surveys (Fig. 2). Evidence for biome specialization was even stronger when only common species were analyzed (i.e., those present at ≥ 10 sites), with only 8% of common species classified as generalists. It is worth noting that our results for 1,707 tree species represent only a fraction of the c. 45,000 flowering plant species reported for sub-Saharan Africa (34). The specificity of the forest and the savanna flora is therefore likely underestimated, since grasses and forbs were not included, despite being a highly distinctive component of the savanna flora (22). Functionally, though, these results are demonstrative, since the tree flora already captures some functional differences between the forest and savanna biomes (10) but it would be of great interest to extend the analyses to other growth forms to test the patterns observed for trees.
6 The regions described above based on climate (Fig. 1) have distinct compositions (SI Appendix, Fig. S5), assessed using an independent occurrence dataset (Fig. 2; see Materials and
methods) derived from georeferenced herbarium records (24, 25). Forest and bistable forest are composed mainly of forest specialists, and savanna and bistable savanna are composed mainly of savanna specialists. Indeed, forest specialists were found to dominate the Guineo-Congolian Region and its periphery, and to be abundant in East African Mountains (Fig. 2A). Within the Guineo-Congolian Region, Upper and Lower Guinea were better sampled than Congolia, for which herbarium records are sparse, and Upper Guinea includes the warm and wet forest sheltered by the Guinean Highlands in Sierra Leone and Guinea (Conakry). The latter were not included in our mapped extent of forest (Fig. 1D) likely because the floristic surveys we used do not cover this climate zone (positive scores on PC1 and PC2, Fig. 1A). Savanna specialists dominate in the north and west of Africa, including the Dahomey gap, and in the east and south (Fig. 2C). Interestingly, generalist species were found to be widespread and present within each region, and while they are more frequent in the bistable region, the difference is small (SI Appendix, Fig. S5B) and generalists almost never dominate (Fig. 2B and SI Appendix, Fig. S6).
Savanna-forest co-existence is possible, but restricted spatially
Based on a biome index, indicating the relative dominance of savanna (-1) and forest (1) specialists (see Materials and methods), we find that forest-savanna coexistence is limited (Fig. 3) even though the climate envelope where it is possible is large (42.4% of the study area and 25% of the African continent, Fig. 1D). Vast and continuous areas are dominated by the extremes of the biome index, representing either strict savanna or strict forest (SI Appendix, Fig. S7), and these extremes of the biome index correspond to recognized centers of endemism (28), i.e., the Guineo-Congolian Region where forests are predominant, and the Sudanian and Zambezian Regions where savannas and woodlands are predominant, and both have specific floras and faunas (21–
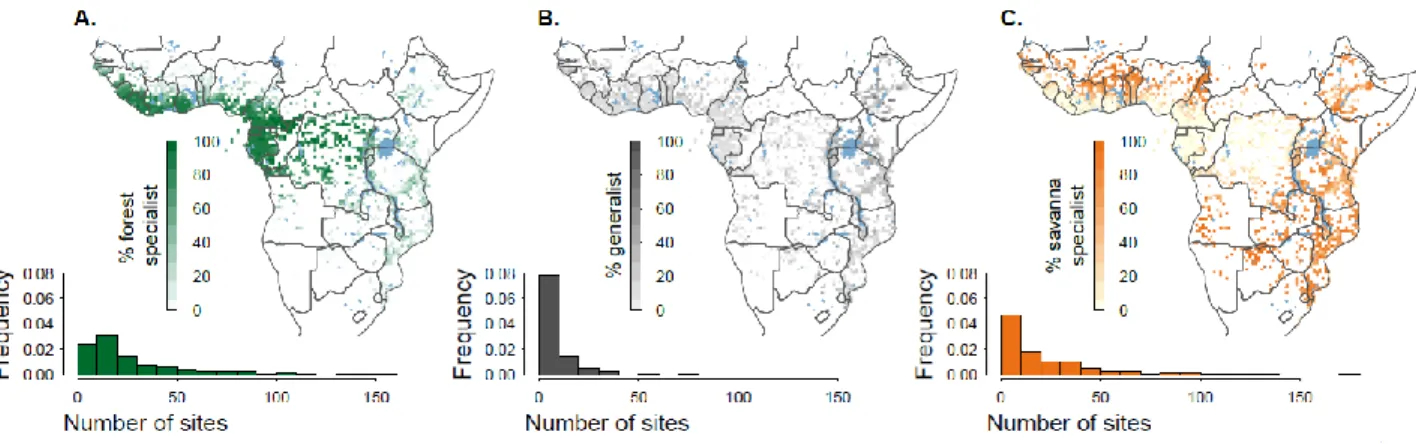
Figure 2. Distribution of forest specialist, generalist, and savanna specialist tree species. To test for
specialization toward the forest and savanna biomes by individual tree species, we applied the IndVal procedure (50) to the presence matrix of the 1,707 species in the 753 sites (455 forest and 298 savanna sites), and obtained a classification of species into forest specialists (n=825 species) and savanna specialists (n=523), with non-significant indicators resulting in species being interpreted as generalists (n=359). For each 0.5° pixel containing herbarium records for at least 5 of our 1,707 species, we computed and mapped the percentage of (A) forest specialists, (B) generalists and (C) savanna specialists. White pixels thus correspond to a paucity of georeferenced herbarium records for our classified tree species. Major waterbodies are shown in blue. The frequency distribution of the number of sites in which (A) forest specialists, (B) generalists, and (C) savanna specialists occurred in the original floristic surveys is given on the bottom of each panel, illustrating the higher frequency of extremely infrequent species in the group of generalist species, in comparison to the specialists.
7 24). In contrast, intermediate values of the biome index, which correspond to the third mode in the frequency distribution (inset, Fig. 3), appear spatially restricted (SI Appendix, Fig. S7). The zones of intermediate biome index, which arise either from frequent generalists (as in East Africa) or from a mixture of forest and savanna specialists elsewhere (Fig. 2B and SI Appendix, Fig. S6), correspond to long recognized transition zones, forest-savanna mosaics (28), and to recently deforested areas (35). A deeper investigation shows however that the possible intermediate state mostly corresponds to data-deficient areas since the tri-modal signal shifted towards a bi-modal signal when including only pixels with at least five or ten of our classified tree species (SI Appendix, Fig. S8). Thus, the floristic surveys (26, 27) combined with georeferenced herbarium records (24, 25) suggest that there are two floristic states in the intact tropical African vegetation.
Finally, we provide estimates of the current distribution of the forest and savanna biomes across the African continent combining both floristic and environmental information (Fig. 4). First, we re-computed the biome index on interpolated species distributions derived from ordinary kriging (SI Appendix, Fig. S9), while accounting for spatial autocorrelation (inset, Fig. 4A). This shows that there is a strong spatial structure for specialist species—whether forest or savanna— while generalist species do not show any spatial structure, suggesting that they do not correspond to an ecologically meaningful third group. We additionally include principle components of climate (PC1 and PC2 from Fig. 1) and soil information (sand percentage and cation exchange capacity), as well as data on fire and herbivory (see Materials and methods for
Figure 3. Spatial distribution of the biome index across Africa. The distributions of forest specialists,
generalists, and savanna specialists derived from georeferenced herbarium records were used to devise a biome index based on tree species composition and computed at 0.5° resolution. The biome index tracks the biome specialization of each pixel, with values toward -1 representing the dominance of savanna specialists and values toward +1 representing the dominance of forest specialists. White pixels correspond to a lack of georeferenced herbarium records for our species. Major waterbodies are shown in blue. The frequency distribution of the biome index is given in inset.
8 the source of the datasets) as potential determinants of the biome index in a random forest regression (Fig. 4B). Topographic and hydrologic factors (e.g., seasonal flooding, topographically mediated frost occurrence or toxic heavy metal concentrations in soils) that are important determinant of mosaic landscapes locally (28) were not included at this continental scale. The predictions of our random forest model on a validation subset of 10% of data pixels were accurate (R²=0.81 with a non-significant intercept and a predicted vs observed slope of 0.82 ± 0.03). This analysis of the joint determinants of both forest and savanna showed that precipitation and seasonality (PC1) are the main determinants of the biome index. Fire and, to a lesser extent, temperature (PC2, which is related to altitude) were also important drivers. Herbivory (including livestock and wild herbivore biomass) and sandy soils were found to have an equivalent and moderate impact, at this continental scale. The environmental model notably predicts a smaller forest area than the interpolated species distribution data (Fig. 4A) and than the raw data (Fig. 2, 3). The latter possibly results from preferential sampling of forest trees in herbarium collections. More importantly, our results support the primary role of precipitation (1, 2), precipitation seasonality (36), and fire (2, 3, 6, 30) in the distribution of both forest and savanna in Africa, while most analyses of the determinants of savanna distribution have so far ignored forest (2, 30). Therefore, the predictions of the random forest (Fig. 4B) should be considered as our best estimate of the current distribution of the forest and savanna biomes across the African continent.
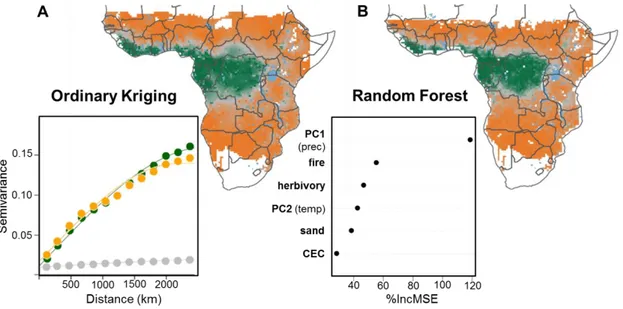
Figure 4. Spatial and environmental predictions of the biome index.We predicted the distribution of the biome
index across the climatic space covered by the floristic surveys using (A) spatial information only vs (B) a random forest approach based on environmental determinants. For the spatial predictions, we interpolated the distribution of the percentage of forest specialists, generalists and savanna specialists using ordinary kriging, and recomputed the biome index. The empirical semi-variogram (points) and the spherical semi-variogram model (lines) used for kriging and shown as inset in (A) indicate that the spatial structure of generalist species is weaker and more homogeneous than that of forest and savanna specialists. For the environmental predictions of the biome index, we used climate (described by PC1 and PC2, Fig. 1A), fire, herbivory (total biomass of both livestock and wild herbivores), and soil factors (described by the percentage of sand and CEC in the first 0-5 cm). The relative importance of each environmental determinant is shown as inset in (B). The importance (% increase in MSE) tests how the accuracy of the results is affected if the input variable is randomly permuted. White pixels in (A) correspond to areas outside the geographical extent and the environmental range covered by the floristic surveys. White pixels in (B) additionally contain pixels for which herbivory data were not available (coastal edge and edge of inland waterbodies). Major waterbodies are shown in blue.
9
Conclusions and practical implications
In this study, we provided evidence for two compositional states across the African continent, alternatively dominated by forest and savanna species. These two states can coexist in a wide range of climates, but our biome index showed that current day spatial co-existence is spatially restricted, with one state or the other dominating over vast areas. This supports the notion that the two biomes are stable alternatives, and, consistent with the predictions of alternative stable state theory, suggests the potential for abrupt shifts in composition under external perturbations such as climate change, or altered fire regimes, as demonstrated by paleo-ecological evidence. With our correlative approach, we were not able to determine the paleo-ecological mechanisms allowing savanna persistence, but the facts that fire is more frequent in the bistable savanna area, and that fire is the second determinant of the biome index after the precipitation and seasonality gradient, support the hypothesis of fire acting as a major feedback mechanism, allowing savanna under climates favorable to forest.
These results are important for the ongoing efforts to restore African ecosystems, which depend on accurate biome maps to set appropriate targets for the restored states. This will help avoid, for example, inappropriate planting of forest trees, or attempts to “restore” forest in savanna areas. Up to now, because of the wide climatic zone where forest and savanna are both widespread, savanna has often been mischaracterized as degraded forest (28, 37) and has been seen as a target for higher carbon storage via afforestation (37, 38). This viewpoint neglects several features of savannas, including their substantial belowground carbon storage (39), their high biodiversity and endemism (40), and their socio-economic value (41). Our biome index map therefore is a useful tool for restoration, as it could help set appropriate species targets, and to identify degraded forest and encroached savanna areas which should be restored using forest and savanna specialists, if needed. Indeed, the current trend within bistable savannas is toward woody encroachment (42) and in this case restoration strategies mainly involve tree-cutting and prescribed fire to restore biodiversity and ecosystem services (43). Conversely, restoring arid savannas to prevent desertification might involve tree and shrub planting (44), and in this case using savanna specialists is and has been warranted. In the spatial extent where both biomes currently coexist, potentially both may be restored but a deeper investigation is needed, for example using long-term data, to determine the baseline biome (45), and human preference should also be considered.
Materials and methods
To delineate the distribution of forest and savanna across the African continent and to identify their underlying determinants, we developed a biogeographic approach consisting of four steps, each testing a specific hypothesis. First, we used the location of specific sites originally classified as forest (26) or savanna (27) to test the forest-savanna bistability, i.e., whether forest and savanna can both occur in areas with similar climates, earlier identified via remote-sensing products at the global (3, 5) and landscape (7) scales. In addition, for a selected area around the Gulf of Guinea with good paleo-ecological data, we tested for historical biome transitions to confirm forest-savanna bistability. Second, we used tree species lists for the same forest and savanna sites to test the biome specialization of the tree species, and to evaluate the overall distinctiveness of forest and savanna tree floras (22). Third, we gridded the geo-referenced herbarium records available for tropical Africa (24, 25), and tested the degree of biome specialization characterizing each pixel, thereby testing the forest-savanna bistability from a floristic perspective. Finally, we used spatial and environmental predictions to delineate the distribution of the forest and savanna biomes at the continental scale and to test the relative influence of climate, fire, herbivory, and soils on the forest and savanna distributions (2, 30).
10 Datasets
(i) Floristic data. We combined native tree species lists for 455 forest (26) and 298 savanna sites (27) across sub-Saharan Africa (Fig. 1D, Dataset S1). Each site consists of a species list assigned to either forest (excluding ‘montane forest’, and ‘thicket’) or savanna (including ‘woodland’) by the original authors or by the data contributors who conducted the floristic surveys. Forest sites corresponded to moist broadleaved forest, though restricted to lowland and terra firme, while savanna sites both included wooded grasslands and woodlands. Indeed, several southern African woodland types, such as Miombo, mopane and Baikiaea woodlands (28), are considered as savannas since they burn regularly and have a relatively continuous grass layer (1, 20). Inclusion of a species list corresponding to either forest or savanna was first based on the definition given in the source according to vegetation structure (savannas do not show closed canopy and have a grass layer) and/or on clear indications of species composition and ecosystem functioning. The combined floristic dataset analyzed consisted of a total of 1,707 species occurring in more than five of our combined forest and savanna sites, belonging to 590 genera and 110 families (Dataset S1). The majority of the species were trees, but some shrubs were included in the savanna sites. The taxonomy was standardized according to the African Plant Database (http://www.ville-ge.ch/musinfo/bd/cjb/africa/recherche.php?langue=an) in January 2018.
To spatially extrapolate the floristic information from our forest and savanna sites, we used independent data of plant species occurrence available online (https://gdauby.shinyapps.io/rainbio/) and assembled in the RAINBIO project (http://rainbio.cesab.org/). These represent the largest ever collation of georeferenced herbarium records for tropical Africa (24, 25).
We additionally gathered information on past vegetation for 42 paleo-ecological sites located around the Gulf of Guinea (Dataset S2) from published records of lacustrine fossil pollen (n=24), lacustrine phytoliths (n=1), and phytoliths (n=4) and δ13C of soil organic matter (n=14) from soil
profiles. We selected records with at least 2,000 years of vegetation history. From the original studies, we identified 20 paleo-sites with stable vegetation during the Holocene, either forest or savanna, and 22 which experienced a biome transition, always from forest to savanna. Two sites, Lakes Bosumtwi and Barombi Mbo, date back to the Last Glacial Maximum (~21,000 years BP), during which the vegetation was probably a mosaic of savanna (identified by an increase in Poaceae) and forest elements.
(ii) Environmental drivers. Our study area corresponded to the geographical extent covered by the floristic surveys, but excluding two extreme sites in the very south (Fort Hare, South Africa) and east (Ogo, Somalia), ending up with latitudes ranging from 28°S to 17.5°N, and longitudes from 17°W to 42.5°E.
To characterize the climatic conditions across the study area, we used the bioclimatic variables from Worldclim version 2 at 0.5° resolution (46), which consist of 19 variables describing precipitation and temperature, and including mean annual temperature (MAT), mean diurnal range (mdrT), isothermality (isoT), temperature seasonality (Tsea), maximum temperature of the warmest month (Twm), minimum temperature of the coldest month (Tcm), temperature annual range (Tar), mean temperature of the wettest quarter (Tweq), mean temperature of the driest quarter (Tdq), mean temperature of the warmest quarter (Twaq), mean temperature of the coldest quarter (Tcq), mean annual precipitation (MAP), precipitation of the wettest month (Pwm), precipitation of the driest month (Pdm), precipitation seasonality (Psea), precipitation of the wettest quarter (Pweq), precipitation of the driest quarter (Pdq), precipitation of the warmest quarter (Pwaq), and precipitation of the coldest quarter (Pcq).
Beyond climate, we also considered disturbance, specifically fire and chronic herbivory (herbivore biomass), and soils (sand percentage and cation exchange capacity) because they have been identified as determinants of savanna distribution (2, 30). Estimates of fire frequency were
11 derived from the burned area product from Moderate Resolution Imaging Spectroradiometer Active Fire (MODIS) data at 1-km resolution (47) over the 2003-2012 period. Current-day estimates of herbivore biomass at 0.5° resolution across the African continent included livestock and also historical wild herbivore biomass filtered by landscape change indices (48). In this map, originally developed at 1° resolution excluding grid cells with > 50 % in inland water bodies, and then later refined at 0.5° resolution, there is no information for a large edge along the coast and around inland waterbodies. Among available soil variables at 250-m resolution for sub-Saharan Africa (https://soilgrids.org/), we retained the percentage of sand and the cation exchange capacity in the top layer (0-5 cm) of soil (49). Soil variables were first projected and resampled to fit the 0.5° resolution.
The Global Lakes and Wetlands Database (GLWD,
https://www.worldwildlife.org/pages/global-lakes-and-wetlands-database) was used to map major waterbodies, including lakes (GLWD-1) and rivers (GLWD-2).
Data analyses
(i) Climatic envelope of forest and savanna. To detect the major climatic gradients over the entire study area, we performed a Principal Components Analysis (PCA) on the matrix of climate variables at 0.5° resolution (Fig. 1 and SI Appendix, Fig. S1). On the factorial plane defined by the first two Principal Components (PC1 and PC2), the pixels containing floristic surveys were colored and the climatic space they cover was defined by a convex hull (Fig. 1A). The first climatic gradient (PC1, describing 42.3% of the total variance) is characterized primarily by variation in precipitation, and by seasonality of precipitation and of temperature (Fig. 1A and SI Appendix, Fig. S1), and differentiates forest and savanna sites. The second climatic gradient (PC2, 31.1% of variance) is driven by temperature (Fig. 1A), and differentiates northern and western savannas from southern and eastern savannas and woodlands (SI Appendix, Fig. S1C), which are generally found at higher altitudes (28) and thereby exposed to colder climates (27), except for coastal plains (e.g., in Mozambique).
Tropical forest and savanna have been shown to co-occur within the same MAP range (3, 5, 6), which was also apparent along PC1, the more complex climatic gradient integrating precipitation and seasonality (Fig. 1A, C). We defined this climatic space as the region of potential bistability, or ‘bistable’ region, because forest and savanna are both widespread, and because the stability over time has been previously demonstrated through mechanistic modelling (6). Because of the non-uniform distribution of sites along PC1, we sub-sampled the sites with a stratified random sampling by taking, with replacement, 20 sites for each bin of 0.1 units PC1 (i.e., 20 samples with PC1 between -4 and -3.9, and so on). Numerically, the bistable region was defined as the region over which the slope in the frequency of the two biomes at each point over PC1 exceeded the mean of the slope averaged over the entire range (SI Appendix, Fig. S2A). In practice, we plotted the frequency of forest and savanna sites along PC1, and computed the slope of these curves for each PC1 bin. The slopes were averaged for the entire PC1 range. The bistable region was then defined as the area of the plot for which individual slopes are above the average. We found that forest and savanna sites coexist between PC1 values of 0.141 and 4.235 (Fig. 1C), and that their frequency distribution is equal to 0.5 for a PC1 value of 1.943, such that below this value, the probability of savanna occurring is higher than the probability of forest, and vice versa.
After defining these thresholds, we mapped the potential biomes based on gridded climatic variables, but we restricted our spatial predictions to the geographic extent and to the climate space covered by the floristic surveys. The latter was defined with a convex hull on the site scores along PC1 and PC2 (Fig. 1A). Predictions were thus not possible for some mountain areas in eastern Africa and for a large area in southern Africa corresponding to (semi-desert) grasslands (28). First, savanna, is defined as having values of PC1 < 0.141, and forest is defined as having PC1 ≥ 4.235 (Fig. 1C and SI Appendix, Fig. S2A). Then, within the bistable region, bistable savanna,
12 which corresponds to a greater probability of savanna in the climatic space of co-occurrence (Fig. 1C), is defined by 0.141 ≤ PC1 < 1.943 and bistable forest, which corresponds to a greater probability of forest in the climatic space of co-occurrence, is defined by 1.943 ≤ PC1 < 4.235. Finally, for clarity and comparison with earlier results, we conducted the same analysis with MAP, sampling 20 sites for each MAP bin of 50 mm (SI Appendix, Fig. S2B), and found a range of 700-1900 mm for the bistable region (SI Appendix, Fig. S2C).
To confirm the forest-savanna bistability we mapped the paleo-ecological evidence of biome transitions (Dataset S2). To specifically test whether the bistable region is more likely to burn than the other potential biomes, we computed mean fire frequency for each potential biome (SI Appendix, Fig. S3). The latter analysis was performed both at the pixel- and at the site-scale. (ii) Floristics of forest and savanna. We first computed the overall dissimilarity in tree species composition between all pairs of forest and savanna sites (SI Appendix, Fig. S4), using the Simpson index of beta-diversity (βsim), which is known to be richness-independent. We then
performed the IndVal procedure (50) on the presence matrix of the 1,707 native tree species encountered in the 455 forest sites and the 298 savanna sites. This allowed us to identify significant indicators for categorizing species as forest or savanna specialists, or generalists (= no significant indicators, Dataset S3). We further applied this classification of our 1,707 tree species on an independent dataset of species occurrence derived from georeferenced herbarium records (24, 25). We computed the number (and percentage) of forest specialists, generalists, and savanna specialists per pixel of the 0.5° resolution grid representing our study area (Fig. 2).
We verified the concordance between the potential biomes derived from climate, and the species composition in terms of percentage of forest specialists, generalists, and savanna specialists (SI Appendix, Fig. S5). We used Kruskal-Wallis tests to compare each pair of potential biomes (forest and bistable forest, bistable savanna and savanna), and specifically test whether the bistable region is more composed of generalist species, or is a mix of forest and savanna specialist species.
(iii) Spatial distribution of the biome index. The spatial distributions of our forest specialists, generalists, and savanna specialists were then integrated into a biome index at the scale of 0.5° pixel (Fig. 3), with the following formula:
biome index = #𝑠𝑝 𝑓𝑜𝑟 + #𝑠𝑝 𝑠𝑎𝑣 + #𝑠𝑝 𝑔𝑒𝑛#𝑠𝑝 𝑓𝑜𝑟 − #𝑠𝑝 𝑠𝑎𝑣
where #sp for is the number of forest specialists, #sp sav the number of savanna specialists, and #sp gen the number of generalist species in each pixel. The biome index tracks the specialization of each pixel, with values toward -1 representing the dominance of savanna specialists, and values toward +1 representing the dominance of forest specialists.
To further examine the underlying composition of the biome index, and to specifically test whether the intermediate values of the biome index rather correspond to more generalist species or to a mix of forest and savanna specialists, we used spline regressions between the percentage of each of the three species groups and the biome index (SI Appendix, Fig. S6). Since the frequency distribution of the biome index was found to be slightly tri-modal (inset, Fig. 3), we mapped the three states: the savanna state, the intermediate state, and the forest state, using different thresholds on the biome index (SI Appendix, Fig. S7). Finally, to examine the effect of herbarium record availability, we constructed the map of the biome index for pixels containing at least five or ten of our species and showed the associated frequency distribution (SI Appendix, Fig. S8).
(iv) Spatial and environmental predictions of the biome index. Because species occurrences were missing in remote and/or undersampled areas (Fig. 3), we re-computed our biome index (Fig. 4A) from spatially interpolated values of the percentage of forest specialists, generalists and savanna
13 specialists using ordinary kriging (SI Appendix, Fig. S9A-C). The spherical autocorrelation function provided a good fit to the experimental variograms (inset, Fig. 4A). We evaluated the spatial accuracy of the kriged map outside the pixels containing herbarium records of our study species by computing confidence intervals from the variance of the predictions (SI Appendix, Fig. S9D-F).
We also used a random forest approach to identify the environmental determinants of the biome index, and to map the biome index according to climate (described by PC1 and PC2, Fig. 1A, S1), fire (SI Appendix, Fig. S3), herbivory, and soil factors (described by the percentage of sand and CEC in the top 0-5 cm). For the random forest, our dataset corresponded to the pixels containing at least 5 of our 1,707 species and with available data for all environmental determinants. We kept 10% of the dataset for validation (n=169 pixels) and fit the random forest model on a calibration dataset (n=1,523 pixels). We also examined the importance of each environmental determinant, which measures how the accuracy of the results is affected if the input variable is randomly permuted.
All the analyses were performed within the open source R environment (51) using the raster package (52) for raster constructions and most spatial analyses. The ade4 package (53) was used for the PCA and the dismo package (54) for the convex hull. The vegan package (55) was used for the dissimilarity analysis and the labdsv package (56) for computing species indicator values (and significance) for each biome. The gstat package (57) was used for the spatial interpolation by ordinary kriging, while the RandomForest package (58) for the Random Forest regression used to identify the environmental determinants and to provide environmental predictions.
Acknowledgments: We warmly thank all the members of the Tropical Forestry group in Gembloux
Agro-Bio Tech, University of Liège, not listed as co-authors of the study. This work was funded by the Belgian Science Policy (BR/143/A3/HERBAXYLAREDD, A.F) and the Natural Environment Research Council (NE/P008755/1, C.M.R. and K.G.D.). D.B. received support from Fondation Wiener-Anspach.
References
1. J. Ratnam, et al., When is a ‘forest’ a savanna, and why does it matter? Glob. Ecol. Biogeogr. 20, 653–660 (2011).
2. C. E. Lehmann, S. A. Archibald, W. A. Hoffmann, W. J. Bond, Deciphering the distribution of the savanna biome. New Phytol. 191, 197–209 (2011).
3. A. C. Staver, S. Archibald, S. A. Levin, The global extent and determinants of savanna and forest as alternative biome states. Science 334, 230–232 (2011).
4. P. L. Silva de Miranda, et al., Using tree species inventories to map biomes and assess their climatic overlaps in lowland tropical South America. Glob. Ecol. Biogeogr. 27, 899–912 (2018).
5. M. Hirota, M. Holmgren, E. H. V. Nes, M. Scheffer, Global Resilience of Tropical Forest and Savanna to Critical Transitions. Science 334, 232–235 (2011).
6. A. C. Staver, S. Archibald, S. Levin, Tree cover in sub-Saharan Africa: Rainfall and fire constrain forest and savanna as alternative stable states. Ecology 92, 1063–1072 (2011).
7. C. Favier, et al., Abrupt shifts in African savanna tree cover along a climatic gradient. Glob. Ecol.
Biogeogr. 21, 787–797 (2012).
8. G. P. Hempson, S. Archibald, J. E. Donaldson, C. E. Lehmann, Alternate Grassy Ecosystem States Are Determined by Palatability–Flammability Trade-Offs. Trends Ecol. Evol. 34, 286–290 (2019).
9. W. A. Hoffmann, et al., Ecological thresholds at the savanna-forest boundary: how plant traits, resources and fire govern the distribution of tropical biomes. Ecol. Lett. 15, 759–768 (2012).
10. T. Charles-Dominique, A. C. Staver, G. F. Midgley, W. J. Bond, Functional differentiation of biomes in an African savanna/forest mosaic. South Afr. J. Bot. 101, 82–90 (2015).
14 11. M. D. Swaine, J. B. Hall, J. M. Lock, The forest-savanna boundary in west-central Ghana. Ghana J. Sci.
16, 35–52 (1976).
12. J. C. Aleman, A. C. Staver, Spatial patterns in the global distributions of savanna and forest. Glob. Ecol.
Biogeogr. 27, 792–803 (2018).
13. C. Xu, et al., Remotely sensed canopy height reveals three pantropical ecosystem states. Ecology 97, 2518–2521 (2016).
14. V. de L. Dantas, M. Hirota, R. S. Oliveira, J. G. Pausas, Disturbance maintains alternative biome states.
Ecol. Lett. 19, 12–19 (2016).
15. M. C. Hansen, et al., Towards an operational MODIS continuous field of percent tree cover algorithm: examples using AVHRR and MODIS data. Remote Sens. Environ. 83, 303–319 (2002).
16. M. C. Hansen, et al., High-Resolution Global Maps of 21st-Century Forest Cover Change. Science 342, 850–853 (2013).
17. J. C. Aleman, O. Blarquez, C. A. Staver, Land-use change outweighs projected effects of changing rainfall on tree cover in sub-Saharan Africa. Glob. Change Biol. 22, 3013–3025 (2016).
18. M. Torello-Raventos, et al., On the delineation of tropical vegetation types with an emphasis on forest/savanna transitions. Plant Ecol. Divers. 6, 101–137 (2013).
19. J. W. Veldman, Clarifying the confusion: old-growth savannahs and tropical ecosystem degradation.
Philos. Trans. R. Soc. B Biol. Sci. 371, 20150306 (2016).
20. C. P. Osborne, et al., Human impacts in African savannas are mediated by plant functional traits. New
Phytol. (2018) https:/doi.org/10.1111/nph.15236 (June 1, 2018).
21. H. P. Linder, et al., The partitioning of Africa: statistically defined biogeographical regions in sub‐ Saharan Africa. J. Biogeogr. 39, 1189–1205 (2012).
22. H. P. Linder, The evolution of African plant diversity. Front. Ecol. Evol. 2, 38 (2014).
23. G. P. Hempson, S. Archibald, W. J. Bond, A continent-wide assessment of the form and intensity of large mammal herbivory in Africa. Science 350, 1056–1061 (2015).
24. V. Droissart, et al., Beyond trees: Biogeographical regionalization of tropical Africa. J. Biogeogr. 45, 1153–1167 (2018).
25. M. S. Sosef, et al., Exploring the floristic diversity of tropical Africa. BMC Biol. 15, 15 (2017).
26. A. Fayolle, et al., Patterns of tree species composition across tropical African forests. J. Biogeogr. 41, 2320–2331 (2014).
27. A. Fayolle, et al., A sharp floristic discontinuity revealed by the biogeographic regionalization of African savannas. J. Biogeogr. 46, 454–465 (2019).
28. F. White, The vegetation of Africa: A descriptive memoir to accompany the UNESCO/AETFAT/UNSO vegetation map of Africa (ORSTOM - UNESCO, 1983).
29. A. Vincens, et al., Forest response to climate changes in Atlantic Equatorial Africa during the last 4000 years BP and inheritance on the modern landscapes. J. Biogeogr. 26, 879–885 (1999).
30. M. Sankaran, et al., Determinants of woody cover in African savannas. Nature 438, 846–849 (2005). 31. U. Salzmann, P. Hoelzmann, The Dahomey Gap: an abrupt climatically induced rain forest
fragmentation in West Africa during the late Holocene. The Holocene 15, 190–199 (2005).
32. J. C. Aleman, et al., Palaeo-trajectories of forest savannization in the southern Congo. Biol. Lett. 15, 20190284 (2019).
33. U. Salzmann, Are modern savannas degraded forests?-A Holocene pollen record from the Sudanian vagetation zone of NE Nigeria. Veg. Hist. Archaeobotany 9, 1–15 (2000).
34. R. R. Klopper, L. Gautier, C. Chatelain, G. F. Smith, R. Spichiger, Floristics of the angiosperm flora of sub-Saharan Africa: an analysis of the African Plant Checklist and Database. Taxon 56, 201–208 (2007). 35. J. C. Aleman, M. A. Jarzyna, A. C. Staver, Forest extent and deforestation in tropical Africa since 1900.
Nat. Ecol. Evol. 2, 26–33 (2018).
36. A. Vincens, Y. Garcin, G. Buchet, Influence of rainfall seasonality on African lowland vegetation during the Late Quaternary: pollen evidence from Lake Masoko, Tanzania. J. Biogeogr. 34, 1274–1288 (2007). 37. L. Laestadius, et al., Opportunities for forest landscape restoration. Unasylva 62, 238 (2011).
38. M. Greve, B. Reyers, A. M. Lykke, J.-C. Svenning, Spatial optimization of carbon-stocking projects across Africa integrating stocking potential with co-benefits and feasibility. Nat. Commun. 4, 2975 (2013).
39. R. C. Abreu, et al., The biodiversity cost of carbon sequestration in tropical savanna. Sci. Adv. 3, e1701284 (2017).
15 40. B. P. Murphy, A. N. Andersen, C. L. Parr, The underestimated biodiversity of tropical grassy biomes.
Philos. Trans. R. Soc. B Biol. Sci. 371, 20150319 (2016).
41. C. M. Ryan, et al., Ecosystem services from southern African woodlands and their future under global change. Philos. Trans. R. Soc. B Biol. Sci. 371, 20150312 (2016).
42. N. Stevens, C. E. Lehmann, B. P. Murphy, G. Durigan, Savanna woody encroachment is widespread across three continents. Glob. Change Biol. 23, 235–244 (2017).
43. E. Buisson, et al., Resilience and restoration of tropical and subtropical grasslands, savannas, and grassy woodlands. Biol. Rev. 94, 590–609 (2019).
44. A. T. Kaptué, L. Prihodko, N. P. Hanan, On regreening and degradation in Sahelian watersheds. Proc.
Natl. Acad. Sci. 112, 12133–12138 (2015).
45. L. Gillson, R. Marchant, From myopia to clarity: sharpening the focus of ecosystem management through the lens of palaeoecology. Trends Ecol. Evol. 29, 317–325 (2014).
46. S. E. Fick, R. J. Hijmans, WorldClim 2: new 1-km spatial resolution climate surfaces for global land areas. Int. J. Climatol. 37, 4302–4315 (2017).
47. L. Giglio, J. Descloitres, C. O. Justice, Y. J. Kaufman, An enhanced contextual fire detection algorithm for MODIS. Remote Sens. Environ. 87, 273–282 (2003).
48. G. P. Hempson, S. Archibald, W. J. Bond, The consequences of replacing wildlife with livestock in Africa. Sci. Rep. 7, 1–10 (2017).
49. T. Hengl, et al., Mapping soil properties of Africa at 250 m resolution: Random forests significantly improve current predictions. PloS One 10 (2015).
50. M. Dufrêne, P. Legendre, Species assemblages and indicator species: the need for a flexible asymmetrical approach. Ecol. Monogr. 67, 345–366 (1997).
51. R Development Core Team, R: A language and environment for statistical computing. (2018). 52. R. J. Hijmans, raster: Geographic Data Analysis and Modeling. (2017).
53. S. Dray, A. B. Dufour, The ade4 package: implementing the duality diagram for ecologists. J. Stat.
Softw. 22, 1–20 (2007).
54. R. J. Hijmans, S. Phillips, J. Leathwick, J. Elith, dismo: Species Distribution Modeling (2017). 55. J. Oksanen, et al., vegan: Community Ecology Package (2011).
56. D. W. Roberts, labdsv: Ordination and multivariate analysis for ecology (2010).
57. E. J. Pebesma, Multivariable geostatistics in {S}: the gstat package. Comput. Geosci. 30, 683–691 (2004). 58. A. Liaw, M. Wiener, Classification and regression by randomForest. R News 2, 18–22 (2002).
16
Supporting Information Appendix for: Floristic evidence for alternative biome states in
tropical Africa Contains
- Supporting Figures: Figures S1 to S9 - Supporting Data: Dataset S1 to S3
17
Supporting Figures
Figure S1. Climatic gradients. (A) The correlation circle of bioclimatic variables (see Materials and methods, Datasets, (ii) Environmental drivers, for the code correspondence) from the PCA performed on the matrix covering the entire study area (Fig. 1A) highlights the contribution of precipitation and temperature
variables to PC1 and PC2 (color gradient). The other panels represent the map of (B) PC1 and (C) PC2 scores over the entire study area. White pixels in the maps are thus outside the geographic extent covered by the floristic surveys. Major waterbodies are shown in blue.
18
Figure S2. Climatic overlap. The putative bistable region where forest and savanna may represent
alternative stable states was defined as the region of climatic overlap between forest and savanna sites. Slopes of both forest (green) and savanna (orange) frequency distributions are shown with respect to PC1, the complex climatic gradient integrating precipitation and seasonality (Fig. 1A and SI Appendix, Fig. S1). The climate space for which forest and savanna are both widespread (0.141 – 4.235 on PC1) is represented in grey, this is the bistable region (Fig. 1C). The black lines correspond to the mean of the rate of change for each distribution (dashed for forest, and dotted for savanna) over the entire PC1 axis. The same analysis was conducted along an axis of (B) Mean Annual Precipitation (MAP, in mm) for comparison with other studies and leads to (C) a MAP range of circa 700-1900 mm for the bistable region.
19
Figure S3. Fire frequency. (A) A map of fire frequency over 2003-2012 was derived from MODIS Active Fire
burned area. White pixels in the map are outside the geographic extent and/or the environmental range covered by the floristic surveys. Major waterbodies are shown in blue. Fire frequency was examined according to the potential biomes, forest, bistable forest, bistable savanna, and savanna as defined in Fig. 1C-D, (B) for the entire study area, and (C) for the pixels containing floristic surveys.
20
Figure S4. Floristic dissimilarity. The Simpson index of beta-diversity was computed between all pairs of
sites. The frequency distribution of floristic dissimilarity (A) within forest sites, (B) within savanna sites, and (C) between forest and savanna sites shows a marked floristic dissimilarity between forest and savanna sites in comparison to that observed within forest sites, and within savanna sites. The mean of all pairwise dissimilarities is shown for each comparison, (A) within forest sites, (B) within savanna sites, and (C) between forest and savanna sites.
21
Figure S5. Composition of the bistable region.Relationships between potential biomes derived from
climate and floristic composition derived from georeferenced herbarium records were examined. The boxplots depict for each potential biome (Fig. 1) the percentage of (A) forest specialist species, (B) generalist species, and (C) savanna specialist species, for pixels containing at least 5 of our 1,707 species. The letters (a, b, c and d) in these panels show the results of Kruskal-Wallis tests applied for each pair of potential biomes, with different letters indicating a significant statistical difference at p < 0.05.
22
Figure S6. Composition of the biome index. The underlying composition in terms of percentage of forest
specialist (green), generalist (grey) and savanna specialist (orange) species was examined for the biome index computed with distribution data derived from georeferenced herbarium records. The thick lines represent a spline regression of the data points, illustrating a continuous increase/decrease of the percentage of forest /savanna specialists with the biome index, and a relatively stable and low (< 20) percentage of generalist species across the whole range of biome index, that, however, tended to show a slight peak for intermediate biome index.
23
Figure S7. Intermediate biome index. Since the frequency distribution of the biome index was found to be
slightly tri-modal (inset, Fig. 3), we used different threshold to map the intermediate state: (A) |biome index| < 0.6, (B) |biome index| < 0.7, (C) |biome index| < 0.8 and (D) |biome index| < 0.9. The percentage of pixels belonging to the forest state (in green), to the intermediate state (in grey), and to the savanna state (in orange), is given for each threshold. Blue pixels are dominated by waterbodies. In West and Central Africa, intermediate values of the biome index correspond to long recognized transition zones between major floristic regions (1), to savanna areas such as the Dahomey gap that were forested during the Holocene (2), and where forest-savanna mosaics are common, and to recently deforested areas (3). In East Africa, intermediate values of the biome index also correspond to the high elevation forest of Ethiopia, much of which are not included in our species lists, and to densely-populated areas, such as the coastal forest and the Lake Victoria mosaic (1).
24
Figure S8. Biome index and availability of herbarium records. The distribution of forest specialists,
generalists, and savanna specialists derived from georeferenced herbarium records was used to devise a biome index based on tree species composition and computed at 0.5° resolution, and here, pixels containing at least (A) five and (B) ten of our 1,707 tree species are solely shown. White pixels correspond to a lack of georeferenced herbarium records for our species. Major waterbodies are shown in blue. The frequency distributions of the biome index given in inset demonstrated that the tri-modal signal observed with all pixels (Fig. 3) gradually disappears under increased sampling (A and B), giving only a savanna (-1) and a forest (+1) mode.
25
Figure S9. Interpolated distributions and associated uncertainty. The percentage of (A) forest specialist, (B)
generalist and (C) savanna specialist species was spatially interpolated at 0.5° resolution using ordinary kriging. Associated uncertainty was also computed for (D) forest specialist, (E) generalist and of (F) savanna specialist species, using the confidence interval of the spatial predictions. White pixels in the maps (A-C) are outside the geographical extent and/or the environmental range covered by the floristic surveys. White pixels in the maps (D-F) also include the training data (pixels containing georeferenced herbarium records for at least 5 of our 1,707 species) for which there is no uncertainty. Major waterbodies are shown in blue.
26 Supporting Data
Dataset S1. Floristic surveys.
List of 455 forest sites and of 298 savanna sites with floristic information on tree species. Dataset S2. Paleo-ecological evidence.
List of 42 paleo-sites for which at least 2,000 years of vegetation history is available. Dataset S3. Indicator species.
List of forest specialist, generalist and savanna specialist species among the 1,707 tree species present in the 455 forest and 298 savanna sites and retained for analyses.