RESOLUTION ELEMENT FOR A PILOT WARNING INDICATOR
by
THOMAS BASIL SMITH, III
S.B., Massachusetts Institute of Technology (1969)
SUBMITTED IN PARTIAL FULFILLMENT OF THE REQUIREMENTS FOR THE DEGREE OF MASTER OF SCIENCE
at the
MASSACHUSETTS INSTITUTE OF TECHNOLOGY June 1970
Signature of Author _
Department of Aeronautics and Astronautics, June 1970
Certified by
Thesis Supervisor
Accepted by
Chairman, Departmental Graduate Committee
DETERMINATION OF THE OPTIMUM RESOLUTION ELEMENT FOR A PILOT WARNING INDICATOR
by
Thomas Basil Smith, III
Submitted to the Department of Aeronautics and Astronautics, Massachusetts Institute of Technology, on June 4, 1970, in partial fulfillment of the requirements
for the degree of Master of Science.
ABSTRACT
There is a need for a low cost pilot warning indicator for general aviation aircraft. This device, as currently proposed, would involve a xenon strobe mounted on all planes and a sensor element mounted on planes desiring the PWI capabilities. The PWI device would, on detection of a nearby aircraft, warn the pilot of the danger and assist him in locating the threatening aircraft.
Experiments were performed in order to determine how accurately the PWI device need establish the direction of an incoming threatening aircraft. It is important that pilot response be as rapid as possible but, at the same time, the cost of the warning device must be kept low. Because of this, a PWI resolution was sought such that near optimum pilot performance could be expected and such that no excessive resolution need be purchased.
Examination of the data revealed that a resolution element of about 110 X 110 is optimal for a low cost
device. Resolution of about 6* X 6' gives somewhat better pilot performance, but the increased cost of instrumenting this reduced sector size was not justified by the slight increases in pilot performance.
Thesis Supervisor: Renwick E. Curry Title: Assistant Professor of
ACKNOWLEDGEMENTS
The author wishes to thank Professors Renwick E. Curry and Laurence R. Young, and Mr. George Economou for their guidance and suggestions in preparation of this experiment.
Special thanks are offered to Dr. Ann Story for her interest and advice on pyschological aspects of this project and to Chuck Oman for his instruction on the hybrid computer.
Mr. Roger Marian also assisted in the construction of the test equipment.
This research was sponsored under NASA-ERC grant NGR-22-009-444.
TABLE OF CONTENTS
Chapter Title
INTRODUCTION EQUIPMENT
2.1 Wide Angle Screen 2.2 Background Projector
2.3 Target Projector 2.4 Turntable
2.5 Hybrid Computer
EXPERIMENTAL DESIGN AND PROCEDURES SUMMARY OF DATA
4.1 General Form Used in Data
Presentation
4.2 Tables of Results
4. 3 Evaluation of Secondary Task DISCUSSION OF RESULTS
5.1 Comparison of Subject Performance Under Differing Backgrounds
5.2 Effect of Target Conspicuousness on
Optimum Sector Selection
5.3 Analysis of Effect of Sector Size on Search Time Page 1 7 10 10 12 12 14 22 26 53 54 55
56
TABLE OF CONTENTS (Cont.)
5 DISCUSSION OF RESULTS (Cont.)
5.4 Central Vision Versus Peripheral
Vision in a Search Situation 58
5.5 Realistic PWI Devices 60
6 CONCLUSIONS 62
Appendix
I Instructions to Subjects 65
II PDP-8 Computer Program 69
III GPS 290T Wiring Program 103
INTRODUCTION
Most general aviation aircraft operate in the relatively crowded airspace of less than 10,000 feet. Many of these aircraft fly out of uncontrolled airfields and maintain
minimum contact with air traffic control. Unlike commercial aviation or military aircraft, general aviation relies almost exclusively on the "see and be seen" principle to avoid
mid-air collisions. That is, collisions are prevented merely by constant vigilence on the part of the pilot. One need only look at the alarming statistics on the number of mid-air collisions and the even greater number of near misses to
recognize that this system is not satisfactory. The era in which such a simplistic approach was accepted is coming to
a close. The higher speeds and the ever increasing density
of aviation today call for a more reliable system.
Commercial and military aircraft planners have long
recognized this problem. Elaborate collision avoidance aids have and are being developed for these craft. Unfortunately, these devices cost many thousands of dollars. In fact,
the cost of current electronic collision avoidance devices is several times the purchase price of many small aircraft. It is hard to imagine installing these expensive aids on the typical small plane.
The pilot warning indicator is an attempt to find a compromise solution. Principally, this device would warn the pilot of possible collision threats and hopefully provide him with sufficient time and information to sight the threatening aircraft and take appropriate measures. It
is hoped that, by sacrificing certain elaborate features of the existing collision avoidance devices, an acceptable, worthwhile and reasonably priced warning mechanism might be developed.
This economy represents several noteworthy reductions in performance. First, the PWI will not aid the pilot in selecting an effective evasive maneuver. The probability of a pilot error leading to a collision is therefore greater with the PWI than with the elaborate collision avoidance devices. Secondly, it will present the pilot with a
significant number of false alarms, possibly as many as seven false alarms for every real one. Because of this, the pilot may develop a tendency to ignore warnings. The
certain cases, it may in fact fail to give any warning of an approaching aircraft. The optical sensor is sensitive only in regions of likely threats. If an aircraft approaches
from an unlikely angle, for example, from above, the PWI device may give no warning.
Despite these shortcomings, PWI offers an opportunity for increased safety since it supplements pilot senses so as to overcome basic weaknesses. A pilot of a general aviation aircraft seems to be poorly adapted to the task of maintaining constant and vigilent scanning of the sky for incoming planes. PWI will help him in this searching task and can reliably detect an approaching aircraft before it is even visible to the pilot. The sky is broken down into several sensitive regions or sectors. When the flashes from the strobe of a nearby plane are detected within a
sector, an alarm is sounded and information indicating which sector originated the alarm is passed to the pilot. He can then scan the sky corresponding to the alarm sector.
If this sector is sufficiently small, it is reasonable to expect that the pilot will more easily be able to locate the plane. Naturally, the design of the PWI should attempt to optimize the performance of the PWI/pilot system so as to achieve a maximum safety level.
PWI takes a task which was entirely in the domain of the pilot and breaks it into two parts. The first portion, initial detection of the plane, is assumed by the instrumen-tation and PWI hardware. Extensive hardware studies have been performed or are currently in progress on various
PWI systems. In general, they tend to confirm the soundness of the beacon-sensor concept for PWI. The second portion,
final search, sighting and avoidance, remains with the
pilot. Good pilot performance in his task requires a smooth interface between the instrument and the pilot. This
interface is some kind of warning display. Work on various
types of heads up and audio displays is being done in
conjunction with this study at the Man-Vehicle Lab. In
addition, some preliminary work on PWI displays was done at Dunlap and Associates21 and by Charles Burr, again at the Man-Vehicle Lab. These studies have been primarily concerned with a comparison of the effectiveness of
dif-fering displays under similar PWI conditions.
Essentially, this instrument should not attempt to develop and relay uselessly detailed instructions as to
target position in the sky. If the pilot can only effec-tively utilize a limited degree of resolution, an attempt to relay more detail is wasteful. First, it adds to the cost of the device without any benefit. Secondly, the
added time spent by the pilot in analyzing the more detailed information may degrade his performance.
This study more closely analyzes the role of the pilot
22
in a PWI system. The work done by John Volkmann is
suggestive of the problem which was investigated. Volkmann
observed that, with relatively small search fields, the
search time is reasonably short. Search performance is
only slightly degraded as the field of search grows larger. This trend seems to break down sharply at some critical
field size and further increases in size bring sharp drops
in search effectiveness. This work suggests that the same factor may effect PWI implementation. If this is the case, PWI devices should strive to have a resolution segment of
about the same size as this critical element. Increasing resolution could not be expected to substantially reduce
search time. A decrease in resolution would result in heavy penalties because the pilot's search would become markedly less efficient. Naturally, if such an optimum
size existed in the PWI situation, the critical sized
sector might be expected to be a vague function of the varied out the window fields of view available from a cockpit.
The purpose of this study is to investigate the
relationship between instrument resolution and the pilot's efficiency in locating the target. It was hypothesized that
an optimum sized resolution element or sector might be found so as to guide the development of the actual PWI
the optimum sector size or area to be searched would not be the trivial solution, the smaller the better. The following factors were investigated:
(1) Time to locate a threatening target against a cluttered background. The variables were:
(a) Contrast between target and background (b) Sector size to be searched
(2) Time to locate a threatening target against a relatively less cluttered background. The variables
were:
(a) Contrast between background and target (b) Sector size to be searched
All tests were conducted using a screen which covered + 800 in azimuth (0* straight ahead) and + 250 in elevation. No attempt was made to reproduce aircraft out the window scenes with any visual fidelity. Instead, a controlled
background was created which was uniform in brightness and visual clutter over the entire screen. This allowed the
establishment of reproducibly baseline data which might
then be extrapolated to influence the design of an actual flight instrument.
CHAPTER 2
EQUIPMENT
The test equipment consisted of the following major items.
(1) Wide angle screen
(2) Three Kodak 600 slide projectors (3) One Kodak 750 slide projector
(4) Turntable with associated drive equipment (5) Hybrid computer; PDP-8/GPS 290T digital
analog computer
Figure 2.1 shows the basic experimental arrangement of this equipment.
2.1 Wide Angle Screen
A wide angle circular screen was constructed from two 4'X8' masonite panels. The radius of curvature was roughly 4.75 feet. The center of the screen was about 4 feet from the floor. From the subject's point of view, the screen covered about 1600 horizontally and about 400 vertically. The screen was painted white with a rough matte finish. Figures 2.2 and 2.3 show the screen and the subjects location
/t N '~ yodak
600
\
I/
'I
/
Figure 2.1: Basic Layout of Projectors and Screen. olow
\I.00,
- - -~OW
OwI OW \N 4Figure 2.2 Subject in Position
2.2 Background Projectors
The three Kodak model 600 slide projectors were used to project a wide angle background scene onto the screen. Without slides, the three projectors provided an even 60
foot candles of light across the surface of the screen. This represented about the brightest white which could occur in the background scene. Ambient light in the room varied from 5 foot candles to 15 foot candles. This was
essentially the darkest black which could occur in the background. Therefore, the maximum contrast ratios that
could occur in the background were between 15 to 1 and
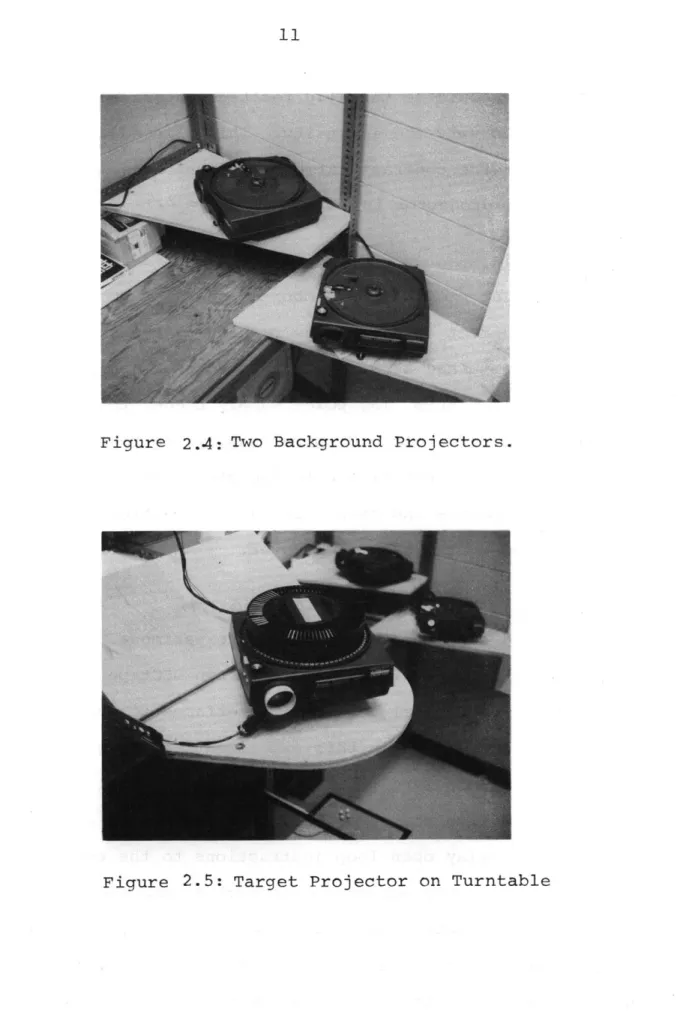
4 to 1. Two of the three projectors and shown in figure 2.4. 2.3 Target Projector
A Kodak model 750 slide projector was used to project the target and sector indication. The projector was
mounted on a turntable so that it could be pointed at any portion of the screen. The projector was modified so as to incorporate the following features;
(1) Remote slide changing. Slides could be changed on command from the computer. Slide selection was either forward or backward through a circular tray.
(2) The projector lamp could be turned on or off via the computer.
Together, these modifications allowed the automated computer selection of any of the slides in the tray. In addition,
Figure 2.4: Two Background Projectors.
the lens of the projector was fitted with two polarized filters which could be manually rotated against each other so as to vary the intensity. This allowed an easy adjustment of the contrast ratio between background and target. This projector is shown in Figure 2.5.
2.4 Turntable
The target projector was mounted on a low rpm turntable which could direct it toward any portion of the screen.
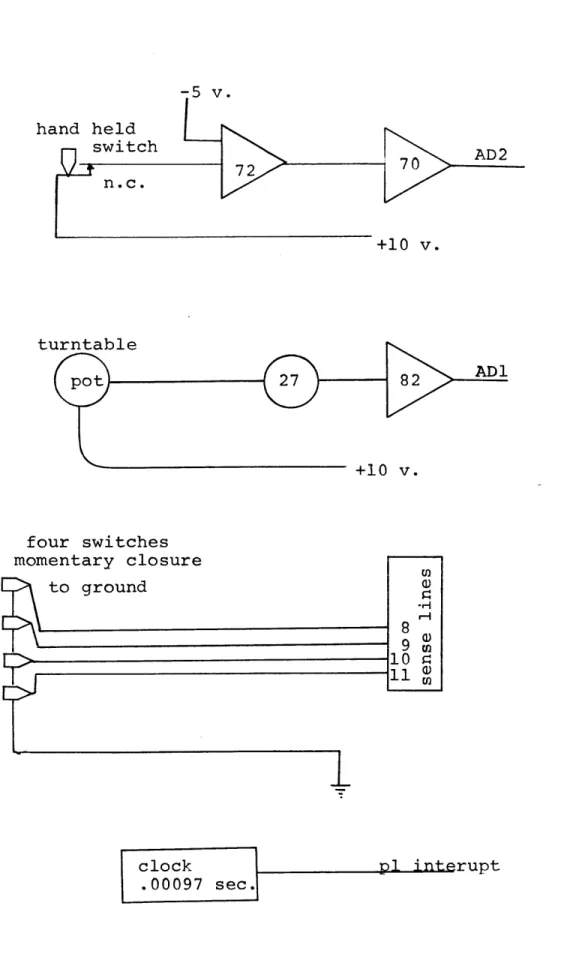
The turntable turned at a constant speed of roughly one revolution per minute. The power supply needed to drive the motor was a 27 volt D.C. power supply. A feedback pot measured turntable position allowing closed loop control. Turntable movements and therefore target positionings were directed by the hybrid computer.
2.5 Hybrid Computer (Figures 2.6 and 2.7)
A hybrid computer controlled the experiment. It consisted of a PDP-8 with 4K of core, two DECtape drives, a teletype, and digital to analog interfaces to the GPS 290T analog computer. In this experiment, all logic and feedback functions were controlled via the digital portion of the system with the analog computer serving as an
interface to relay open loop instructions to the equipment and conduct "'sensory" measurements back to the digital logic. The computer selected the slides, controlled the turntable and provided timing of all events. In addition, the computer compiled relevant data during the execution of the experiment.
Figure 2.6: GPS 290T Analog Computer.
CHAPTER 3
EXPERIMENTAL DESIGN AND PROCEDURES
The basic objective in the design of this experiment was to provide an efficient means of obtaining data on
subject response to a number of idealized simulations of PWI warnings. In order for this basic objective to be met, it was necessary to conduct a large number of experimental trials varying several parameters. A highly automated
means of performing this task was devised. With this tech-nique, rapid data collection and repeated and varied trials were placed under computer control and combined with data reduction and analysis.
Computer control allowed for the rapid manipulations of several parameters. The parameters so controlled were
as follows:
(1) Horizontal position of the search sector on the screen. This simulated warnings from
different azimuths.
PWI instrumentation.
(3) Background quality. The amount of visual
clutter or noise in the background could be varied.
(4) Target contrast against the background. The conspicuousness of the target against the background could be varied by adjustment of 3
and 4.
(5) Position of the target within a given sector.
A single trial of the experiment followed a specific series of events.
First, the sector size and target position within the sector are selected. This is done by the selection of a single slide from the slide tray. Both the target and the selector indication are projected from the same slide. As mentioned previously, the sector indication is a white box which encloses the area to be searched. The target is
a triangle within that box. It is elongated and points
either up, down, left or right. Because the target position within a sector on a given slide is fixed, it is necessary
to have several slides with identical size sectors in order to vary target positioning within a sector. Once the slide has been chosen, it is loaded via the projector slide changing mechanism into a postion ready for projec-tion.
Slide selection is done automatically on command from the hybrid computer. Although the computer may easily select slides at random, this was not in fact done. The slides were stepped through sequentially in the forward direction until they were exhauseted. The direction was then reversed and the same slides were backed through to the start slide by slide. On reaching the start, the
process was repeated. A simple table stored in core memory provided the computer with the relevant information it
needed to control this task. The slides were arranged in a psuedo random fashion within the tray so as to give the appearance of random slide selection.
After slide selection and loading, the projector is moved to point toward a particular portion of the screen.
The projector is mounted on a turntable to facilitate this and a feedback pot measures projector position allowing closed loop control. Projector positioning is done by the computer under program control. In order to prevent the subject from attempting to track projector position
as a function of the time required for positioning the projector, a random walk to several intervening positions
is employed. Projector movements are executed in accordance with the entries in another data table stored in core
memory. Positioning is done with an accuracy of 1 part in 64 over a range of roughly 160 degrees or to about 2 or 3 degrees.
When the slide is ready and the projector correctly positioned, an alarm is sounded and the projector lamp is lit projecting the target and sector indications onto the screen. This projector has two polarized lenses which can be rotated against each other in order to vary target and sector indicator intensities. This allows differing contrast ratios between the target and the background. The adjustment of this ratio is done manually before each series of trials. The alarm is a square wave tone of roughly 800 cycles per second.
When the subject locates the target within the sector, he presses a hand held button. Both the alarm and projector
lamp are shut off on this signal. The computer records the total elapsed time from the onset of the alarm until the button is pressed. Timing is done utilizing the variable clock in the GPS 290T computer. Resolution in time is to better than one thousandth of a second.
The subject is then required to identify which direction the target was pointing. He indicates this response by
pressing one of four buttons. Data from the trial is compiled into running statistical sums if he correctly
identified the target. If he cannot, an error is recorded. if the subject is unable to locate the target within 32
se-conds, the alarm and lamp are shut off and an error is recorded. While the computer is waiting to receive the target identifi-cation from the subject, the next slide is selected and the projector positioning initiated.
The subject is required to work on a secondary task during slack moments between trials. This task involves
the marking of a table of random numbers identifying specific number patterns. Specifically, the subject was asked to
mark chains of three increasing or decreasing digits. The exact nature of the task is described in great detail in the instructions to the subject, a copy of which is enclosed in the appendix.
Data from each trial is collected by the computer. At the end of each trial, this data is analyzed and combined with data from previous trials. In this fashion, data analysis and reduction takes place as the experiment is running.
Data from a single trial is combined with data from similar trials. The experimentor is free to define what characteristics the computer should use in defining or setting up these trial groupings. Sector size, target
positioning within the sector, sector heading or any combi-nation of the above may be used to define trial groupings. The computer has a capacity to accumulate statistics on up to 24 such groupings. For this thesis, the sector's size was used as the grouping parameter. Different series of runs were made for different target contrast and background conditions with the computer providing an instant analysis of the data broken down by sector size for each run.
Briefly, each statistical abstraction of data for one particular grouping or sector size includes the following data:
(1) Number of trials making up this group
(2) Number of valid trials included within this group. A valid trial is one in which the subject located the target within 32 seconds and was able to correctly identify it.
(3) Mean response time. This is the mean or average time required to locate the target. This
is the mean of the valid trials.
(4) Variance. This is the square of the standard deviation among the response times of the valid
trials.
(5) Histogram of data. This is a simple compi-lation of a number of trials with reaction time lying in certain time intervals. The time
intervals were broken down into half second
segments from 0 to 27 seconds. The last segment 27.0 - 27.5 seconds also includes 27.5 - 32.0 seconds.
Subjects were run under various background and contrast conditions. Basically, contrast between background and target was adjusted by means of the double polarized lens on the
target projector. Contrast within the background, that is, difference between maximum bright spots and maximum dark spots, was adjusted by changing the ambient light level in the room. This was done by changing the wattage of a single light source mounted just above the target projector.
A series of about 20 subjects was used and an attempt was made to limit the number of repeated subjects so as to
repeated exposure to the mechanization of this experiment. Each series of runs was about 30 minutes long and included about 80 trial events.
CHAPTER 4
SUMMARY OF DATA
4.1 General Form Used in Data Presentation
Over 800 separate trials were conducted in order to
compile the statistics presented in this thesis. Naturally, with such a large amount of raw data available, it was
necessary to develop a means of summarizing the data in
order to properly evaluate it.
Basically, two distinct series of trial runs were
made. The first series of trials was conducted with a
highly cluttered background. The search for the target
against such a background might be compared in difficulty
to the problem of locating another aircraft against the cluttered background of the ground below. A second series of runs was conducted against a much brighter and less cluttered background. This represented the task of
loca-ting a plan against the sky.
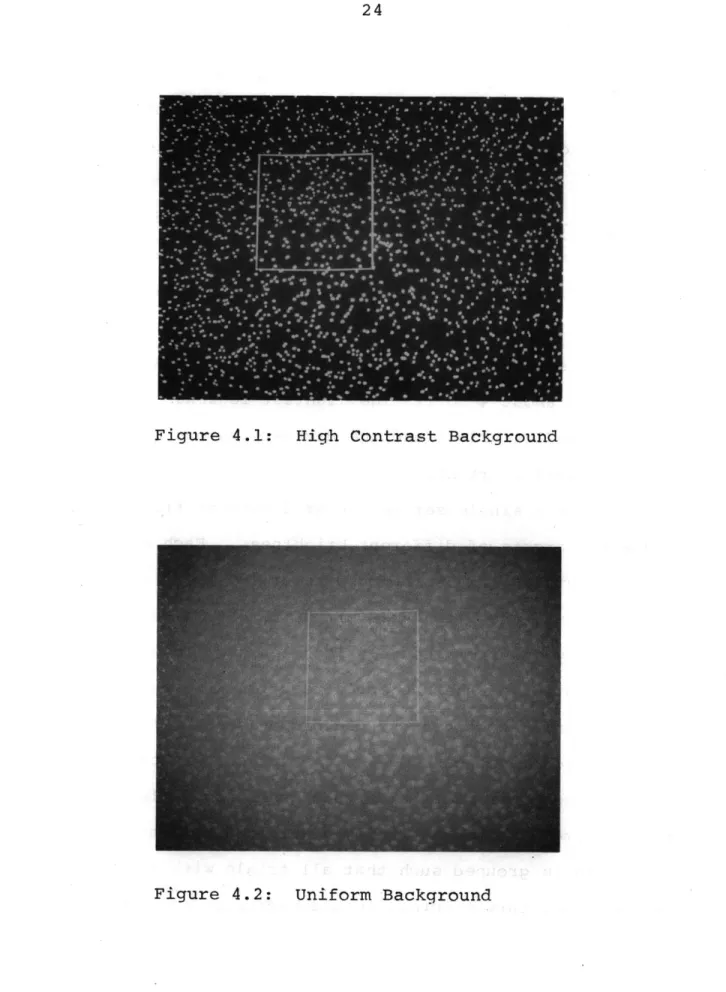
The background used in the first portion of the study was a speckled scene with each bright speckle being slightly
smaller than the target. The region between speckles was
as the dark regions between them. The light projected on the surface of the white screen formed a speckled pattern which was 60 foot candles bright at the center of a
speckle and 4 foot candles bright between speckles. A
photograph of the highly speckled background is shown in Figure 4.1. Beneath the high contrast background is the brighter, more uniform background used in the second series of runs. This background is similar to the first except that the blobs are not as clearly defined.. The maximum
contrast between the lightest and darkest region has been reduced to about 4 to 1. The lightest regions are about
80 foot candles bright and the darkest regions are about 20 foot candles bright.
Within a single series, several sets of trials were run with targets of different brightness. Each of these smaller sets of trials included about 100 trial events. For each set, the brightness of the target was adjusted manually by means of the polarized lenses. This allowed an examination of the subject's reaction time as a func-tion of target contrast and conspicuousness. At each of these fixed brightness levels, the subject was presented with a random mix of trial situations using differing
sector sizes located at randomly selected headings. Data is grouped such that all trials with the same sector size, target intensity and background are combined into one statistical picture. For a single group, these
Figure 4.1: High Contrast Background
statistics are reported on single pages in Section 4.2. The data items concerning a single data group are as follows:
(1) Background used; either high or low
contrast.
(2) Target brightness;- target projector light intensity at the surface of the screen.
(3) Sector size; field of view covered by the search sector.
(4) Mean time; the mean time required for the subject to locate the target.
(5) Standard deviation; the standard deviation of the time required to locate the target.
(6) Error rate; the percentage of trials in which the subject fails to correctly
identify the target.
(7) Histogram of results; this is a graphical abstract of the data. The time axis is
broken down into half second intervals and
the percentage of trials with response times falling in the various half second intervals
is shown. The bar labelled "e" on the graph represents the error rate.
data seems somewhat coarse. This coarseness is a function of the number of trials used in generating the data. If larger numbers of trials were made, it would be expected that the data might fit under a smoother envelope. The difficulty in performing greater numbers of trials for a single set of parameters more than outweighs the
refine-ment in data possible with this increased effort. The decision was made to cover a larger number of basic
para-meter combinations rather than concentrate too heavily on a limited set of parameter combinations.
4.2 Tables of Results
Figures 4.3 through 4.27 summarize the data collected for this thesis.
High Contrast Background
Sector Size = 2.70 X 2.7*
Target Intensity = 20 foot candles
Mean = 2.3 Median = 2.3 Standard Deviation = .37
-I
-II
1111117773 7 --1~~
i'jI
-J
4
e 10
Eitt
'~1
4
1
V
V
.1
t~.
15
20
SECONDS Figure 4.3I-50
40
r-2rz.4
0 E-' C.! P430
20 100
0
5
- T
4--H-High Contrast Background
Sector Size = 5.5* X 5.5*
Target Intensity = 20 foot candles
Mean = 2.4 Median = 2.4 Standard Deviation = .65
""""""L""
L1T"
-- 1T-'K-v
V
ijy~~}~~
4-I
t--H
11~ -~ * '~---- --2111111
A10
1
15
5
-J20
SECONDS Figure 4.450
40
30
E4rzl
rz
WrZ
20
10
0
0
High Contrast Background
Sector Size = 110 X 110
Target Intensity = 20 foot candles
Mean = 3.3
Median
=
2.6
Standard Deviation = 2.9-v
1-
-I'A
11jKrF
4]
- -t'K
-. 1-i-p --II-1'K
iii
I
1'.
-F20
U
t
t~]
e
25
SECONDSFigure
4.5
50
40
t I K--I-',F-15
30
20
0E-Z
Wz
U
Rc
0
510
4-4:4
I
14-. I-JL
---
---
---0
High Contrast Background
Sector Size = 22* X 22*
Target Intensity = 20 foot candles
Mean = 7.9 Median = 8.0 Standard Deviation = 5.6 50
T11
II
4 -I- It - --- l--- -
---
------
~----
- - - - - - --- --- - L L---
-
~
--- T
5
10
a
Ii
15
I I Ii1i~
20
A
25
I
e
30
SECONDS Figure 4. 640
30
H r20 0H20
z
10
0
0
I . --. . 1- i I I t T IF--High Contrast Background
Sector Size = 2.7* X 2.7*
Target Intensity
=
35 foot candles
Mean = 1. 7 Median = 1.7 Standard Deviation = .40 41
Jillilil
.
...:-1.---
-n..
=JJ17 i =!!!{iL
1..
11 --15
5
e
10.
SECONDS Figure 4.750
40
U)E-4
0 E-1Zx
30
20
10
0
0
High Contrast Background
Sector Size = 5.50 X 5.5*
Target Intensity = 35 foot candles
Mean = 1. 6 Median = 1. 6 Standard Deviation = .33
5
e
10
SECONDSFigure
4.7
50
40
S30
rZ4
0Z 20
10
0
0
i
L.LA
:~~~L LL.= -L
u:
.i
!in~nii. iiinnnfti
15
High Contrast Background
Sector Size = 11* X 110
Target Intensity = 35 foot candles
Mean = 2.1 Median = 1.9 Standard Deviation = .75
Ii
~ij~i~>21
-T7-j5
10
SECONDS Figure 4. 8'V
50
40
30
I f
ll
E-4
020
10
0
0
I I I I ., I .I I .I
I I i 0 0 t---15High Contrast Background
Sector Size = 220 X 22*
Target Intensity = 35 foot candles
Mean = 7.1 Median = 8.4 Standard Deviation = 6.0
4
i+j
1
7!
I1I1I I5
10
15
20
e 25
SECONDSFigure
4,9
50
40
30
20
0 010
0
0
High Contrast Background
Sector Size = 2.7* X 2.70
Target Intensity = 45 foot candles
Mean = 2.9 Median = 3.0 Standard Deviation = 1.2
T1I IT' -TT-F
-i
11
5 4 T SECONDS Figure 4.1050
40
30
0 020
-viz'''
'Ii
ill
1C
0
0
Ii
±
i
10e
15
High Contrast Background
Sector Size = 5.50 X 5.5*
Target Intensity = 45 foot candles
Mean = 2.8 Median = 2.7 Standard Deviation = .94
I
---t-im;~ mm
.""" IIIIII t- "tI I~
n I -j4--II
I.
I n!
"" Et ", - --5
10
e
15
SECONDS Figure 4.1150
40
Pz4 0 030
20
10
0
0
High Contrast Background
Sector Size = 110 X 110
Target Intensity = 45 foot candles Mean = 3.4 Median = 2.8 Standard Deviation = 1.2
--S .
. .. .
...
ij
li lj
5
10
15
SECONDSFigure
4.12
50
40
rZ4
0 pqU
0430
20
10-0
0
High Contrast Background
Sector Size = 22* X 22*
Target Intensity = 45 foot candles Mean = 9.1 Median = 6.0 Standard Deviation = 8.4 I j...
-
-
---p
--
--f - - -- -t -- t -t ---- t - - - - --f . I - - i-i- !4 I I-- - -4 -4- -4-4-5
-J4--iIIIEIIiIlIfIfIin
IU
I ~ ~ t ~
tItI~IIILzLztItIt~J~IzI~t~Iz
I-
-~-
U I ~ ~ I
u--I
4
hI
*U
*I
* * *I I I-
I I I
I I
10
15
20
'F
25
e
30
SECONDS Figure 4.135c
4c
E4 3(0
ni2(
R0
0
I
I
-T-- T-T-- I I I I .i 1 . . . 1 i ; ' -- 4 - 1 J- ' 1-111 1 tttttlH-ttt-H-H+H-111 1+1
-- T- 1 -r-T -- t-- -- r-r-t -t- -. --- -- 4---I - I I I ' I | . I ' ' T.
1
LLJ j MIN!,I
., . I . ,-High Contrast Background
Sector Size = 2.7* X 2.7*
Target Intensity = 55 foot candles Mean = 1. 5 Median = 1. 3 Standard Deviation = .5 55 ,
50
40
30
20
10
o
0
- - - - -- --- 4- -----e-10
SECONDS Figure 4.14 rL) 0 0z:
p [4High Contrast Background
Sector Size = 5.50 X 5.5*
Target Intensity =
55 foot candles
Mean = 1.4 Median = 1.3 Standard Deviation = .32
5
SECONDS Figure 4.1510
70
60
50
40
301
- !Ii{1l4a
zi
-'Is-.j-ij--it
7
I ---- *ii I .II
II I
1iii.i
I 1.-.
- -s -L
ii II
- -0 U20
10
0
0
-t-1-Sector Size = 110 X 11*
Target Intensity
=
55 foot candles
Mean = 1.45 Median = 1.4 Standard Deviation = .31 --- -4 I 4
1-I-
i-I-70
60
50
SECONDS Figure 4.16 I----
'
5 t-i -0-1+
L
5
e
10
Ii
K
-1~ U) 0Z 0 U40
30
20
10
0
0
High Contrast Background
Sector Size = 22' X 22*
Target Intensity = 55 foot candles
Mean = 2.9 Median = 2.1 Standard Deviation = 1.8 -- -. I~
"V
-b-'~-~- ~
1111
I I
-i-i.-F I --- ~-- ---.-t~
-~-~-- -~-5
10
e
15
SECONDS Figure 4.1750
40
0 E-1 U30
20
10
0
0
Uniform Background
Sector Size = 2.70 X 2.7*
Target Intensity = 25 foot candles Mean = 3.9 Median = 4.0 Standard Deviation = 1.1
-
1TFT
mi--#4
+I
-I-i---
T-
111-
#t
77.~ +~K IEEI5
II.1J
e 10
15
SECONDS Figure 4.1850
40
rZ
4 0 E'Z
30
20
10z
0
10
... ...
Uniform Background
Sector Size = 5.50 X 5.50
Target Intensity = 25 foot candles Mean = 5.9 Median = 5.3 Standard Deviation = 3.1 'I 1 III 41 - ~~--~-Th
4ThT
V
t1
I
H___
_F4
-iI+
A-I
I
-i7
-I
10
SECONDS Figure 4.1940
30 20 0 I 100
4L-0
5
15
e
20
Uniform Background
Sector Size = 110 X
11*
Target Intensity = 25 foot candles
Mean = 7.3 Median = 7.4 Standard Deviation = 4.5
~
~
'I
T,__
__________j~jj;j~V
1~~Iil
-__lJ
i
__J-1_t
i lj
Ii
I-*1~
_44~TKI
zjii~11
10
15
20 SECONDS Figure 4.20 i 0W
030
20 10'I'
-4--
-I--i~j
I--
----4--1
F-0
0
5
e
25J
---
L j.
1
-"-4-1 HEMUniform Background
Sector Size = 2.7* X 2.7*
Target Intensity = 50 foot candles Mean = 2.2 ~ Median = 2.2 Standard Deviation = .46 -
r~r
4 -4-KI
i:iIiz~
I~
1111111111
I I14
I , Ii -2I1I1I1I1N1IK1iII4]444.~L
wKrv~
1.111
J -. -i *1111
I4411
-H1
111111
Ii
'KI''''
_______V
141
I' 1-I ____________-"K---
- - - --5
15
SECONDS Figure 4.2150
40
rx430
20
OL
0
.-TUniform Background
Sector Size = 5.50 X 5.5*
Target Intensity = 50 foot candles Mean = 3.5 Median 3.1 Standard Deviation = 1.5 50 40 3E0-- - -20 -= H 40 20 ':44 0 0 10 15 SECONDS Figure 4.22
Uniform Background
Sector Size = ll* X 110
Target Intensity = 50 foot candles Mean = 6.9 Median = 4.5 Standard Deviation = 6.1 - -
-I-i-;j
- --111711i1ILi
i
'727J
±1
I- -1-i- ~1-JIILLIII
-~'-f-i-20
7 4
10
05
05
II I J 1 i+ I I I -, Jff L - -4i10
15
20
e
25
SECONDS Figure 4. 23 5040
30F
r14 0 H z4 pq I I I . I I I I I I . I . I . . . . . I . . . . I IUniform Background
Sector Size = 2.7* X 2.70
Target Intensity = 75 foot candles Mean = 1.7 Median = 1.7 Standard Deviation = .49
50
40
30
20
10
0
0
Ti
?1
I~1E~
r~]7"T
V 1 2K'
I K'I~iIIii1I~V
IL
i
jziiijij~i
-,
-5
I
----i-I
-~-+--~---~~
II -i -i-I if I -- I4-10
I I I15
SECONDS Figure 4.24 E-1 r 0E-Z
--
-
-
tSector Size = 5.50 X 5.5*
Target Intensity = 75 foot candles Mean = 1.7 Median = 1.7 Standard Deviation = .36
60
50
*1~ 4 --t-4-e
10
SECONDS Figure 4.25 ---- --- -- -P4 0 P440
30
20
5
100
0
15
Uniform Background
Sector Size = 110 X 110
Target Intensity = 75 foot candles Mean = 2.1
Median
1.9
Standard Deviation = .68 -r
1~~~---- --- ---____ I _____ I - - - -.--- v-ijiIi~
--7L5
10
SECONDS Figure 4.2650
40
4 _r4
004
30
20
I
'IA'
z~zL
100-0
15
Uni form Background
Sector Size = 220 X 22*
Target Intensity = 75 foot candles Mean = 6.5 Median = 7.2 Standard Deviation = 4.6
1
2I4~H
zIz~
--4-KK~--V--
-HLF-~--V-~ L~{ ~ - --H'
h
~jzii
III
~-'
-'}-1'- - -_______III~L.~..
4
20
Figure 4.2740
7K
~I'I 1~ 0 0 E-4 30 20 100
0
5
1015
SECONDSe 25
4.3 Evaluation of the Secondary Task
Subjects were broken down into roughly two categories by their performance on the secondary task. The first
group of subjects tended to progress rather slowly through the task making very few errors. The second group processed the random numbers about three times as fast, but had a very high error rate. The accurate group worked through about
10 lines of 50 digits each, while the inaccurate group went through about 27 lines with an average error rate of
about one missed or incorrectly marked chain for every two
correctly marked chains.
Between these two groups, there was little difference in the performance of the primary task. The single excep-tion to this rule was one subject who performed with utter
zeal on the secondary task, progressing through about 40 lines, achieving an all time high in the number of errors made and setting some sort of record as to the lack of attention paid to the primary task. Data from this run
appears in the third set of tables, Figures 4.10 through 4.13 of Section 4.2. This factor accounts for the unusually
poor performance shown by that group of subjects and may illustrate the effect of heavy pilot workload on PWI effec-tiveness. Judging from general performance on the primary task, it would seem that both the accurate and inaccurate groups devoted equal effort to the secondary task. Because of this, the data can be viewed as representing equal
CHAPTER 5
DISCUSSION OF RESULTS
5.1 Comparison of Subject Performance Under Differing Backgrounds
The most surprising result of this experiment was the fact that, with equivalent contrast ratios between target and screen brightness, most subjects performed markedly better with the highly cluttered background than with the more uniform one. Initially, a reasonable guess would have been to suspect that the uniform background would ease the task of locating the target since it was the only
sharply defined object in the sector. This would also
have seemed true because the cluttered background contained many items which were similar in size and shape to the
target. With the cluttered background, the subject had to essentially locate the triangle by rejecting all other possible candidates in the sector. Despite this, he
was able to quickly locate the target even when it was almost completely hidden under a bright speckle.
A possible explanation of this phenomenon is that
possibly forcing him to scan the sector without his vision being focused at the surface of the screen. Because of this, the triangle would not have appeared sharp and would
therefore have been more difficult to locate. This would
imply that, for a PWI instrument, search sectors above the ground cannot be made extra large because the pilot can be expected to have difficulty locating a plane in the
uncluttered sky. Blank sky is, like the screen used in this test, devoid of any keys or aids which might help to
maintain pilot focus at infinity. This situation, which is known as space myopia, has been observed to occur in other
18
aviation situations . It is likely therefore that the
pilot may find it difficult to locate a plane against the sky or a uniform overcast due to this factor.
5.2 Effect of Target Conspicuousness on Optimum Sector Selection
Target contrast was varied in the runs with both types of backgrounds. As might be expected, the more visible a target, the less effect sector size had on the time
required to locate it. Increased target brightness tended to reduce the performance differential between the largest and smallest sectors. Unfortunately, target visibility is a factor over which PWI designers have little control. At
reasonably low values of target visibility which might be comparable to real life situations, such as a plane against
oversized sectors. Therefore, there would seem to be a requirement for incorporation of small sectors in a PWI device.
5.3 Analysis of Effect of Sector Size on Search Time Reducing the size of the sector to be searched tends to reduce the time required to locate a target within the sector. Figure 5.1 shows a plot of the time
below which ninety percent of the observations fall versus sector size. However, it should be noted that the benefit of decreasing sector size below a critical size is marginal or non-existent. Increasing sector sizes above this minimum critical size markedly reduces the subject's ability to locate the target within it.
This critical sector size is roughly 11* X 11* under the conditions of this experiment. The consistency of this conclusion, across all trials under all backgrounds and contrast ratios used, suggests that this size might be
optimum under an even wider range of situations. Examinations centered around this sector size in a more realistic PWI
situation, possibly a flight test or careful simulation, would certainly be justified.
20 foot candle Target
35 foot candle Target
55 foot candle Target
Q) 8 -4 -J
/*
C) 6 4 0 2O 4/ 52 ro 2 0 24 6 8 10 15 20Sector Size in Degrees
Figure 5.1: High Contrast Background Statistics
* Dashed line indicates that error rate had become so high that 90th percentile was never reached.
5.4 Central Vision Versus Peripheral Vision in a Search Situation
A possible explanation of the uniform performance
across a whole range of smaller sector sizes may involve the use of central vision versus peripheral vision during the
search. With the larger sectors, the subjects complained of an inability to search such a large area. Generally, they commented that they found themselves searching the same
areas of the sector repeatedly. Judging from their performance, many areas also went completely unsearched. In contrast, no
one found it at all difficult to locate the actual sector indication on a screen many times the area of the largest sector.
The logical conclusion is that the process by which the target was located differed considerably from the process
in which the sector was located. The sector could be easily spotted with peripheral vision while the target generally required the use of the central vision to locate it. Since
the area which can be viewed by the central vision is relatively small, it is possible that an effective, rapid search can
only be carried out when the area to be searched is no larger than the area covered by the central vision with a single fixation of the eyes or when only a small group of tightly related fixations are required to cover the search region. With the larger sector sizes, the search pattern required
numerous fixations across relatively unmarked landscape and allowed inefficiencies to occur. The search moved at random
around the sector missing areas and covering certain areas more than once. In addition, the subject might have
attempted to fall back on his peripheral vision as an aid to locating the target. If such an attempt was made, it clearly would be non-productive as the target under most conditions was too small and too dim to locate with
this less acute vision.
The implication of this theory is that the sectors should be adjusted to a size which might easily be scanned using the central vision. The results of this experimentation suggest that an 11X110 field of view might very nearly be such
an ideal sized area. The dangers of attempting to make do with a larger sector are twofold. First, the pilot will not perform as satisfactorily with such a device. Secondly, since he will no doubt notice the considerable number of alarms for which he can not spot a plane, his trust in
the device may be reduced to the point where he will not use it. The later case of an alarm for which the pilot never spots a plane is a sort of false false alarm. An alarm from a
plane which is not on a collision course is a false alarm. Device failure may, however, generate an even worst case false alarm where a warning is given when no plane at all is present. If the pilot cannot spot the plane, he may tend to believe that it is the second type of false alarm. Pilot patience with what appears to be device failure will, no doubt, be considerably less than his patience with a device which issues warnings for all nearby aircraft, some
of which may not represent a real threat. It is important to keep sector size small so as to prevent the appearence of device failure, thereby maintaining pilot confidence in the instrument.
5.5 Realistic PWI Devices
A realistic PWI display will be considerably less ideal than was the warning presentation used in this experiment. Sectors will almost certainly not be
completely surrounded by a white box. The performance of the pilot will naturally tend to be degraded by a less than perfect display.
The following factors will probably weigh most heavily on the pilots performance:
(1) Indefinite edges to the sector will probably cause the pilot to view the sector
as somewhat larger than it actually is.
(2) Instrumentation of this device may be
subject to flaws or weaknesses. This may cause some uncertainty as to which sector the warning originated from when it is near a sector edge.
(3) Lack of visually marked edges may cause the pilot's search to wander out of the correct
sector.
These factors may modify the optimum sector size. It might be possible to reduce the sector size in order to
compensate for them. However, these effects may be so large as to completely mask any benefits from small sectors.
CHAPTER 6
CONCLUSIONS
This study provides baseline data concerning several important factors which will effect the performance of a PWI device. Because this experiment is an abstraction of
a real life situation, some of the conclusions tend to be
somewhat more qualitative than quantitative. The data does point to some primary design considerations and
pro-vides a basis for a preliminary PWI design. Further, more
refined work should be done on a prototype instrument with more realistic simulation or actual flight tests.
The most unexpected conclusion which can be drawn
from this study concerns the difficulty subjects encoun-tered in locating targets against the uniform background.
An initial guess on a possible cost saving trick for PWI
might have been to tie several sectors together so that only a few large sectors covered the sky. Smaller, more
refined sectors might then have been employed to cover the
ground cluttered field of view. This study indicates that
a pilot may have a great deal of difficulty locating a plane in the blank sky. Reasonable PWI resolution would
therefore be required both above and below the horizon.
Since the same sector size was optimum under a wide range of conditions, design of the PWI with identical
above and below the horizon resolution is indicated. This optimum sector size was around 10* to 15* on a side.
Pilot performance was generally higher at somewhat smaller values of sector size. However, it is likely that the extra cost incurred to reduce the sector to below the 10* to 15* size would not be justified by the marginal increases in performance. Pilot performance with a larger sector
size is markedly worse than with the optimum. The ll*
sector would therefore appear to be the most cost effective size. Without a cost constraint, a 6* sector is the more
ideal size, but this would represent a doubling of sectors
for only slight performance increases.
The absolute optimum of 6* corresponds almost exactly to the central vision size. Therefore, the size judged most cost effective can be covered in about four fixations of the eye. The subject would seem to be capable of
conduc-ting such a small term scan efficiently. When the sector
is as large as 22*, requiring on the order of twenty well
placed fixations, his efficiency drops dramatically. A closer study of the exact relationship between scan proce-dures and search effectiveness might develop a means of
enlarging the optimum search area to a more economical size. Such techniques might include differently shaped sectors,
pilot training or scan guides with a single sector. If such a technique could be employed effectively, a
consi-derable savings in PWI cost might be realized.
In summary, this study concludes that a PWI instru-ment should probably have the following features:
(1) Equal area sectors throughout the field of view.
(2) Sectors of between 100 to 150 on a side.
It also recommends that further work be devoted to
a more careful study of the exact role of the central vision in a detailed search task. It also recognizes that devia-tion from conclusions (1) and (2) may be desirable in cer-tain cases due to further considerations. A typical such consideration might be a concentration of PWI resolution
APPENDIX I
The following instructions were read by each of the subjects before the experiment. A sample table of random numbers is also included.
Instructions
This experiment is designed to test various factors
involved in visual search procedures. You will be given
two tasks, a primary search task and a secondary background
loading task.
Primary task
You will be presented with a series of search
situations to be solved. Each of these trials will
be similar in nature with certain parameters varied
between trials. A single trial will consist of the
following:
1) An alarm will sound indicating the beginning of
the trial.
2) An area to be searched will be marked out on the
screen by enclosing it with a white square.
3) A target to be searched for will be displayed
somewhere within the search sector. This target is
an enlongated triangle which will be pointing
either up,down,left, or right.
You are to search the indicated region for the triangle
and when you have located ityou should press the
hand held button. This portion of the task should be
performed with as much speed as possible.
After pressing the hand held buttonthe target and
sector indication will disappear. At this time,you
should press the panel button which corresponds to the
direction in which the triangle was pointing.
Time is not important in this phase of the trial so
take your time and press the correct button. Press
these buttons firmly so as to assure switch closure.
If the projector motor stops without presenting a new
trial,the computer is waiting for your response. Repeat
your response if you have already pushed the button.
If you have not yet responded,respond normally.
Return to the secondary task at this time and await
the next alarm.
Note: Failure to respond within 32 sec. after the onset
of the alarm is interpreted as a failure to
locate the target and the computer will
automati-cally record such and proceed to the next trial.
At the end of the 32 secondsthe alarm will be
turned off and you should return immediately
to the secondary task.
Secondary Task
You are provided with a sheet of numbers. Work from left to right, line by line, performing the following task:
1) Mark through chains of 3 increasing digits with
a red pen.
2) Mark through chains of 3 decreasing digits with a green pen.
Note: a) Once a chain of digits has been marked
through, they may not be used or incorporated into other chains.
b) In the case of a conflict where a single
digit could be part of either of two different chains, mark the first occurring chain. For
example, 25743 contains the chain 257 and 743 but only one of these chains may be marked since
they share a digit. Mark the 257 chain.
c) A 3 digit chain must not be part of a
larger chain of four or more digits. For example, 234567.
d) Ignore the spaces between groups of five digits as these are merely to assist you in keeping track of your place.
e) Start over at the beginning of each line; do not try to run a chain off the end of one line and onto the beginning of another.