The "+Add" Model
A proposed Strategic Framework to Create Agile High Performance
Aerospace and Defense Product Support Supply Chains
ByMina Riwes
B.Sc. Management Information Systems, Rochester Institute of Technology, 2000
Submitted to the Engineering Systems Division in Partial Fulfillment of the
Requirements for the Degree of __________________S_____
MA SSACHUSETTS INSTUTUTE Master of Engineering in Logistics
at the
Massachusetts Institute of Technology
June 2013
K 2013 Mina Riwes All rights reserved.
The authors hereby grants to MIT permission to reproduce and to distribute publicly paper and electronic copies of this document in whole or in part.
Signature of Author... ... . . . ... ... ... Master of Engineerin J i 4istics Program, Engineering Systems Division
May 6, 2013
C ertified b y ... ... ... Dr. Jonathan L.S. Byrnes
MIT Senior Lecturer
Center for Transportation and Logistics
Thesis Supervisor
A ccep ted b y ... ... p . ... ...
dProf. Yossi Sheffi
Elisha Gray II Professor of Engineering Systems, MIT
Director, MIT Center for Transportation and Logistics
The "+Add" Model, a proposed Strategic Framework to Create Agile High Performance Aerospace and Defense Product Support Supply Chains
by
Mina Riwes
Submitted to the Engineering Systems Division in Partial Fulfillment of the
Requirements for the Degree of Master of Engineering in Logistics
ABSTRACT
The U.S. Aerospace and Defense industry is a vital organ for national security and humanitarian disaster response as well as an economic powerhouse creating jobs and driving exports. News headlines often stop at the sale of complex, hi-tech and expensive defense systems short of
capturing the critical aftersales support. However, it is the aftersales support that enables the mission to be accomplished. Without a well-functioning product support supply chain, even the most advanced fleet of fighter jets is rendered useless. This paper looks in-depth at such support
supply chains within top industry companies. The investigation spans the current and desired states, and gaps the difference. It also establishes a visionary roadmap to get to the desired state and ensure optimum performance. The research proposes the "+Add Model", an easy to
understand 5-level framework to achieve Global Optimization. The +Add Model acronyms stand for Aggregate Dynamic Derivatives, which are key elements in the framework. Aggregate refers to enabling a one integrated supply chain approach at the prime-integrator to benefit from
economies of scale elements such as risk pooling and large discount buys. Dynamic refers to enabling a continuously improving supply chain through feedback loops making the supply chain agile. Derivatives refer to the realization that the supply chain is full of hidden derivatives (or levers). As in calculus, the derivative is a measure of how a function changes as its input changes. The +Add model identifies those main supply chain derivative functions and inputs, and then aims to fine-tune them to drive performance. By adopting the +Add Model a prime-integrator is able to improve demand forecast accuracy (Level-1), system planning lead times (Level-2) and increase collaboration with the supplier (Level-3). In turn, levels 1 through 3 enable significantly reduced supplier lead times (Level-4). Finally, as various programs apply the
+Add Model approach, Aggregation (Level-5) provides additional benefits such as increased
forecast accuracy, discount buys, and lower safety stock inventory through centralization. The
+Add Model has a significant impact to the button line, analysis reveals substantial
improvements to earnings, economic profit and cash flow while maximizing performance and reducing risk.
Acknowledgements
I wish to acknowledge the fountain of Life Himself; the Light through which I see light, the
Logos through whom wisdom is derived, my savior, my Lord and God Jesus Christ....for His amazing work in my life.
I wish to thank my beautiful wife Marian for her support and sacrifice, my kids Gabriella and
Michael for being my greatest inspiration. My dad Fr. Mina Riwes who unceasingly prayers and watches over me from heaven above, my mom Reda for her unparalleled love through the years, my brother Amir and sister Basant the best siblings one could ever ask for.
I would like to recognize my good friend and colleague John Steingruby for his support,
leadership and insights that made this research possible.
I would like to express my gratitude to Professor Jonathan Byrnes for his knowledge and
guidance through the research; his insights are truly invaluable towards the personal learning experience.
1 Table of Contents
1 Table of Contents ... 4
1. Introduction...6
1.1 Industry Basics ... 6
1.2 The N ature of the problem ... 7
1.3 The Proposed Solution ... 8
1.4 N um erical adjustm ents...9
2 Literature Review ... 10
2.1 Custom er focused strategy ... 10
2.2 Supplier M anagem ent ... 11
2.3 Basis of quantitative analysis ... 11
2.4 Inventory Target Levels ... 12
2.5 Inventory Turns...12
2.6 Centralized W arehousing ... 13
3 M ethods ... 14
3.1 Data Collection and analysis... 15
3.1.1 The D em and Forecast... 16
3.1.2 Inventory Position ... 17
3.1.3 Target Stock Level (TSL) ... 17
3.1.4 Total Relevant Cost (TRC) ... 19
3.1.5 Centralized W arehouse Aggregation... 20
3.1.6 D iscount Buys ... 20
3.2 Conducting interview s with key personnel ... 21
3.3 Attending and observing w orking meetings... 22
3.4 Review ing program perform ance charts ... 23
3.5 Studying functional procedures... 23
4 Analysis an d Results ... 24
4.1 Current Supply Chain Overview ... 24
4.2 M ake-To-Order vs. Stock-To-Service... 25
4.6 System Lead Tim e...30
4.7 Aggregation initiative...31
4.8 Decentralized vs. centralized W arehousing ... 31
4.9 Recom m endations ... 33
4.9.2 Level 2: System Lead Tim e Accuracy ... 37
4.9.3 Level 3: N ew -Buy Plan A ccuracy ... 39
4.9.4 Level 4: High Perform ance Lead Tim es ... 41
4.9.5 Level 5: Aggregation...47
1. Introduction
The "+Add Model" Stands for Aggregate Dynamic Derivatives. It aims to add value to the aerospace and defense (A&D) industry by globally optimizing product support (after sale) supply chains through an easy to understand and deploy 5-level framework. It was developed as a proposed solution after researching current issues and identifying gaps in typical aerospace and defense product support supply chains.
1.1 Industry Basics
The Aerospace and Defense (A&D) industry is a vital organ for national security, humanitarian disaster response as well as an economic powerhouse. News headlines often stop at the sale of complex, hi-tech and expensive systems. However, it is the aftersales support that enables the mission to be accomplished. Without a well-functioning aftersales support supply chain even the most advanced fleet of fighter jets is rendered useless.
When out-of-control, A&D product support supply chains can spiral into cost overruns in the billions of dollars. The issue is only amplified by recent budgetary pressures. Consequently, the
question becomes should programs be cut to keep with fiscal responsibility? But there is a better question to be asked, how can the programs be manage more effectively, thus realizing billions in cost savings.
This research aims to find the root cause of extended lead times and then develop a model to significantly reduce them, which in turn would enable significant cost reductions in weapon systems support while also improving performance. This model should be of primary interest to defense customers and industry players alike, as it will provide savings to the taxpayer without
customer, prime integrators and their respective suppliers. As all three stakeholders realize additional gains, they will seek to further extend the collaboration and in turn the model will prove even more effective than initial engagement.
The research is primarily written to enable the support prime-integrator', as the lead, to achieve higher performance. However, it does require the support and collaboration of both customer and lower-tier suppliers. As can be seen from diagram in Figure 1, the prime-integrator is at the center of the supply chain, playing the vital role of "the link" between the customer and the supplier.
Prime
Integrator
Defense Customer I
Figure 1: Supply Chain link 1 .2 The Nature of the problem
It is perplexing how prime-integrators are able to successfully develop highly complex weapons systems, yet are sometimes unsuccessful executing the seemingly simple supply chains that support the product after the sale. Also puzzling is that the latest proven supply chains "buzz" initiatives such as forecast aggregation, supplier collaboration or risk pooling don't always solve the problem.
The objective of the research is first to unravel the mystery behind the poor performing supply chains, and why high-flying initiatives sometimes don't work. Then it paints the vision of an effective desired state supply chain. Finally, it provides an easy to understand a systematic 5-level process to achieve the goal.
Large prime contractor, often the OEMs, hired to execute the support contract with full responsibility for its flawless execution. Looked upon to provide technical oversight of sub-suppliers and supply chain innovation.
The research tackles the issue both qualitatively and quantitatively. This is because supply chains cannot be viewed only numerically; however analytics are an integral part. As mentioned by Prof. Jonathan Byrnes during supply chain case studies class at MIT2, numbers provide "an
anchor" to start the discussion and establish a baseline; however, the right quantitative answer may not be the most optimized.
1.3 The Proposed Solution
The "+Add" model is the culmination of the research. It was developed with the realization that for ideas and recommendations to be adopted, they need to be effectively communicated and easy to understand. To achieve agility and drive high-performance A&D product support supply chains, the model highlights the importance of the Agile Ring depicted in Figure 2 with its three main components: Aggregate Dynamic Derivatives.
Aggregate refers to enabling a one company prime-integrator approach to supply chain
management. This is done through forecast aggregation of common parts through various programs, which in turn enables a more accurate unified forecast for supplier planning and taking advantage of economies of scale such as larger quantity discounted buys as well as lower safety stock through shared warehousing risk-pooling.
Dynamic refers to enabling agility by continuously improving the supply chain through feedback
loops. This is achieved through focusing on critical data elements such as the demand forecast and lead time, tracking their forecast to actual, measuring the variance and then updating the input data, which in turn enables a more accurate output.
Derivatives refers to the realization that the supply chain is full of hidden levers. As in calculus,
the derivative is a measure of how a function changes as its input changes; the model identifies those main supply chain derivative functions and inputs, then aims to fine-tune them to drive performance. When unidentified, hidden derivatives make a "whack the mole" game out of
supply chain improvements. Proactive supply chain managers often find themselves with unintended consequences from a previous solution they implemented. They then fix the latter
only to find that the fix produced yet another unintended problem.
Agile
Figure 2: The Agile Ring
1.4 Numerical adjustments
For confidentiality reasons, the numbers published in this research financial or otherwise- are only representative. However, the recommendations derived from them provide a good
2 Literature Review
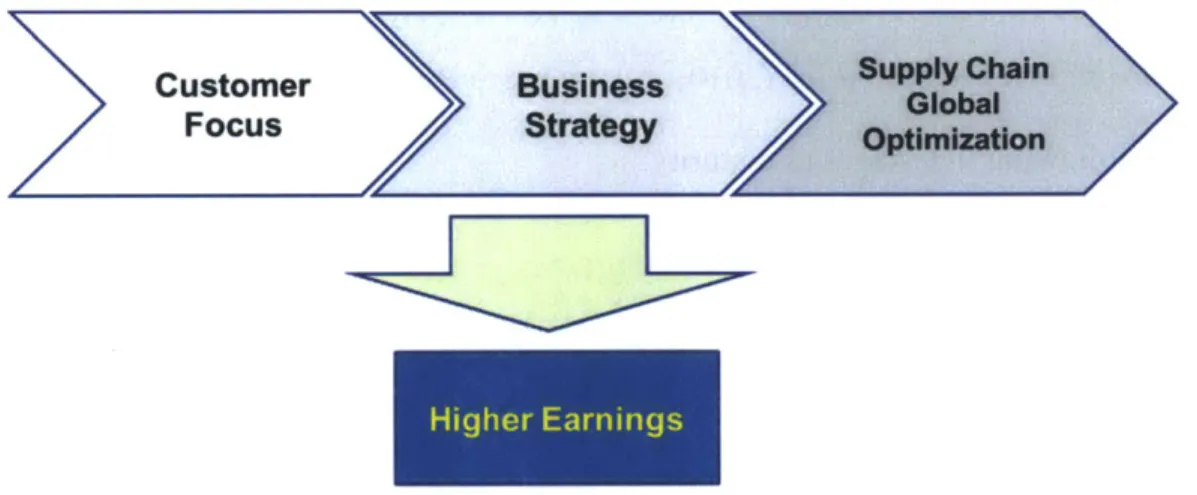
The aim of the research is to provide a framework that enables high performance aerospace and defense product-support supply chains. Such a goal is achieved only by considering the end-to-end supply chain and finding the global optimization. In addition, a series of correctly sequenced alignments need to occur-that is, aligning the supply chain with the business strategy, which in turn must be focused on the customer. This approach highlights the vitality and progress of the customer-supplier relationship. Figure 3, below, shows the relationship of the segments which ultimately drive higher earnings.
Figure 3: The path to driving higher earnings
2.1 Customer focused strategy
According to Monahan and Nardone (2007), the supply chain and the business strategy need to align. A prime-integrator in product support must not begin supply chain planning with internal costs but with the customer, then work outward from there. The prime-contractor has two
performance. The second is the taxpayer, who is looking for the government official to minimize costs. Thus, the strategy should be built around those two customer objectives -- performance and cost. The supply chain, in turn, should reflect them.
2.2 Supplier Management
In decades past, A&D companies such as Lockheed Martin, the Boeing Company and Raytheon have shifted from manufacturing to the outsourcing of components. Thus a prime-integrator is not able to successfully support the customer without having effective relationships with its suppliers. The heart of the +Add Model lays in effective supplier management; it is not about ordering the supplier one way or another, but rather about nurturing the relationship through collaboration. Dr. Jonathan Byrnes highlights the importance of this connection in his book
Islands ofProfit in a Sea ofRed Ink (2010). According to Byrnes, a customer's supplier may go
through the following five stages of maturity:
1. Stable
2. Reactive
3. Efficiently reactive
4. Efficient proactive
5. Revenue and margin driver
2.3 Basis of quantitative analysis
Having achieved the correct strategic alignment from being customer focused and effectively managing the partnership with suppliers next is tactical effectiveness which is partly achieved through numerical optimization. This was also the basis of quantifying the current state as well as evaluating the benefits of the desired state (proposed model).
The research focuses on the inventory aspect of supply chain optimization. In product support, inventory is the difference between success and failure. Not having the right inventory means shortages and not meeting contractual obligations. Excess inventory could mean write-offs and financial loss. Basic inventory management notes that all things being equal, carrying lower inventory is better (Silver et al., 1998).
2.4 Inventory Target Levels
To achieve the required performance levels while minimizing cost, it is necessary to set the right Inventory Targets. A typical A&D inventory planning tool has a continuous review management system with a min-max review category. Thus the Inventory Target for a particular part
comprises the Re-Order Point and Re-Order Quantity, which together make up a Order-Up-to (s,S) System (Silver 1998). The Re-Order Point is the forecast over the lead time plus safety stock (Silver et al., 1998), while the Re-Order Quantity is often the well-known Wilsons Economic Order Quantity (Silver et al., 1998).
2.5 Inventory Turns
Assuming the same performance levels can be maintained, the lower the Inventory Targets the better the company margins. Thus the desire to have as high as feasible inventory turns given the
supply chain service requirements. According to Rivkin and Porter (1998), the competitive advantage Dell computer had over its competitors early on was the high inventory turns. The Inventory Turns formula can be defined as Cost of Goods Sold over average inventory (Weygandt et al., 1996).
2.6 Centralized Warehousing
Today, prime-integrators, for the same platform, typically have separate warehouses for different customer programs. Thus they have isolated safety stock for common parts, not taking advantage of any risk pooling between programs. According to Cooke (2010), the well-known toy maker Lego was able to reduce costs by 20% by reducing the number of distribution centers. This noted reduction is in line with the classic inventory theory that states the ratio of total relevant cost reduction in safety stock is equal to the square root of the ratio of the number of distribution location reductions (also known as the Square Root Rule).
3 Methods
Actively managed supply chain programs by prime-integrators within industry must be analyzed as a first step to building an effective framework for improving A&D product support supply chain performance,
Within the contractor, three product support supply chain programs were analyzed. The
programs pertain to different customers in different regions of the world. Two of the programs have had major problems in the past and are considered turnarounds; the third was in its initial phase at the time of the analysis. They also differ somewhat in the type of service they provide. It was important to include different kinds of supply chain programs, both to see the common thread and also to provide a proposed solution that will satisfy a representation of different types of aerospace product support supply chains.
A full picture of the present situation was primarily painted through the following five methods:
1. Various data elements on 3,000 Items
2. Conducting interviews with key personnel
3. Attending and observing working meetings
4. Reviewing program performance charts 5. Studying functional procedures
The five different gathering methods were as if 5 different video cameras were recording a situation from different angles. As a result, a very powerful film of the current state, with its strength and weaknesses, was imprinted in the research.
3.1 Data Collection and analysis
The data collected and analyzed included two years of historical and current data related to individual parts (items) as well as overall program data. Table 1 shows the specific data elements collected, divided into two categories; specific part-level data and general program level data.
Table 1: Data Elements Collected
Part level data included Program level data included3
1. Part Number Total Inventory level Cost
2. Part Description Total Target Costs
3. Monthly Forecast Contracted Performance Metrics
4. 2-year Demand Achieved performance
5. Lead Time Overall forecast accuracy
6. Unit Cost
7. Quantity buy discount (some parts)
8. Associated Network (ABC)
9. Current Inventory
10. Forecast Accuracy
11. Current ROQ
12. Current ROP
3.1.1 The Demand Forecast
Each weapons system support program produces its own forecast. In one Depot repair program, for example, the forecast is developed based on an end item induction schedule and associated piece part replacement rates, while for flight hour driven demand a casual forecast is used. Other
programs utilize the exponential smoothing method. For the purposes of the research,
determining the appropriate forecasting method was not a goal, thus the different forecasting methods were not compared to each other for best method.
For measuring the forecast accuracy, Weighted Mean Absolute Percent Error (WMAPE) metric with a one-year moving average is used. WMAPE is a good method in this context for two main reasons. The "absolute" aspect ensures that the over forecast is not cancelled by the under forecast, thus giving a true representation. The "Weighted" cost aspect gives the right emphasis. For example, inaccuracy in a ten cent part is not weighted the same way as a fifty thousand dollar part.
The WMAPE formula utilized, where A is the Actual Demand in dollars (demand x unit cost) and F is the Forecast in dollars (forecast x unit cost).
EI(A-F)| x 100 x A (1)
WMAPE
= A (Z A
WMAPE Formula used in research
Mean Absolute Percent Error (MAPE), is another forecast accuracy method that is considered. MAPE is almost the same as WMAPE with the exception that WMAPE considers the unit cost of the part. The research revealed that for an overall program metric WMAPE is the better metric
as it is more representative; however, there is relevance for the demand forecaster to also track MAPE at an item level. The details on WMAPE and MAPE are provided in section 4.5
3.1.2 Inventory Position
The Inventory Position data collected and analyzed includes On-Hand Inventory, In transit Inventory, plus On-Order Inventory minus any potentially outstanding back orders. It is assumed that for all the weapon systems programs an IT system is already in use that tracks the inventory position and feeds it to the optimization tool on a nightly basis.
>
On
In
on
Order
Transit
Hand
ShortageFigure 4: Inventory Position
3.1.3 Target Stock Level (TSL)
The TSL represents the future inventory. It is the plan the supply chain marches to. Thus functions such as the asset managers are putting order in the system to bring the inventory level to the TSL.
All programs are within the min-max, continuous review category; thus we have an Order-Up-to
(s,S) System. In essence, the Target Stock Level is the summation of the Re-Order Point quantity (s) and the Re-Order Quantity. In its simplest form, the TSL formula can be states as:
TSL=ROQ +ROP
(2)3.1.3.1 Re-Order Quantity (ROQ)
The Re-Order Quantity,
Q,
is the order quantity that will be requested from the supplier once the inventory position is equal or less than the reorder point. It also serves as the toggle to establish the rhythm of the supply chain. An optimizedQ
can be calculated through the traditional Economic Order Quantity formula (3) below. Where A is the fixed cost per order, D is the demand per year, v is the unit cost and r is the holding cost rate per year.2AD (3)
Q =
V
Optimized Order Quantity formula
Once an optimized
Q
is found, a consistent replenishment cycle time can be established through the following formula (4) below. Where T is the cycle time, D is the demand per year andQ
isthe Re-Order quantity.
T
=
(4)D
Time cycle formula
There is a case for conversion from
Q
to T to keep a consistent flow in the supply chain. In addition, optimizedQ*
and T* can be established while taking into consideration discount buys from the supplier. See section 3.1.6 for additional information on discount buys.The utilized order quantity does not necessarily have to be the EOQ. Order quantity may be based on an agreed upon number of month of forecast. However, the EOQ provides an optimized baseline.
3.1.3.2 Re-Order Point (ROP)
The Re-Order Point is comprised of two elements. Forecast over lead time, and safety stock. It can be represented by the following formula (Silver et al., 1998):
s = X + ko- (5) Reorder Point Formula
The safety stock comprises the "o-" sigma, which is the demand variation over lead time. The"k" is the factor selected to achieve a desired fill rate or service level. In the aerospace and defense industry, while forecast has been relatively predictable (when compared to other industries such as the retail fashion or high-tech industry), lead times, on the other hand, have been
problematically high. As can be noted from the Re-Order Point formula, lead times play a critical role on the size of the inventory. The research aims to find the root cause of extended lead times and then find a way to significantly reduce them.
3.1.4 Total Relevant Cost (TRC)
Minimizing total relevant cost is an important driver in supply chain planning; thus it is used throughout the research to compare alternatives. In most cases total relevant cost is defined as the holding cost, ordering cost and the purchase cost. Purchase cost is considered when the unit price is affected by the quantity buys.
TRC = Holding Cost + Ordering Cost + Purchase Cost (6) Total Relevant Cost (TRC) Formula used
3.1.5 Centralized Warehouse Aggregation
The benefit of a centralized warehouse, that is shared across programs for common parts, is evaluated based on the following aggregation and risk pooling formula:
ROP = (Le) (D) + (z) (STD) ( Vi)4 (7)
Multi-echelon Reorder Point Formula
Where Le is echelon Lead Time, D is the average demand at the retailer, and STD is the standard deviation of demand at retailer. The above illustrated formula (7) is used in sections 4.7 and
4.8.5.3
3.1.6 Discount Buys
When calculating the benefits of a discount buy, the following formula is utilized:
I +AD vorQ TRC=
Q
2 AD vo (1-d )rQ QDvo(2-d
+ + )sQ
Q (8) Qb r QDiscount buys Formulas and procedure
Where TRC is Total Relevant Cost, D is Demand, Vo is price before discount, d is percent discount, r is the annual holding cost rate,
Q
is Order quantity and A is fixed Order cost. Please refer to section 4.8.5.2 for specific example of the discount buys formula (8).3.2 Conducting interviews with key personnel
One-On-One interviews were conducted with personnel representing key functions in the supply chain. The wide-ranging interviews are a good source of different perspectives within the same company and supply chain. It was found that a logistics representative (employee of prime integrator) who is embedded with the warfighter (end customer) thinks very differently of the same situation than a supplier management person who works partly out of the supplier site (but who is also an employee of the prime integrator). It was important to conduct these interviews separately to have people speak their minds without strong personalities influencing the
conversation. The separation also, to a certain extent, reduced groupthink. In addition, it revealed current frustrations.
The following roles were interviewed individually:
* Logistics Representatives (Customer perspective)
e Supply Chain Sr. Program Manager (Performance driven) e Supply Chain Planning Function, Sr. Manager
* Asset Manager e Demand Forecaster
* Supplier Management (Supplier perspective)
The format of the interviews varied depending on what was feasible and who was available. Some interviews were conducted face to face, others through telecom-WebEx. Some people were interviewed more than once (follow-ups after investigation suggested by them in the initial interview). Some interviews were longer than others. In all cases, it was important to let them speak freely and not hindering them even if bias they had a clear bias. Sometimes parties agreed, while other times they disagreed. The results of the interviews will be discussed in detail in
coming sections. Also the researcher highlighted the fact that they do not represent any particular group or bias and was simply after extracting their perspective.
Interviews were generally less structured and informal. This was to encourage participants to be themselves and share how they truly felt. There were three open ended questions that were asked:
1. How do you feel about the current state of the supply chain?
2. From your perspective where do you see the biggest issues in the supply chain?
3. What would you recommend be done?
The interviews evolved around the noted three questions, but it was more of discussion atmosphere then a Q&A session.
3.3 Attending and observing working meetings
Observing working meetings allowed for the collection of valuable information on the
interactions between the various supply chain functions. It also gave a better understanding of the current issues and a feel for the daily battle rhythm of the operations. The following meetings were observed:
1. Quarterly Strategy Session
2. Monthly planning meeting
3. Bi-weekly collaboration meeting
3.4 Reviewing program performance charts
A sample of program standard deck PowerPoint package charts were collected and examined.
They provided insights into historical performance, recurring themes, as well as, what was important enough to track and status.
3.5 Studying functional procedures
Standard functional procedures were collected. Some were documented; others were gathered through the gathering methods mentioned previously in this section. They include key elements
such as updating of lead times, measuring of forecast accuracy, and dealing with customer critical shortages. Current functional procedures aided pinpointing issues and identifying root cause.
4 Analysis and Results
In order to provide a model that unlocks agile higher performing A&D product support supply chains, the current state must be analyzed and the gap from it to a desired state identified Suggested improvements to bridge the gap should follow. Finally, the recommendations will be organized into an easy- to- communicate framework: the supply chain "+Add model".
4.1 Current Supply Chain Overview
From an overall overview picture, it is perplexing how a prime-integrator is able to design and bring to market complex systems such as fighter jets and Unmanned Air Vehicles (UAVs) yet
have difficulty managing the corresponding support supply chains. Among the problems is excess inventory, as will be shown in this chapter
In the current A&D support supply chain, typically the prime-integrator signs up with the defense customer for a Performance Based Logistics Contract (PBL). PBLs have become popular over the last decade as customers have realized that it is much better to buy
"performance outcomes" than "transactional" spares that don't guarantee the end goal. Thus a typical contract commits the prime-integrator to providing a certain fill rate or aircraft
availability at a fixed price .In turn, the customer commits to buying three to five years of service with the prime-integrator. The prime-integrator then buys from suppliers the right inventory targets based on the forecast, lead times and performance targets. In recent years prime-integrators have developed and acquired sophisticated tools to calculate optimized levels based on the latest inventory theories. A lot has been done to optimize based on the "given" supply chain design; however, not enough has been done to "change the given". Today, most
supply chains are not designed for global optimization, so the current optimizations, though using sophisticated tools with advanced algorithms, remain local within a specific section of the supply chain.
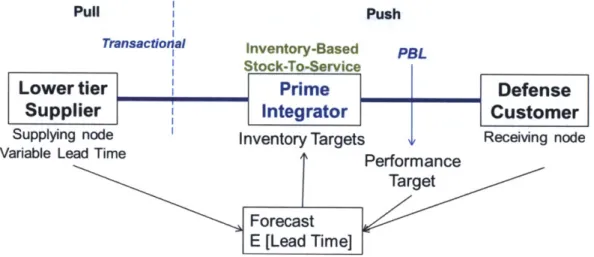
Another key finding is that the front-end of the supply chain changed drastically from transactional based buying to Performance Based Logistics (PBL), while other areas of the supply chain are still doing business the "old way", i.e., running with a transactional business mindset. The PBL needs to trickle to other segments of the supply chain. Figure 5 shows the current supply chain integration.
Pull Push
Transactioral Inventory-Based
PBL
Stock-To-Service
Lower tier Prime Defense
Supplier Integrator Customer
Supplying node Inventory Targets Receiving node
Variable Lead Time Performance
Target
Forecast e
E [Lead Time]
Figure 5: Current Supply Chain Integration
4.2 Make-To-Order vs. Stock-To-Service
A major issue identified in the current supply chain is that the prime integrator operates an
inventory-based Push system, what the research coins as Stock-To-Service (STS), while the supplier operates a fully Make-To-Order (MTO) Pull System. This causes the prime integrator to hold the entire burden of the inventory to achieve customer contracted performance targets. Furthermore, the prime integrator bears all the risk in case of excess inventory, as well as
shortages. The lower tier suppliers should be viewed as possible areas to stock inventory. The inventory optimizer should be extended to include upstream supplier locations. Section 4.9.4 provides a detailed walkthrough how collaboration with the supplier drives the supplier to become more of Make-To-Stock (MTS).
4.3 Non-optimized padding
The graphs showed in Figure 6 and Figure 7, reveal that the customer as well as prime integrator personnel who are at the front end of the supply chain tend to provide forecasts that are bias towards being inflated with the mental model of "have a little more to ensure we have enough". This is revealed in the earlier month, prior to the over forecast issue being tackled. By separating the over forecasting error from the under forecasting error the bias is revealed. The interview with the logistics representative6 revealed that in one case the forecast was used as means to
adjust inventory.
In addition, suppliers, as well as, prime integrator staff members who are at the back end of the supply chain, tend to provide inflated lead times to ensure they meet their primary metric of meeting delivery dates.
As a result of having inflated forecasts and inflated lead times, the program overbuys inventory. Given all the excess spending, budgets become stringent and not enough money is left to buy what is actually needed; thus critical shortages become prevalent. The bias as well as the effect on the inventory are quantified and revealed in subsequent sections.
4.4 Effect of poor forecasting on lead times
According to an interview with supplier management, in the past top suppliers were provided with a best effort, but poor forecast. In one case the forecast was so highly inflated that it caused
good-willing suppliers to over-produce and over-hire only to be left with excess product and having to let go as much as 40% of the workforce. This caused the supplier not to trust any given
forecast by the prime integrator. As gathered from the interview with supplier management, the supplier mantra is now: "I will make it only when you commit to buying it". This has caused lead times to increase, however, according to supplier management; the supplier is willing to work with the prime integrator if they can prove they have an accurate forecast.
4.5 Causes of Inaccurate Demand Forecasts
The research has revealed five reasons for the inaccurate
forecast as summarized in table 2. First, as mentioned above, the supply chain front-end has a bias towards inflating the
forecast. Second, analyzing one program showed that the planning team trusts a defective IT demand feed, some demands types were being double count thus producing an inflated forecast. Yet another program had the opposite
Table 2: Cause of forecasting issues
i General Errors due to lack of information at the time or bias 2 Demand System double counting or
missing demands
3 "Clinching"of parts by shop floor mechanics due to historic shortages in an attempt to secure supplies. 4 Natural variation
5 External Forces (e.g. expected lower demand due to sequestration). problem of not accounting for shortages, thus entrapping items into a catch-22 of not forecasting because they could not satisfy the demand. These two issues are hard to identify because the actual demand the forecast is measured against is in itself inaccurate. Furthermore, in some cases the forecasting function doesn't really have a good way to measure forecast accuracy. When using MAPE (Mean Absolute Percent Error), the overall forecast error is so high that forecasters are discouraged and feel uncomfortable sharing, while other forecasting teams bundle all the
overages with the underage, producing a "false" sense of security with a low forecast error, but in reality it is a meaningless metric.
Lastly, the supplier is provided with the program demand forecast. This is what the program expects to issue to the customer, which is different than the buying pattern from the supplier. The prime integrator buying pattern from the supplier does not only depend on the demand forecast, but also on the inventory policy (Reorder Point and Reorder Quantity) as well as current
inventory levels. The demand forecast quantity and pattern is very different than the on order pattern and quantity from the supplier. Section 4.9.3.1 provides a walkthrough example of the
difference between the buying plan and a demand forecast.
Through interviewing management, it was observed that in some cases upper management had not been fully informed of the dynamics of forecast accuracy. From intuition upper management deducted that forecast accuracy should be close to the performance requirement (thus above ninety percent). In one instance, a program forecaster was proud to present their forecast
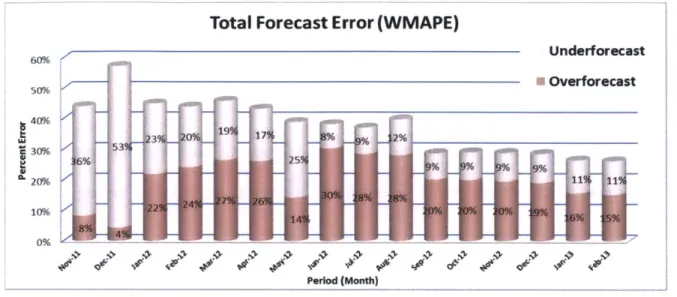
accuracy at 70% accuracy (Inverse of the 30% WMAPE), however, management saw 70% as an average "C" grade. Here also informing upper management of the mitigation of safety stock is important. As can be noted from the graph in figure 6, in June 2012 the Weighted Mean
Absolute Percent Error (WMAPE) was 38%. The over-to-under forecast was at a ratio of 4:1. This indicates a significant bias towards over forecasting based on observations of forecast and actuals of one particular supply chain program, over a period of 16 month, for 6,926 parts. However, as a continuous improvement process was implemented that tracked and adjusted errors in the forecast, the bias was eliminated resulting in a significant improvement in the overall forecast accuracy, from a WMAPE 38% in June 2012 to 26% WMAPE recorded in
Total Forecast Error (WMAPE)
Underforecast
i Overforecast
Period (Month)
Figure 6: WMAPE monthly Error
From analyzing the data and tracking current inventory over the same period, it is revealed that the over forecasting error was causing significant excess inventory. This can be observed from the graph in figure 7, which shows the inventory ratio over the same period of time. The inflated
forecast impact on the inventory was further magnified by the lead times. As the forecast improved, the target inventory went down significantly.
Ratio of Inventory Value caused by Over Forecasting
Z1 Le 9~ 1.30 1.25 1.20 1.15 1.10 1.05 1.00 0.95 0.90
Jun-12 Jul-12 Aug-12 Sep-12 Oct-12 Nov-12 Dec-12 Jan-13 Feb-13 Period
Figure 7: Monthly Inventory caused by over forecasting (ratio) 60% 5096 40% 30% 6% 20% 10% I I' U0
4.6 System Lead Time
Evidence from interviewing supplier management indicates that the lead times in the
procurement system are used to plan the inventory in the supply chain. They are a direct input for setting up inventory targets and in turn determining the new-buy quantities. The lead times are manually entered by personnel in the buyer function based on a mix of: supplier provided future
lead times7, historical lead times, as well as, buyer discretional padding.
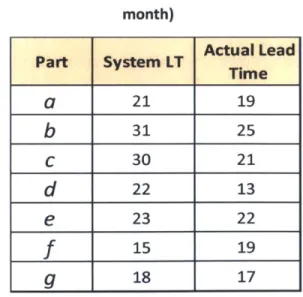
One interview with a program manager revealed that the performance of the buyer function is typically evaluated by on-time delivery. Thus company buyers tend to enter conservative' lead times, as it is easier to delay available products from the supplier, rather than expedite them. This
was apparent in the comparison of system Lead Time to actual lead time of 33 parts. Table 3 shows a sample of 7 parts comparing system lead time to actual (in month). Furthermore, research artifacts indicate that depending on the person, buyers add one to three months of
administrative time to the original lead time.
It is concluded from the interviews and meetings attended that perhaps some of the buyers and supplier management personnel do not fully realize the adverse impact of inflated lead times. An Excel model that illustrates the adverse financial effect of inflated lead times has been developed, this will help to change the mental model.
Table 3: System vs. actual Lead Time (in month) Actual Lead Part System LT Time
a
21 19b
31 25 C 30 21d
22 13e
23 22f
15 19g
18 174.7 Aggregation initiative
In recent months, organization-wide efforts have been made to launch a forecast aggregation initiative. While aggregation improves forecast accuracy, logic tells us that without first
achieving forecast and lead time accuracy, any attempt to aggregate the forecast for the purposes of sharing it with the supplier will not be as effective. One issue that might arise from not
improving the forecast prior to aggregation is finger pointing. When issues arise in the
aggregated forecast, if the forecast accuracy is not tracked at the program level, it will be hard to find the root cause.
4.8 Decentralized vs. centralized Warehousing
Today, each program manages an isolated warehouse. This causes each program to optimize safety stock separately, thus not taking advantage of risk pooling.
Currently, in a decentralized non-aggregated scenario, each program keeps its own safety stock. For a sample of common parts across the three programs analyzed, the total safety stock for those parts was $34 Million. In doing an analysis across three programs, risk pooling was found to bring down safety stock inventory by over 11%.
Total: $34M
Figure 8: Decentralized warehouse safety stock impact scenario
The calculation for the analysis utilized the ReOrder Point formula described in the methods section 3.1.5. A total count of 564 common parts were run through the specifically built simulator in Excel. In the current state scenario each in program inventory was calculated independently without consideration for a shared warehouse. On the other hand, for the desired centralized scenario, a multi-echelon shared warehouse was assumed. For this scenario it was assumed a 5 day lead time from the warehouse to the specific program depot. New buy lead time stayed the same. A service level of 85% was assumed with a corresponding k of 1.04. The benefits and recommendations of a centralized warehouse can be found in section 4.8.5.3.
Specific savings percentage will vary depending on service level, number of aggregated locations and part characteristics.
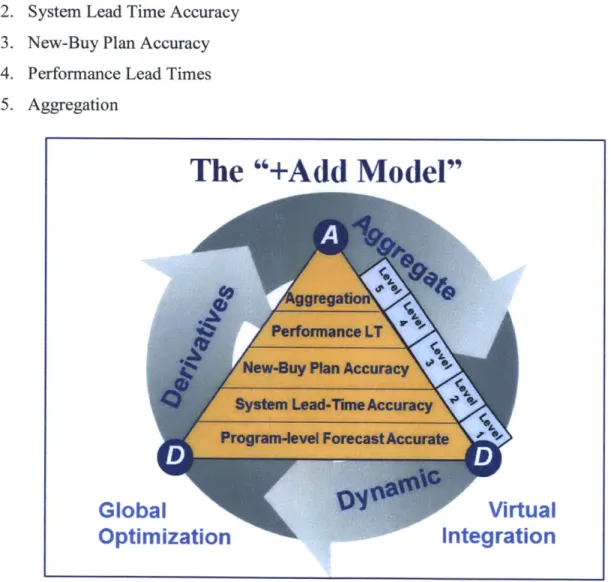
4.9 Recommendations
To achieve agile high performance product support supply chains, a 5-level systematic approach is recommended. Each subsequent level has a dependent interaction with the prior one. This is because the success and meaningfulness of each level is partly dependent on successfully achieving the previous level.
The five levels of the "+Add Model" are:
1. Program-level Forecast Accuracy
2. System Lead Time Accuracy
3. New-Buy Plan Accuracy
4. Performance Lead Times
5. Aggregation
The "+Add Model"
Global
'4
Optimization
F,
Virtual
Integration
Figure 9: The "+Add Model"
To follow is an explanation of each level and how they depend and interact on one another.
Level 1: Program-level Forecast Accuracy
Forecast accuracy is a foundational step. It is the cornerstone of a high performance supply chain. Without a relatively accurate forecast there will be no significant benefit to aggregation. Also the prime integrator will not be able to produce a reliable buying plan for the supplier. There are three critical success factors to Level 1: using the right metric, establishing a feedback loop, and level setting senior management expectations.
4.9.1.1 Using the right metric (WMAPE)
When measuring, using the right measuring stick is imperative. It is recommended that a
WMAPE9 be used. Programs ought to aim for WMAPE error at or below 30%. The percentage is provided as an anchor; it is subject to adjustment based on the specific situation. The 30% target was deducted based on several extrapolations. For one, it was observed in one particular program that the timing of reaching the 30% WMAPE mark coincided with improved program
performance and stability. Also it was apparent that shifting to other supply chain priorities was more beneficial than solely focusing on forecast accuracy to attain a couple more percentage
points. It is detected that there will always be an element of randomness in the actual demand. Thus forecast accuracy will never be perfect. The effect of a small error will be limited to a few extra buys (holding inventory slightly longer) or buying a little less than optimal (ordering more frequently). If the right safety stock optimization is in place it will help in mitigating the risk of shortages.
It is important to note that along with the overall WMAPE number that is shared with
management for the program, forecasters should track MAPE at the part level. This will help ensure program does not lose visibility of low cost parts.
Additional implementation detail includes a 1-year moving average is recommended. Individual part WMAPE can be at maxed 200% error at 200%. If certain parts are missing significant demands they can be excluded from the overall number. In short, a common-sense filter can be put in place for the overall number.
4.9.1.2 Continuous Inprovement Process
Without establishing a continuous improvement feedback loop, tracking the forecast accuracy is non-value add. A monthly process should be established to track the forecasted demand against actual issued demand; the cycle is depicted in Figure 10. Each month, the supply chain team should look at the top 100 parts by total forecast error dollar value, identify the root cause and then adjust the forecast if needed. The historical forecast should also be saved so it can be referred back to. Observed in one of the joint forecast development meetings with the customer" was a "pendulum-swing" of adjusting upward one time and then adjusting downward in the next review. This should be avoided. It is partly tackled by having a one-year moving average as well as referring back to the historical forecast.
Monthly
Figure 10: Forecasting Feedback loop process
1 Or any number they agree on, keeping in mind the 80/20 rule and focusing on the high hitters. 1 Where the percentage of replacement piece parts to end item induction is determined
On a monthly basis the forecast accuracy overall metric should be shared with the program manager, as well as the functional supply chain manager. At a lower level a working monthly meeting should be established to work on the highest error parts. This meeting should have representation from all the functional areas, including forecasters, asset managers, spares engineers, and logistics representatives. During the meeting the root cause would be identified and a resolution plan would be put in place. Table 4 identifies the potential solutions of the top five issues that were found across the studied programs.
Table 4: Potential Solutions to Forecasting issues
Root Cause Issue Potential Solution
IGeneral Errors due to lack of Adjust future periods forecast information at the time or bias
2 Demand System double counting or Test IT feeds well missing demands Add/delete issue code
3 "Clinching" of parts by shop floor Shape shop behavior, Establish mechanics due to historic shortages process to prevent above max in an attempt to secure supplies. expected demand pull per month
4 Natural variation Expected. Mitigated through safety stock
4.9.1.3 Level setting expectations
It is clear that the right expectation for forecast accuracy ought to be understood by all parties. The supply chain planning team should brief senior management on how a WMAPE error of
30%1 is reasonable. In addition, forecasting personnel should inform management that safety
stock is in place for the variance. After the program achieves an error less than 30% the focus should shift to other aspects of the supply chain, such as lead time reduction and manufacturing flexibility.
4.9.2 Level 2: System Lead Time Accuracy
Level 2 pertains to the system lead times used for planning the inventory targets. Having an accurate lead time in the optimization system allows for ordering parts from the supplier at the right time, for the reorder point is mainly the average forecast over lead time.
Similar to the forecast accuracy process outlined in Level 1, a continuous improvement feedback loop process needs to be established to measure the system lead time against actuals (the time between placing the order and when it arrives at the program dock). Figure 11 illustrates the this
specific cycle.
Quarterly
Figure 11: Lead Time Feedback loop
1 See section 4.8.1.1 on why 30% is recommended.
System lead times should be updated based on historical performance as well as input from supplier estimates if a foreseeable change is on the horizon. This feedback loop should be quarterly. When Level 4 is achieved (see section 4.8.4), then the system lead times may end up being lower than historical actuals as the supplier commits to reduced lead times in the future.
Lead times were investigated further for a subset of 32 parts. The system lead time was compared to actual lead time. Actual was calculated by subtracting order date from received date. For this particular subset of parts, it was found that overall current system lead times were padded by 5%. This padding in lead time caused an increase in target inventory in excess of 8%. The standard Reorder Point and Safety Stock formula was used in the inventory calculation as described in the methods section. This is because the Reorder Point has two elements of inventory impacted by lead time, one for the forecast over lead-time portion, and one for the safety stock portion. This 8% was equal to almost $900,000 for one program across only 32 parts. If this issue extends to the entire parts list of one program alone, the impact would
certainly be in excess of ten million dollars. At the company level (across multiple programs) it may reach a hundred million dollars.
In Days Average System LT 571 Average Actual LT 542 Difference in Days 29 Percent Padding 5% Figure
inventory Targets based on actual Lead Times
Inventory Impact
Inventory Target with current padded Lead Times
$10,000,000 $11,000,000 $12,000,000 12: Lead Time Padding
4.9.3 Level 3: New-Buy Plan Accuracy
After ensuring that the product support supply chain is being planned and executed on an accurate forecast and lead time, Level 3 can be implemented. In Level 3, a long range buying plan that looks out several years is implemented. The buying plan should provide both the program and top suppliers with the expected quarterly purchases of the respective items. The buying plan should be first started for the top parts by extended cost'3 on the program. It was
found that the top 120 parts (out of several thousands) accounted for 75% of the total cost. It is worth starting with the top 25 to 120 parts. On a quarterly basis, the suppliers will be provided with an updated buying plan, as well as the previous plan accuracy. This accuracy metric will increase the confidence of the supplier in the buying plan.
4.9.3.1 Elementsv of New-Buy Plan
There are four elements that go into the buying plan: lead time, demand forecast, current
inventory position, as well as the inventory policy (ROP and ROQ). Any change to one of the 4-elements will affect the buying plan. This is critical because it will help identify the root cause of the variance in the plan to what actually was bought.
Figure 13: The 4 forces shaping the Buying
In the accompanying example in, figure 23, the supplier was given a buying plan that is equal to the demand forecast of 20 a month. This is because the actual issued-to-customer demand
forecast was given directly to the supplier. The example shows that the supplier rushed into production and staging of finished goods inventory for delivery, but quickly realized that orders were not coming in as planned. What the prime integrator ought to provide is a true buying plan that takes into consideration the 100 units in stock, the reorder point of 50 and the reorder
quantity of 70. This plan indicates that 80 parts will be ordered in third quarter, while another 80 will be ordered 15 month later.
Demand Starting Ending New Buy Forecast Inventory Inventory Plan
Year 1: Q1 20 100 80 Year 1: Q2 20 80 60 Year 1: Q3 20 60 40 80 Year 1: Q4 20 40 20 Year 2: Q1 20 20 0 Year 2: Q2 20 0 80 Year 2: Q3 20 80 60 Year 2: Q4 20 60 40 80 Quarterly 20 Forecast ROP 50 ROQ 70 Lead Time (month)
4.9.4 Level 4: High Performance Lead Times
Now that the program has achieved a relatively accurate demand forecast (Level 1), relatively accurate lead time (Level 2) and has a process to develop and track a buying plan (Level 3), it is ready for implementing the pivotal high performance lead time (Level 4).
Level 4 aims to significantly reduce lead times from the supplier and in turn inventory. As will be demonstrated in subsequent sections, the inventory reduction as a result of the lead time has a
significant financial impact.
When the supplier is provided an accurate buying plan (Level 3), it is able to better plan for future demand. It was revealed from the supplier management interview that suppliers are willing to stage some inventory if they can trust the buying plan provided by the prime integrator.
In effect Level 4 aims to drive lead times down through making a paradigm shift in the supplier from Make-To-Order (MTO) to Make-To-Stock (MTS). Having the supplier increasingly stage inventory will bring down lead times, thus reducing both investment and risk, while increasing performance and agility.
The key is to arrive at a dynamic continuous improvement loop that produces confidence in planning and shapes supplier behavior towards staging stock and thus shaping a more globally optimized supply chain.
8-Step High Performance Dynamic Loop:
1. Provide supplier more
accurate buying plan _
8. Variance Root cause understood, needed corrections made 7. New-buy Plan Is published and tracked to actual 6. Target Inventory an Investment reduction
2. Increased Supplier trust of h Prime's ability to predict future buys 3. Increased of inventory supplier staging by 4. Commit Supplier to lower Lead Time
Figure 14: The 8-Step High Performance Lead Loop
4.9.4.1 Performance Lead Times for top cost drivers
In analyzing the data of a typical supply chain program at the prime integrator, we find that the top 25 parts by extended cost (Target Inventory x Unit Cost) account for almost 50% of the inventory cost. By contrast, a count of 25 parts
represents only 1% of the 2,500
Top 25 Parts
60.0% 50.0% 40.0% 30.0% 20.0% 10.0% 0.0%o -% Inventory Cost -% Part Count 1 3 5 7 9 1113151719 2123 25parts analyzed.
Trying to manage and drive down the lead times of thousands of parts is unrealistic and
unfruitful. Focusing on the high cost drivers is a key success factor. An initiative may start with the top 25 parts, and then quickly expand to include the top 50 and then the top 100 parts.
The accompanying table 6 shows the impact on inventory cost as the lead time of the top 25 parts is reduced.
Table 6: Impact of Lead Time Reduction
Reduction Scenario Inventory ($M) Reduction ($M) Reduction (%)
Baseline $ 117 -5% $ 115 $ (2) -2% -10% $ 112 $ (5) -4% -15% $ 109 $ (8) -7% -20% $ 106 $ (11) -9% -25% $ 103 $ (14) -12% -30% $ 100 $ (17) -15% -35% $ 97 $ (20) -17% -40% $ 95 $ (22) -19% -45% $ 92 $ (25) -21% -50% $ 88 $ (29) -25%
The results were reached through running 11 different iterations of the Inventory optimization calculations for each reduction scenario, plus the base case. In running the iteration, only the lead time was adjusted to create a controlled test, then the Target Stock Level (TSL) of each one of the top 25 parts was calculated. The TSL calculation involved adding the ReOrder Point (ROP) and ReOrder Quantity (ROQ). The formula used is as noted in the methods section 3.1.3 "Target
Stock Level (TSL)". Since ROQ is not affected by the lead time, the related portion of the TSL was not affected. However the ROP was affected, both for the forecast over lead-time as well as the safety stock.
For example, through the 8-step process noted previously in Figure 14, if "performance lead-time" is derived for only the top 25 parts and a 30% reduction in lead time was achieved, the optimized inventory investment, for one program, would drop from $117 million to $100 million. This $17 million drop would equal a 15% cost for the entire program inventory.
Similarly, at the 50% reduction level, the impact will be 25%. These cost savings are in addition to any cost savings realized at previous levels such as achieving high forecast accuracy (Level 1) and lead time accuracy (Level 2).
Inventory investment comes with a significant cost of capital. The reduction in inventory will improve earnings and overall affordability. It is also important to note that risk is reduced with the lower inventory, both the risk of shortage and the risk of excess, as the supply chain is now more agile.
Agile supply chains are able to quickly adapt to changing scenarios and align with customer needs. Certainly lower lead times, especially on the cost drivers, would enable an agile supply chain.
4.9.4.2 Staging of raw materials
One of the key success factors, as previously mentioned, is the transforming of the supplier from a Make-To-Order (MTO) to more of a Make-To-Stock (MTS) system. One of the specific actions the supplier can take is to buy raw materials in advance.
In analyzing a subset of 21 parts, related data was provided by supplier management for a major supplier. We find that the new-buy lead time given by the supplier is almost 70% driven by waiting on raw material from the second-tier, while the other 30% is production capacity. This is
Meetings with supplier management revealed that if the supplier was given accurate buying projections by the prime, they would be willing to do buy in advance a portion of raw material. Given that the lead-times are mostly driven by the raw materials, staging of raw materials will enable the 50% reduction in lead time.
Figure 16: Lead Time breakdown pie chart
Furthermore, in evaluating the raw material unit cost of the provided 21 parts, raw material cost on average was found to be 14 cents on the dollar when compared to end item unit cost. This suggests that it is more cost effective to hold a portion of safety stock as raw material. Because of the size of the opportunity, the prime integrator should consider the option to guarantee the purchase of raw materials.
Table 7: Sample of raw material cost to finished goods
Raw Material Post Raw Material Percent
Finish Part cost Production Cost of post Cost production Part A $ 250 $ 6,000 4% Part B $ 4,500 $ 22,000 20% Part C $ 1,800 $ 8,000 23% Part D $ 190 $ 6,000 3% Part E $ 450 $ 5,000 8% Part F $ 135 $ 830 16% Production i Prod7 l P",
68%
R !aw0 mat e 1, LT aterials LT4.9.4.3 Creative contracting
Commonsense tells us, that even though the interview with supplier management reveals that the supplier is willing to work with the prime integrator to drive lead times given accurate planning, the supplier needs to be fully incentivized to achieve significant performance. Thus Contracting is an important tool in driving towards supply chain global optimization.
One possibility is to contract a guaranteed maximum lead time with the supplier. For example a service metric of 95%, the supplier shall provide part e within 70 days of a placed order. In turn the supplier can optimize their supply chain and raw material inventory to achieve this goal based on a given demand.
Another possibility is to implement option contracts. In this case the prime integrator can purchase the entire buying plan (level 3) as an option at a fraction of the cost (perhaps covering the raw material). This removes risk from the supplier and incentives them to act on the buying plan. Now as the prime integrator receives the ordered parts, they pay the exercise price.
Finally, depending on the situation a cost sharing/revenue sharing elements can be added to the contract. The idea is to drive mutual benefit, shape supplier behavior towards a more globally optimized supply chain as oppose to a sequential and segmented optimization.
4.9.5 Level 5: Aggregation
Level-5, Aggregation, sits at the top of the pyramid of initiatives. Now that the performance of the programs has been ensured, aggregation becomes a leap forward in supply chain planning. This allows for both the benefits of individual managed supply chains as well as the power of integration and economies of scale. The first step is to implement aggregation into the
forecasting process and new buy supplier plan. This allows of benefits such as a better forecast accuracy and volume discount buys.
4.9.5.1 Forecast-Buving Plan aggregation
The research shows the value of developing an aggregation process. On a monthly basis, programs will send the forecast to the centralized forecasting staff along with their respective WMAPE score. In turn, the centralized forecasting staff will update an aggregated buying plan. The function will then on a quarterly basis provide the updated buying plan to the supplier'4.
It is important that the programs are still held accountable for their own forecast accuracy and that issues in the aggregated forecast can be pinpointed to a specific program. Along with providing the forecast, the programs need to provide the other elements such as the inventory
levels and inventory policy. Initially when this process is done through excel it will have to be limited to a smaller subset of parts. However, once value is recognized it can be automated through proper databases and IT feeds.