ACOUSTIC AND PERCEPTUAL CORRELATES OF
PHARYNGEAL AND UVULAR CONSONANTS
by
Abeer Abdul-Hussain Alwan B.S.E.E., Northeastern University
(1983)
Submitted in partial fulfillment of the requirements
for the degree of
Master of Science
at the
Massachusetts Institute of Technology
May, 1986
©Massachusetts Institute of Technology 1986
Signature of Author . ... .. . ./ . . . .
Department of Electrical Engineering and Computer Science
May 12, 1986
Certified
by
... .... .. .
..
...
Kenneth N. Stevens Thesis Supervisor Accepted by/.. .. .. . -... ......
..
Arthur C. SmithChairman, Departmental Committee on Graduate Students
Archives
JUL 2 3 19m) I/_ F R F-
-ACOUSTIC AND PERCEPTUAL CORRELATES OF
PHARYNGEAL AND UVULAR CONSONANTS
by
Abeer Abdul-Hussain Alwan
Submitted to the Department of Electrical Engineering and Computer Science on May 12, 1986 in partial fulfillment of the requirements for the degree of
Master of Science
ABSTRACT
This thesis investigates aspects of the production, the acoustics, and the percep-tion of pharyngeal and uvular consonants. First, we introduce theoretical models of the vocal-tract area function during the production of these consonants. From these models we calculate the formant frequencies and the contributions of different vocal-tract losses (localized losses: due to the impedances of the glottis, the constriction, and the radiation; and distributed losses: due to heat conduction and viscosity, and to the impedance of the walls) to the bandwidths of the formants for both an open-and a closed-glottis case (voiced open-and voiceless, respectively). The presence of a noise source, modeled as a series pressure source, in the vicinity of a supraglottal constriction introduces zeros to Uo/p, (transfer function from the volume velocity at the lips to the pressure source near the constriction). The zeros are in the vicinity of the back-cavity resonances (including the Helmholtz resonance). The location of the zero which is in the vicinity of the Helmholtz resonance is highly sensitive to the pressure-source loca-tion. Consequently, this resonance may or may not be cancelled. Other back-cavity resonances, on the other hand, are cancelled by zeros regardless of the pressure-source location.
Predictions based on the theoretical study were: (1) F1 for pharyngeals should be higher than that for uvulars, F3 should be lower, F2 should be approximately the same for both when the glottis is closed and should be higher for pharyngeals when the glottis is open; (2) for the pharyngeals F2 should be a Helmholtz resonance, and F1 and F3, front-cavity resonances, and for the uvulars, F should be a Helmholtz resonance, F2 and F4, front-cavity resonances, and F3, a back-cavity resonance; (3) for the closed-glottis case the Helmholtz resonances for both classes of consonants should be widened, compared to a no-constriction-loss case, due to constriction losses; and (4) in the case of noise generation in the vicinity of a supraglottal constriction the front-cavity resonances should be strongly excited and the Helmholtz resonances may or may not be excited depending on the noise-source location.
Secondly, an acoustic analysis of five Arabic consonants (two pharyngeal /,h/ and three uvular
/,X,q/)
prevocalically with three vowels (/aa,ii,uu/) was carried out. Results of the analysis were in general agreement with the theoretical predictions. Spectral analysis reveals a compact spectral shape (narrow peaks in the mid-frequency region) for the voiceless uvular fricative /X/ and stop /q/, whereas the spectrum for the voiceless pharyngeal /h/ is characterized by broad peaks at high frequencies. Both a continuant and a non-continuant allophone were found for the voiced consonants. Durational measurements of the consonantal intervals for the voiced and voiceless con-sonants were similar for both classes, and the voiceless concon-sonants were longer than their voiced counterparts. Measurements of the fundamental frequency (fO) for the voiced consonants /,/ show a lower f0 than the adjacent vowels; this is attributed to the constricted pharynx in the former case, and to the acoustic and aerodynamic effects of introducing a narrow supraglottal constriction in the latter. Results of the analysis also show that, for each consonant, the F1 target' is influenced by the height of the following vowel, whereas the F2 and F3 targets" are influenced by the backness and rounding of the following vowel.Thirdly, we investigate the perceptual cues for place of articulation for the voiced consonants /f/ and /s/ through perceptual experiments, using synthetic /Caa/ stimuli. Results show that the onset value of F1 (Flo) is essential in discriminating between the two consonants, while F2 position and bandwidth are not. An Flo equal to or greater than the F1 in the steady state of the vowel (Fl.) results in the perception of the pharyngeal //. When Fl. is at least 130 Hz less than Fl., the uvular //
is perceived. Other values of Flo result in the perception of the glottal stop //. Widening F1 bandwidth increases the uvular responses and improves the naturalness of the uvular stimuli, whereas it decreases substantially the pharyngeal responses. The increased bandwidth was predicted from the theoretical study.
Based on the results of the theo^ etical, acoustical, and perceptual studies we propose a set of binary features describing the two classes of consonants.
Thesis Supervisor: Kenneth N. Stevens
To my father and my mother
ACKNOWLEDGMENTS
My deepest gratitude goes to Professor Kenneth Stevens for his constant encour-agement, critical comments and patience. During the two years that I have known Ken, he has been a true mentor and a valuable teacher to me.
Many thanks to all members of the Speech Communication Group for providing a stimulating and friendly atmosphere. I am deeply grateful to Corine Bickley for proofreading this thesis and for her support all along.
Special thanks to Maria-Gabriella Di Benedetto for her help in putting this thesis together and for her friendship, which has meant a great deal to me.
I thank all the subjects who participated as speakers and/or listeners (JM, HA, LT, MU, MA, BA, MR, MAL, and AM) for being so patient.
I would also like to thank my friends and relatives here and abroad who never failed to encourage me throughout my studies through their letters, 'long-distance" phone calls, and care.
Finally, I want 'to thank my parents, sister, and brother; their faith and love has made this thesis possible.
This research was supported in part by an NSF grant.
Contents
Abstract
Dedication
Acknowledgments
1 Introduction 1.1 Problem Statement . . . . 1.2 Literature Survey . . . .. 1.2.1 Articulatory Mechanisms . . . . 1.2.2 Acoustics: Theoretical Modelling and Analysis 1.2.3' Perception . ... ...1.2.4 Phonological Considerations . . . .
1.3 Thesis Outline ...
2 Theoretical Considerations
2.1 Idealized Models: Dimensions.2.2 Idealized Models: Formant Frequencies. . . 2.2.1 Results and Discussion ...
2.3 Noise Source at a Supraglottal Constriction 2.3.1 Results and Discussion .
2.4 Losses in the Vocal Tract ... 2.4.1 Method . . . .
2.4.2 Results and Discussion ... 2.5 Summary and Discussion ...
3 Acoustic Analysis: Methods and Results
3.1 Speakers...
2 4 5 13 13 14 14 20 23 23 26 27 27 31 31 38 39 44 44 46 50 52 52 I C -. -. . . . . . . . . . . . . . . . . . . . . . . . . . . ....
...
...
...
...
...
...
...
...
3.2 Corpus and Recording Method ... 3.3 Time-Domain Analysis: Duration ...
3.3.1 Results and Discussion ...
3.4 Frequency-Domain Analysis . . . . 3.4.1 M ethod . . . .
3.4.2 Fundamental Frequency Measurements of /q/ and // . . . . .
3.4.3 Spectral Analysis . . . .
3.4.4 Helmholtz Resonance Bandwidth for // and // ... 3.5 Summary ...
4 Perceptual Experiments
4.1 Stimuli ... 4.2 Subjects ... 4.3 Procedure ... 4.4 Experiment I ...4.4.1 Procedure...
4.4.2 Results and Discussion .
4.5 Experiment II . . . .
4.5.1 Procedure...
4.5.2 Results and Discussion . 4.6 Summary ...
5 Conclusion
5.1 Summary and Discussion . . . 5.2 Future Work ...
A Tables and Figures
Bibliography
100
. . . 100 . . . 101 ... . . . 1 0 2 ... . . . 1 0 6 ... . . . 1 0 6 ... . . . 109 ... . . . 1 1 6 ... . . . 116 ... . . . 1 1 6 .. . . . 121 122 ... . . . 1 2 2 ... . . . 1 2 7 128 135 7 53 53 55 62 62 62 69 93 98I
List of Figures
1.1 X-ray tracings of prevocalic pharyngeals and uvulars. After Al-Ani
(1970) .. 17
1.2 X-ray tracings of prevocalic pharyngeals and uvulars. After Delattre
(1971) ... .. 18
1.3 X-ray tracings of prevocalic pharyngeals and uvulars. After Ghazeli
(1977) ... 19
1.4 a) Idealized model of the vocal-tract area function with a narrow con-striction in the pharynx. b) Plot of the four lowest natural frequencies as a function of the length of the back cavity and the cross-sectional area of the constriction. After Klatt and Stevens (1969). . ... . 22
2.1 a) Idealized model of a constricted vocal tract. b) Parameters chosen for the pharyngeal and the uvular configurations . ... 29 2.2 Idealized models for the pharyngeals and the uvulars ... 30 2.3 Idealized models for the pharyngeals and the uvulars with tapering. . . 36 2.4 Network model of a constricted vocal tract in the presence of a noise
source at the vicinity of a supraglottal constriction ... 41 2.5 Plots of the first three zeros of Uo/p, superimposed on the first four
formant frequencies for the pharyngeal model. ... ... 42 2.6 Plots of the first three zeros of Uo/p, superimposed on the first four
formant frequencies for the uvular model. ... 43 2.7 Two models of the vocal tract used for calculating the bandwidth
con-tribution of the constriction resistance to the formant-frequency
band-widths . . . ... ... . ... . 48
3.1 Examples of displays used in determining the consonantal boundaries for the voiceless consonants in VCV utterances. ... 57 3.2 Examples of displays used in determining the consonantal boundaries
for the voiced consonants in VCV utterances. ... ... 58 3.3 Three different realizations of the voiceless uvular stop /q/ . ... 60
3.4 a) Weak noise preceding the stop closure for /q/. b) Irregular bursts
during the consonantal interval of
//.
... 61 3.5 a) Fundamental frequency contour for the utterance /aaaa/. b) Timewaveform. c) Two 70 msec. sections of the waveform. ... 66 3.6 a) Fundamental frequency contour for the utterance /aazaa/. b) Time
waveform. c) Two 70 msec. sections of the waveform. ... 67 3.7 Spectrogram of the utterance /aa/, the arrow indicates the time where
the spectrum of /X/ was sampled. ... .. 72 3.8 DFT and LPC spectra, sampled at the midpoint of the steady-state
portion of the vowel /aa/. ... 73
3.9 Vowel diagram. ... 75
3.10 Formant trajectories of the five consonants in different contexts ... 77 3.11 a), b), and c) Are three realizations of the voiced pharyngeal //. d)
The only token of // where there was evidence of noise. ... 79 3.12 Critical-band spectra sampled during the consonantal intervals of a)
/Xaa/ and b) /haa/ ... 86 3.13 Critical-band spectra sampled during the consonantal intervals of a)
/xii/ and b) /hii/ ... 87 3.14 Critical-band spectra sampled during the consonantal intervals of a)
/Xuu/ and b) /huu/ . 88
3.15 Critical-band spectra sampled at the burst of the voiceless uvular stop
/q/ in /qaa/ utterances ...
89
3.16 Critical-band spectra sampled at the burst of the voiceless uvular stop /q/ in a) /qii/ b) /quu/ utterances. ... 90
4.1 A block diagram of the Klatt cascade/parallel formant synthesizer. After
Klatt, D.H. (1980) ... 103
4.2 Contours of the amplitude of voicing and the fundamental frequency
used for all stimuli ... 104
4.3 Plots of the first five formant frequencies as functions of time for the two "standard" stimuli (pharyngeal and uvular). ... 105 4.4 Schematized spectrograms of F1 and F2 for the F1 continua of types I
and II. . . . ... ... ... 107
4.5 Schematized spectrograms of F1 and F2 for the F2 continua of types I
and IH ... 108
4.6 Plots of percentage identification versus stimulus number for the F1
continuum of type I. 111
4.7 Plots of percentage identification versus stimulus number for the F1
4.8 Plots of the average percentage identification versus stimulus number for the F1 continua of types I and II ... 113 4.9 Plots of the average percentage identification versus stimulus number for
the F2 continuum of types I and II. ... 115 4.10 Schematic plot of the bandwidth of F2 for type I, and of F1 for type II
as a function of time . . . .... 118
4.11 Plots of percentage identification versus stimulus number for the F1
continuum of type II with an increased F1 bandwidth (Experiment II).. 119 4.12 Plots of the average percentage identification versus stimulus number for
the F1 continuum of type II with an increased F1 bandwidth ... 120 A.1 Plots of percentage identification versus stimulus number for the F2
continuum of type I. ... ... 133
A.2 Plots of percentage identification versus stimulus number for the F2 continuum of type II. ... 134
List of Tables
1.1 A description of the Arabic consonants by binary features. After
Jakob-son (1957) ... 25
2.1 First four formant frequencies (Hz) of the idealized pharyngeal and
uvu-lar models . . . 35
2.2 First four formant frequencies (Hz) of the tapered pharyngeal and uvular
models...
37
2.3 Bandwidth contributions of the constriction (Be), and the contributions of the other losses (B,,h,) to the bandwidths the first four formant fre-quencies (Hz) for the pharyngeal and uvular models ... 49
3.1 Results of the durational measurements for the five consonants ... 59 3.2 Results of AfO measurements for the voiced consonants /,j/ ... 68 3.3 Values of F1, F2, and F3 for /aa/, /ii/, and /uu/ for each speaker
individually
.... ... 74
3.4 Average values of Fl, F2, and F3 for the three vowels... 75 3.5 Average values of the first three formants at the onsets of the vowels
preceding one of the five consonants. 76
3.6 Values of F1, F2, and F3 measured at the onset of the voiced consonants
// and //.
...
80
3.7 Values of F1 and its normalized amplitude in dB for the voiceless
con-sonant /h/ ...
84
3.8 Values of F2 and F3 and their normalized amplitudes in dB for the voiceless consonants /h/ and /X/ ... 85 3.9 Targets of the first three formants for the pharyngeals and uvulars.... 92 3.10 AA0, AA1, and AAO in dB for both // and //.. ... 97
5.1 A suggested feature matrix for the pharyngeals and the uvulars. .... 126
vowels preceding one of the five consonants (speaker JM). ... 129 A.2 Average values of the first three formants measured at the onsets of the
vowels preceding one of the five consonants (speaker MU) ... 130 A.3 Average values of the first three formants measured at the onsets of the
vowels preceding one of the five consonants (speaker HA) ... 131 A.4 Average values of the first three formants measured at the onsets of the
Chapter 1
Introduction
1.1 Problem Statement
Consonants and vowels comprise the two major classes of speech sounds. While vowels are produced with a relatively unconstricted vocal tract, consonants are pro-duced with a constriction at some point along the vocal tract. For most classes of consonants, the constriction is narrow enough to cause complete stoppage of the air or to produce a turbulent noise source (Jakobson, Fant and Halle, 1963). The acoustic properties of consonants depend mainly on the location and the cross sectional area of the constriction. The location of the constriction, which defines the place of articulation of consonants, could be anywhere between the glottis and the lips.
In English, the place of articulation of consonants ranges between the ' velar ' and the ' bilabial ' places corresponding to constriction locations in the oral cavity between the velum and the lips. Consonants produced with a constriction in the pharyngeal and the uvular regions between the velum and the glottis are found in some other languages.
There are known to be two pharyngeal consonants // and /h/ (voiced and voiceless, respectively) and three uvular consonants //,/X/ and /q/ (voiced, voiceless fricative, and voiceless stop, respectively). All five of these consonants are found in Arabic.' For
'From an inventory of 317 languages examined by Maddieson (1984), the voiced pharyngeal consonant is found in 9 languages,the voiceless in 13; the voiced uvular is found in 13 languages, the voiceless fricative in 29, and the voiceless uvular stop is found in 38 languages.
-this reason previous researchers have focused attention on the Arabic language in order to study the properties of pharyngeal and uvular consonants; this thesis will further examine the pharyngeal and uvular consonants of Arabic.
Studying the relations between the production mechanisms and the acoustic prop-erties of the speech waveforms of these consonants would help in developing a more detailed quantitative acoustic theory of speech production. W. Meyer-Eppler (1953), G. Fant (1960), J. M. Heinz and K.N. Stevens (1961) , and C. Shadle (1985) have the-oretically formulated these relations for fricative consonants in English, Swedish, and German. Although the resulting theoretical models were based upon simplified assump-tions regarding the production mechanisms involved, they were essential in clarifying which parameters (e.g., length of the front cavity, constriction location, etc. .. ) are significant acoustically. However, none of the consonants analyzed was onc with a constriction in the pharyngeal region. Similarly, at the perceptual level, no study has examined the perceptual correlates of uvular and pharyngeal consonants. Hence, it would be of interest to develop a theoretical model that would help us in understand-ing the mechanisms involved in producunderstand-ing these sounds and the parameters which are significant acoustically and perceptually.
The following is a summary of previous studies that dealt with the production, acoustics, perception and the phonology of pharyngeal and uvular consonants.
1.2 Literature Survey
1.2.1
Articulatory Mechanisms
Several researchers have examined X-ray films to determine the location and shape of the various articulators in the vocal tract during the production of pharyngeal and uvular consonants:
* Figure 1.1 (Al-Ani, 1970) shows tracings of X-ray films of a speaker (Iraqi) pro-ducing the pharyngeal consonants // and /h/ preceding the vowels /a/, /i/ and /u/. These tracings do not show the position of the tongue root, and hence it is
difficult to conclude whether or not the two consonants are produced with a sim-ilar constriction location. Further investigations by Al-Ani (1985) indicate that the place of articulation for the voiceless pharyngeal /h/ is higher in the pharynx than that of //. Similarly, he claims that the the three uvular consonants //, /X/ and /q/ differ in place of articulation with /q/ being the furthest back and /X/, the furthest front.
* Figure 1.2 (Delattre, 1971) shows tracings of X-ray films illustrating a profile view of a speaker (Lebanese) producing pharyngeal and uvular consonants in initial position before /a/,/i/ and /u/. The frame on the left of each row shows the moment of maximal constriction; on the right of each row are sketches of the articulatory configurations of the following vowels. From these X-rays, Delattre concluded that the constriction location during the production of the voiceless pharyngeal /h/ is further back than that of the voiced pharyngeal //. The uvular consonants /,X,q/ seem to share the same place of articulation, differing only in the degree of constriction. The consonant /X/ is produced with a more constricted tract than //, and /q/ is produced with the most constricted. These findings, with regard to relative place of articulation within each group of sounds, are different from those of Al-Ani.
* X-ray tracings by Ghazeli (1977), in Figure 1.3a (North African speaker), show that the place of articulation of the two pharyngeal consonants /,h/ is similar. The center of the main constriction is approximately 3.5 cm from the glottis, at the level of the epiglottis. However, the constriction between the epiglottis and the back wall of the pharynx was observed to be narrower for /h/ than for // (3 mm vs. 4 mm), and was sustained 20-30 rrsec longer than for //. The larynx was raised approximately 9 mm from rest position (7 mm from its position during speech) in both cases. Another narrowing of the vocal tract occurred 6 cm from the lips. This narrowing was formed by the portion of the tongue between the blade and the dorsum, and was of width 8 mm (from the hard palate). Uvular consonants (Figure 1.3b) were produced with different constriction locations in the uvular region: for // the location was midway between /q/ (the furthest
back) and /X/. A wider (4-5 mm) secondary constriction occurred at the level of the epiglottis. No larynx movements were observed for //, whereas the larynx was raised 2 mm and 2.5 mm from rest position during the production of /X/ and /q/, respectively.
Ghazeli also measured the air-flow rate for the voiceless fricatives /h/ and /X/. He found that the average flow rate was 44 liters/min (733 cc/sec) and 29 liters/min (483 cc/sec) for /h/ and /X/, respectively. He attributed the increase in the flow rate for the voiceless pharyngeal to a wider constriction and/or an increase in respiratory effort during the production of /h/.
In summary, these researchers seem to agree that the place of articulation is in the laryngopharynx region at the level of the epiglottis for the pharyngeal consonants, and is at the level of the uvula for uvular consonants. The constriction in the former case is formed by backing the tongue root toward the back wall of the pharynx, and in the latter by backing the tongue dorsum toward the uvula. However, there seems to be a disagreement as to whether or not the two pharyngeal consonants /,h/ or the three uvular consonants /,X,q/ are produced with a similar constriction location. Dialectal differences might account for this disagreement, because the speakers in each case were from a different country.2
2
Ghazeli (1977) claims that pharyngeal consonants are produced in an identical manner in all dialects; Al-Ani (1985), on the other hand, believes that //, in particular, is produced differently in various regions.
Figure 1.1: Tracings of X-ray films of the pharyngeal consonants // (solid line) and /h/ preceding the vowels /a/, /i/, and /u/, respectively (Al-Ani, 1970).
__ II I - '
I~~~~~~~~~~~
I
I ~ ~ ~ / I~~l II~~~~~~~~ I I~9
II
q
U
Figure 1.2: Tracings of frames taken from X-ray films showing a profile view of a speaker during the production of pharyngeal and uvular consonants in initial position before
/a/,/i/, and /u/. The frame on the left of each row shows the moment of maximal constriction; on the right of each row are sketches of the articulatory configurations of the following vowels (Delattre, 1971).
___ -__ _ _ i U a a~~-11 I--,'
a)
b)
c)
Figure 1.3: Vocal-tract shape during the articulation of a) // (dotted line) and /h/, b) // (dotted line) and /X/, and c) /q/. The consonants are imbedded in the word /Caeli/, where C represents one of the five consonants /f,h,K,x,q/ (Ghazeli, 1977).
1.2.2
Acoustics: Theoretical Modelling and Analysis
Klatt and Stevens (1969), introduced a theoretical model of the vocal-tract area function during the production of pharyngeal and uvular consonants. An idealized model (Figure 1.4a) was used to examine the acoustic effect of creating a narrow con-striction at a point along the pharyngeal tract. The length of the back cavity (d) during the production of these consonants is within the range 3-7 cm. A length of d=3-4 cm is appropriate for the production of the consonants with the more posterior constriction position (pharyngeal /,h/), while a length of d=7 cm is appropriate for the consonants with the more anterior constriction position (uvular /,X, q/).
Klatt and Stevens calculated the four lowest natural frequencies of the model as a function of d (length of the back cavity) and the cross-sectional area of the constric-tion (Figure 1.4b). Spectrograms of natural utterances spoken by a native speaker of Lebanese verified the predictions derived from the model (Figure 1.4a) regarding formant-cavity affiliation: F3 is a front-cavity resonance in the case of pharyngeal con-sonants, and F2 and F4 are front-cavity resonances in the case of uvular consonants. This was clear in the spectrograms of the voiceless fricatives /h,x/, where noise strongly excited the formants that are front-cavity resonances. An explanation of excitation of formants by noise generated at a constriction, will be presented in Chapter 2. The discussion will be based on an acoustic model of the vocal tract during the production of consonants that are produced with a noise source at the constriction.
The important acoustic correlate attributed to pharyngeal consonants is a high F1; the F1 position during the articulation of pharyngeal consonants is the highest among all sounds in Arabic including the vowel /a/ (Klatt and Stevens, 1969; Ghazeli, 1977). Acoustic analyses by several researchers of the voiced pharyngeal consonant // has led to the conclusion that the most likely realizations of this consonant are as stops (Al-Ani, 1970) and approximants (Catford, 1968; Adamson, 1981). The acoustic analysis by Klatt and Stevens showed no evidence of noise in the spectrograms of //, suggest-ing that this consonant could be categorized as a sonorant rather than as a fricative. Evidence of lower fundamental frequency than that of the vowels, laryngealization, and creakiness during the production of // was noted by Ghazeli (1977). This has led to
-his agreement with Ladefoged's (1975) suggestion that some intralaryngeal adjustments might occur during the production of pharyngeal consonants. In summary, // has sev-eral allophonic realizations due to its complex production mechanisms. This fact has led to an unresolved problem of categorization of //.
Spectrographic analysis of the voiced uvular consonant // (Klatt and Stevens, 1969; Ghazeli, 1977) showed that this consonant is characterized by a clear formant structure. Evidence of weak noise excitation was observed by Al-Ani (1970); the noise excited F3 and higher formant frequencies. These observations sggest that two al-lophonic realizations are commonly found for //: a sonorant allophone and a weak-fricative allophone. In addition, Ghazeli noted that in Cairo Arabic, // and /X/ are produced with a velar rather than a uvular place of articulation, and Al-Ani noted that in Iraqi Arabic these two consonants (/X/ with the vowel /i/ only) are produced with a velar place of articulation. The analyses of the voiceless consonants /h,x/ have shown that these consonants have the acoustic attributes of fricatives, and no different allophonic realizations are found.
1cm2
GLOTTIS,
r
3cm- - -I
I-1 cm0)
2 4 6 8 10
DISTANCE (d) FROM GLOTTISTO CONSTRICTION (cm)
Figure 1.4: a) Idealized model of the vocal-tract area function with a narrow constric-tion at a point along the pharyngeal tract (the glottis is at the left end) . b) Plot of the four lowest natural frequencies as a function of d (length of the back cavity) and the cross-sectional area of the constriction (the dashed line corresponds to a constriction area of 0.1 cm2) (Klatt and Stevens, 1969).
U W 04 W. - -__ _ _ LI - I
--1.2.3 Perception
To the knowledge of the author, no study has been done to examine the perceptual correlates of pharyngeal and uvular consonants. Delattre (1971) claimed that formant transitions (into and out of the consonant) provide the important perceptual cue for the uvular fricatives /i/ and /X/. His claim was based on informal perceptual experiments done with synthetic stimuli. However, neither information about the synthetic stimuli and the procedures with which the experiments were carried out, nor quantitative results were reported.
The only systematic perceptual study of some Arabic consonants was done by Obrecht (1968), using synthetic stimuli. The results of his experiments show that the second formant transition is essential in discriminating velarized from non-velarized consonants in Arabic: the locus' of F2 for the velarized consonants is lower than that of their non-velarized counterparts.3 Because pharyngeal and uvular consonants are not considered to be the velarized counterparts of other consonants, they were not included in his study.
1.2.4 Phonological Considerations
The earliest descriptions of the Arabic phonological system were given by Sib-awayhi in his book al-Kitab (750/1975), and later by Avicenna in Makharij al-Huruf (1333/1916). Both described the pharyngeals /,h/ as sharing a similar place of artic-ulation in the lower pharynx. The voiceless pharyngeal was described as a fricative, whereas the voiced pharyngeal was described by both as being a frequentative.4
The two consonants /,X/ were described as being a voiced fricative and a voiceless fricative, respectively, with a similar place of articulation in the upper pharynx. The consonant /q/ was described as a voiced stop with a place of articulation further front than /,X/. Sibawayhi then distinguished two classes of consonants according to their
SObrecht defines velarized consonants as those with a secondary place of articulation in the pharynx (pharyngealization). The minimal pairs chosen for his experiments were: (b,b), (d.d), (t,t), (z,z), (s,s), (m,m), (n,n), (1,1) and (r,r). The synthetic stimuli used were CV syllables.
4Sibawayhi defines // as being intermediate between a fricative and a stop, being a frequentative because of its similarity to /h/" (Vol. 4, p. 435).
place of articulation. The consonants /,h,,h,,X / were called consonants of the
pharynx" and all other consonants were called "consonants of the mouth".
Jakobson (1957) agreed with the general phonological description given by the early Arab grammarians. He described the Arabic consonants, as pronounced in Palestinian Arabic, by binary features (Table 1.1). Both pharyngeals /,h/ were called glides (non-consonantal, non-vocalic) with the fortis/lenis feature being distinctive between the two. The pharyngeals were deprived of the features grave/acute and compact/diffuwe as these features are generated in the mouth cavity" (p. 114). The consonants
/,X/
were described as uvular continuants and the voiceless stop /q/ was described as a voiceless pharyngealized velar. The feature attributed to all five consonants, and pharyngealized consonants, by Jakobson was the flat feature. In this case, flat indicates that a primary or secondary articulation takes place in the pharynx region during the production of the consonants.In a more general linguistic framework, Chomsky and Halle (1968) described the two classes of sounds, pharyngeal and uvular, in terms of distinctive features as (-anterior,
-coronal, -high, +back) with the low feature distinguishing the two classes;
pharyn-geals have the feature (+low) and uvulars, (-lowt). In their framework, the features
low and back reflect the compactness and gravity of these sounds, respectively. Hence,
this classification is in disagreement with Jakobson's (1957), in which the pharyngeals and uvulars were deprived of the feature grave, the pharyngeals were also deprived of the feature compact, and the uvulars had the feature compact.
Other phoneticians and linguists have agreed on characterizing /h,E,X/ as fricatives, and /q/ as a voiceless stop, in most dialects. The description of the manner of artic-ulation for the voiced pharyngeal // is still not clear, mainly because of its different allophonic realizations (see Section 1.2.2).
It is hoped that this study will clarify the categorization of these sounds in terms of their distinctive features.
vocalic vs. non-voc. cons. vs. non-cons. flat vs. plain nasal vs. oral compact vs. diffuse grave vs. acute fortis vs. lenis continuant vs. abrupt strident vs. mellow c h h d t - - -
-000
0
-0000
-00
00
-
-000 t 6 6 a z S s b f (g) k r x x n m m r I4
-44---+
+
+
4
-
--
+++4+4+44
+-+- -+ + - - -- + - - +- -+ 00 - + 0 0 0 0 0 - + + +4- + 0 0 0 0 0 0 0 0 + ++ 0 0 0 0 0 0 0 - + +C 000 - + + -- -+ + +- + - + 0 0 0 0 0 0 0 0 - + + + + 000 0 - -0 + 000-++0 0 - -- 4+-000 - - + 0 0 0 0 0 0 0 00 0 0000Table 1.1: A description of the Arabic consonants by binary features (Jakobson, 1957).
1.3 Thesis Outline
The literature survey indicates a lack of good understanding of the production mechanisms and of the acoustic and perceptual properties specific for pharyngeal and uvular consonants. Consequently, the phonetic categorization of these consonants is yet to be clarified.
In the course of this thesis, we will investigate properties of pharyngeal and uvular consonants from three points of view: theoretical study (Chapter 2), acoustic analysis (Chapter 3), and perceptual experiments (Chapter 4).
In Chapter 2, we introduce theoretical models of the vocal-tract area function during the production of pharyngeal and uvular consonants. The dimensions of these models are based on anatomical and physiological data and constraints. From these models we calculate the formant frequencies and their bandwidths for both the voiced and the voiceless consonants. We also study the acoustic effects of introducing a noise source in the vicinity of a supraglottal constriction.
In Chapter 3, we discuss the validity of the theoretical predictions arrived at in Chapter 2 through acoustic analysis of prevocalic pharyngeal and uvular consonants in Arabic. We choose analysis techniques appropriate for each consonant and quantify our findings. The analysis is in the time domain (duration) and in the frequency do-main (fundamental frequency, formant trajectories, formant bandwidths, and spectral shape).
In Chapter 4, we aim to find the relevant perceptual cues for identifying the place of articulation of pharyngeal and uvular consonants. Perceptual experiments are carried out using synthetic /Caa/ stimuli, where /C/ is one of the two voiced consonants: pharyngeal // or uvular /i/.
Finally, in Chapter 5 we summarize the results of Chapters 2, 3, and 4 and attempt to describe these consonants in terms of their distinctive features. Suggestions for future work will conclude this thesis.
Chapter 2
Theoretical Considerations
In this chapter we will develop theoretical models of the vocal tract during the production of pharyngeal and uvular consonants. From these models we will calculate the formant frequencies for each configuration, determine the formant-cavity affiliation, and examine the acoustic effects when a noise source is present at the constriction. We will also calculate the contribution of the different losses in the vocal tract to the bandwidths of the calculated formant frequencies.
2.1 Idealized Models: Dimensions
An accurate model of the vocal tract during the production of any sound requires knowledge of the area function at each point along the tract. Due to the lack of reliable X-ray data describing the vocal tract during the production of pharyngeal and uvular consonants we will develop idealized models of the tract during the production of these consonants, taking into consideration certain anatomical and physiological data and constraints.
A simplified model the vocal-tract area function in the presence of a supraglottal constriction is shown in Figure 2.1a. The figure shows the vocal tract divided by the constriction into a back and a front cavity. In choosing the dimensions appropriate for the production of the pharyngeals and the uvulars, the following were considered:
show that the position of the larynx is 7 mm higher for pharyngeal consonants than it is for uvulars. Thus, if we assume a vocal-tract length of 17 cm, appro-priate for a male's tract, for the uvulars, then according to Ghazeli's data, the length of the tract for the pharyngeals should be 16.3 cm.
* b, 4I, (lengths of the back cavity, constriction, and the front cavity): Ghazeli's data also show that the location of the constriction is at the level of the epiglottis in the case of pharyngeal consonants (3 - 3.5 cm above the glottis), and at the level of the uvula (8 cm above the glottis) for uvular consonants. Hence, lb was chosen to be 3 cm and 8 cm for the pharyngeals and the uvulars, respectively. We do not have accurate data on the length of the constriction (,); so we will leave this parameter as a variable with two values: 1 and 2 cm. After choosing 1,
4,
andl
then the length of the front cavity (II) would simply be = I-4
- I,. * Ab, Aj (Cross-sectional areas of the back and the front cavities): The choice ofAs and A1 was done in an ad-hoc manner; the area of the back cavity for the
pharyngeal was chosen to be 1 cm2 (similar to that used by Fant (1960) for the idealized model of the vowel /a/). If we consider the total volume of the vocal tract to be approximately 65 cm3,' then the area of the front cavity would be approximately 5 cm2. For the uvulars, the area of the front cavity was chosen to
be the same as that for the pharyngeals (5 cm2), and the area of the back cavity
to be 2 cm2.
A (Cross-sectional area of the constriction): The cross-sectional area of the
con-striction was assumed to be in the range of 0.15 to 0.25 cm2. The upper limit on
the area function (0.25 cm2) is less than the minimum cross-sectional area of the constriction for vowels which was measured by Fant (1960) to be 0.3 cm2.
The dimensions chosen for the models are summarized in Figure 2.1b, and the resulting models are shown in Figures 2.2a and 2.2b.
'The volume of a male's vocal tract was estimated by Stevens (in press) to be, on average, between 60
1b
1c-.
1 _ I - _ Pharyngeal Uvular 1 16.3 17 cm 16 3 8 cm 1c 1, 2 1, 2 cm 1i 13.3-1, 9-1, cm A, 1 2 cm2 A, .15, .2, .25 .15, .2, .25 cm 2 A! 5 5 cm2b)
Figure 2.1: a) Idealized model of the vocal-tract area function in the presence of a supra-glottal constriction. The glottis is at the left end of the model. b) Parameters chosen for the pharyngeal and the uvular configurations. The subscripts b,c,f refer to the back cavity, constriction, and front cavity, respectively (see text for details).
-~~ -
-L
tcm
2 r~--
s--3
-
I:
----13.3
- lcMODEL
I
a)
2 cm2 5 cm2 8 - 9 C-1cMODEL
II
b)
Figure 2.2: (model II).Idealized models for a) the pharyngeals (model I), and b) the uvulars 5 cm2 cm cm r "'II ...1111111IIII
-2.2 Idealized Models: Formant Frequencies
Formant frequencies were calculated from the area functions specified in models I, II (Figures 2.2a, 2.2b) using a program (TBFDA1) developed originally by Henke (1966) and modified by Hosein (1983). The program calculates the magnitude and the phase of the transfer function for an arbitrary shape and length of the vocal tract by considering the vocal tract to be a concatenation of arbitrary-length tubes, each having a fixed cross-sectional area. A formant frequency is determined when the phase of the transfer function changes from being greater than r (n+l)/2 to being less than that value. Formant frequencies were calculated taking into consideration the effects of the wall impedance (Rm,,,=0l60 gcm-2sec- , M,,,,,h=1.5 gcm-2), and assuming the lip impedance to be approximately that of a piston in a sphere.
The first four formant frequencies of the models were calculated for two cases: (1) an infinite glottal impedance (voiced), and (2) an open glottis with a cross-sectional area (A,) of 0.1 cm2 (voiceless).
2.2.1 Results and Discussion
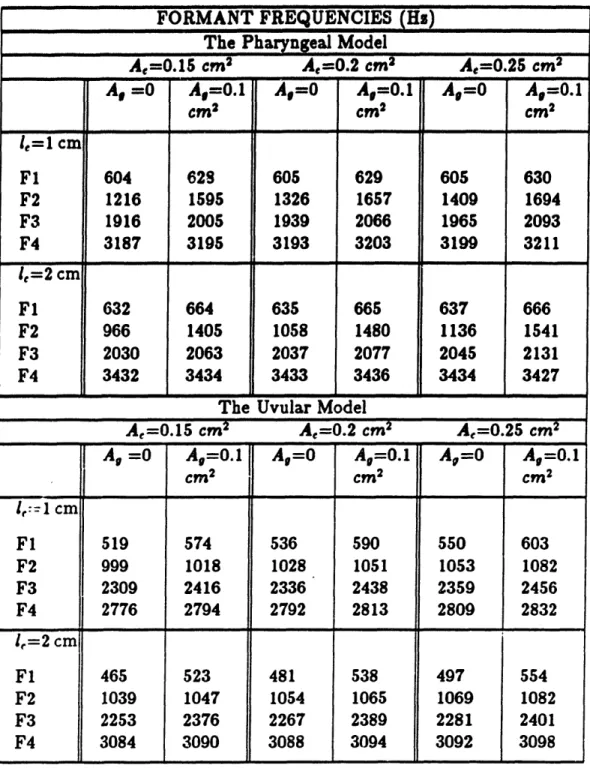
Table 2.1 shows the calculated formant frequencies for the idealized models as func-tions of the length and the cross-sectional area of the constriction (, Ae) for both the closed- and the open-glottis cases. For the pharyngeal model, F1, F3, and F4 are the first three front-cavity resonances, and F2 is a Helmholtz resonance. For the uvular model, F. is a Helmholtz resonance, F2 and F4 are the first two front-cavity resonances, and F3 is the first resonance of the back cavity.
From the calculated values the following were observed:
* F1 and F4 for the pharyngeal model are higher than those for the uvular, and F3 is lower. This result is similar to that shown by Klatt and Stevens (1969). F2 for the pharyngeal is higher than that for the uvular for all the cases considered except when is 2 cm and the glottis is closed (A. is 0); in that case F2 values for the two models are approximately the same.
*The front-cavity resonances (Fl, F3, and F4 for the pharyngeal model, and F2 and F4 for the uvular) are increased when either /c or A, increases. To understand why these effects occur, let us consider the front cavity to be a uniform tube open at one end (at the lips). The resonances of such a tube are:
fn~+
=c(2n + 1)
= 4 (2.1)
4 lcI
Where
n= 0,1,2,...
c= velocity of sound in air
lel,= effective length of the front cavity (taking into account the
end correction ;ntroduced by the radiation impedance)
We notice from Eq. 2.1 that the front-cavity resonances vary inversely with 11,1f; from the results we see that when /c increases (and consequently If,1f decreases)
these resonances are shifted upward.
For our models, the cross-sectional area of the constriction is not zero and there-fore the front-cavity resonances will not be exactly the quarter-wavelength reso-nances shown in Eq. 2.1. The effect of the constriction is to introduce coupling between the front cavity and the rest of the vocal tract, and therefore shift the resonances upward, due to the acoustic mass of the constriction. The degree of coupling is related to the ratio of the cross-sectional area of the constriction to that of the front cavity (Ae/AI), and this ratio determines the amount by which each frequency is shifted. This clarifies the reason for the increase in the front-cavity resonances when Ae is increased (keeping Af fixed).
* An increase in A, or a decrease in /4 causes the Helmholtz resonance (F2 for the pharyngeal model and F1 for the uvular) to increase. This result is rather intuitive since the Helmholtz resonance could be approximated by:
fh-C Ae (2.2)
Where
A,= cross-sectional area of the constriction I,= length of the constriction
V= volume of the back cavity
From this equation we notice that an increase in A, or a decrease in
4l
would shift the Helmholtz resonance upward.2* For both models, the calculated formant frequencies for the open-glottis case are higher than those for the closed-glottis, due to the reactive part of the glottal impedance. The shift is greatest for the Helmholtz resonance (30% in F2 for the pharyngeal, and 11% in F1 for the uvular).
Formant frequencies measured from natural utterances by Ghazeli (1977) and Al-Ani (1970) show that the voiced pharyngeal F1 is in the range 700-900 Hz, F2, 1250-1400 Hz, F3, 2200-2300 Hz, and for the voiceless pharyngeal F2 is 1700 Hz and F3, 2300 Hz. For the voiced uvular, F1 was measured to be 500-600 Hz, F2, 1200-1300 Hz, F3, 2300-2.600 Hz, and no formant frequencies were reported for the voiceless uvular. In order to obtain formant frequencies that match these data, we tapered the junctions between each cavity and the constriction (Figure 2.3). The tapering allows us to develop more realistic models of the vocal tract during the production of these consonants, since we are avoiding sharp discontinuities in the area function.
The formant frequencies were recalculated and the results are shown in Table 2.2. The same conclusions drawn from the uniform-tube models apply here, in terms of the relative values of the formant frequencies for both the pharyngeal and the uvular consonants, and the formant-cavity affiliation. From these results, we notice that the calculated frequencies are closely matched to the measured values for the voiced conso-nants, reported by Ghazeli and Al-Ani, when
4l
is 1 cm and A, 0.25 cm2 (A,=0). For the voiceless pharyngeal, the model gives a better match to the measured data whenA,=0.15
cm2, and =l cm (Ag=0.1 cm2).2Equation 2.2 is an approximation to the Helmholtz resonance since it does not take into account the
To be able to obtain formant frequencies from the models that match measurements from natural data is quite encouraging, because it suggests that these simplified models are reasonable models for the pharyngeal and uvular consonants.
Ghazeli's X-ray data, upon which the choice of the models' dimensions were partly based, were of the consonants preceding a low vowel. Hence, the models proposed in this section are appropriate for the production of the pharyngeal and the uvular consonants when adjacent to a low vowel (like the vowel /a/). When modeling these consonants adjacent to other vowels, such as /i/ and /u/, one should consider the perturbation effects that occur in anticipating the following vowel; for example rounding, as in the case of /u/, would lower the formant frequencies associated with the front cavity.
FORMANT FREQUENCIES (Hs) The Pharyngeal Model
A,-=0.15 cm2 A,=0.2 cm A,=0.25 cm2
Af
=0
A=0.1
A=0
A=0.l
A=0O
A=0.1
cm2 Cm2 cm2 ,1 cm F1 604 628 605 629 605 630 F2 1216 1595 1326 1657 1409 1694 F3 1916 2005 1939 2066 1965 2093 F4 3187 3195 3193 3203 3199 3211 /,=2 cm Fl 632 664 635 665 637 666 F2 966 1405 1058 1480 1136 1541 F3 2030 2063 2037 2077 2045 2131 F4 3432 3434 3433 3436 3434 3427
The Uvular Model
A,=0.15 cm2 A,=0.2 cm2 A,=0.25 cm2
A, =0 A,=0.1 A,=0 A,=0.1 Ao=O A, =0.1
cm2 cm2 cm2
/4:1 cm
Fl 519 574 536 590 550 603 F2 999 1018 1028 1051 1053 1082 F3 2309 2416 2336 2438 2359 2456 F4 2776 2794 2792 2813 2809 2832 1,=2 cm F1 465 523 481 538 497 554 F2 1039 1047 1054 1065 1069 1082 F3 2253 2376 2267 2389 2281 2401 F4 3084 3090 3088 3094 3092 3098Table 2.1: First four formant frequencies (Hz) of the idealized pharyngeal and uvular models (Figures 2.2a, 2.2b). The formant frequencies were calculated using the program TBFDA1 (see text for details).
5cm2
-
I-w
-2-
c
--
----
=
4
cmMODEL
I
a)
2 cm2 '1 5cm2_=--
J6
-.
-2
-
lc--
4
--
--
-
5
-
c--
cmMODEL
II
b)
Figure 2.3: Idealized models I and II (pharyngeal and the uvular) with tapering.
-! _ _ _ _
I
FORMANT FREQUENCIES (Hs) The Pharyngeal Model
Ae=0.15 cm2 A,=0.2 cm2 Ae=0.2 5 cm2
Af =0 A=0.1 A=O AA=0.1 Ag=0 A =0.1
cm2 cm2 cm2
I=1 cm
Fl 715 747 713 745 710 743 F2 1152 1785 1226 1802 1284 1813 F3 2263 2344 2264 2354 2267 2365 F4 3606 3623 3572 3608 3587 3597 1,=2 cm F1 749 801 748 798 745 796 F2 1015 1674 1078 1687 1131 1697 F3 2422 2473 2425 2475 2437 2481 F4 3784 3799 3744 3765 3711 3737The Uvular Model
A,=0.15 cm2 Ae=0.2 cm2
A,=0.25
cm2A, =0
A,=0.1
A==0
A=0.1
A=O
A=0.1
cm2 cm2 cm2 c=1 cm F1 483 553 499 568 513 582 F2 1232 1241 1238 1249 1243 1255 F3 2610 2737 2602 2725 2594 2713 F4 3415 3425 3395 3405 3379 3309 1,=2 cm F1 447 517 460 529 474 542 F2 1379 1385 1380 1385 1380 1386 F3 2573 2706 2559 2689 2546 2673 F4 3677 3683 3627 3635 3587 3596
Table 2.2: First four formant frequencies (Hz) of the tapered models (Figures 2.3a, 2.3b). The formant frequencies were calculated using the program TBFDA1 (see text for details).
2.3 Noise Source at a Supraglottal Constriction
In the case of noise generation in the vicinity of a supraglottal constriction, we could model the vocal tract by the network model shown in Figure 2.4. As shown in this figure, the noise source is modeled as a pressure source (p,) in series with the front and the back cavities, and the constriction itself is modeled as an acoustic mass and a kinetic resistance (Me, Re).3 The transfer function of the volume velocity at the lips
(Uo) to the pressure source (p,) at the constriction has the following form:
p.
=O
_K(s)nW=I
Ml-1((~ ~
- s')(s - ;)d
)('
; i, )
(2.3)Where K(s) is the transfer function value at frequencies near the origin, and s is the complex frequency, with a real and an imaginary part (a+jw). As shown in Eq. 2.3, the zeros (si) and the poles (i) of the transfer function occur in complex conjugate pairs. The zeros are those frequencies for which the impedance looking back from the pressure source (Zb) is infinite. The poles, on the other hand, are those frequencies for which the sum (Z/+Z+jwM,) is zero. Hence, we can rewrite Eq. 2.3 as:
UO K(s) poles of (Z) 2.4)
pe
zeros of (Z + Z! + jwtMe)
If wMe is much larger than the characteristic impedances of the front and back cavities, thenr the poles of Z will cancel (or nearly cancel depending on the source location and the value of wM,) from the numerator and the denominator in Eq. 2.4. The pole-zero cancellation of the back-cavity poles reduces the transfer function in Eq. 2.4 to:
p K(s) poles of ((2.5)
p.
-poles of (ZI)
The implication of the close proximity of the poles and zeros (which correspond to the back-cavity resonances) is that these poles (formant frequencies) will not be excited
SThe acoustic mass of the constriction (M,) is equal to pli/A¢, and the kinetic resistance (Re) is equal to
pUI/A2; I¢ and A, are the constriction length and cross-sectional area, respectively, p is the air density,
strongly by the pressure source.
As stated earlier, the pole-zero cancellation will occur if wMc is very large in com-parison with the characteristic impedance of the cavities. Hence, for a given pressure source location we would expect that the longer and and the narrower the constriction is, the more likely we will achieve the pole-zero cancellation.
In this section, we will calculate the zeros of Uo/p, for the untapered models I and II (corresponding to the pharyngeal and the uvular models, respectively). The calculations will be performed assuming the cross-sectional area of the constriction (A,) to be 0.15 cm2, and an open glottis with a cross-sectional area (A,) of 0.1 cm2. We will examine the effects of the pressure-source location, and the length of the constriction on the zero-frequency locations. The zeros of O1/p. were calculated using the program TBFDA1.
2.3.1 Results and Discussion
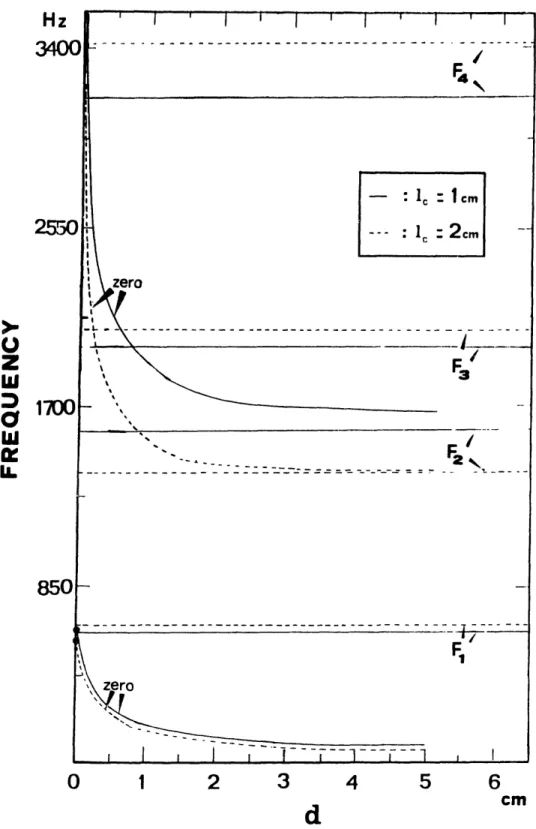
Figures 2.5 and 2.6 show plots of the zeros of Uo./p., as functions of the distance (d) between the pressure source and the constriction, and the length of the constriction
(l4), for the two models (I, II), respectively. In the figures the zeros are superimposed
with the formant frequencies of the models calculated in Section 2.2. Only zeros and poles below 3600 Hz are shown.
For the two models, the first zero is at low frequencies (below Fl). As the distance
(d) between the pressure source and the constriction increases, the second zero for
these models approaches the Helmholtz resonance (F2 for the pharyngeal and Fl for the uvular), and the third zero for the uvular approaches F3 (first resonance of the back cavity). As seen in the plots, the distance between the second zero and the Helmholtz resonance is rather sensitive to the pressure-source location; for source locations just beyond the constriction the pole-zero distance could be as high as 300 Hz. On the other hand, the third zero for the uvular is in the near vicinity of F3, suggesting that a pole-zero cancellation is likely to occur regardless of the source location.
The plots also show that for a given pressure-source location, the distance between the poles and the zeros decreases as the constriction becomes longer. This result verifies
what we predicted earlier, that is, as MC becomes larger (in this case by lengthening the constriction ()) less coupling occurs between the front and the back cavities, and hence the distance between the poles and the zeros becomes smaller.
From the pole and zero locations (Figures 2.5, 2.6), we can predict that when a noise source is present at a supraglottal constriction, then: (1) for the pharyngeal model F1, F3, and F4 should be excited by the source. The degree of F1 excitation is expected to be less than that of F3 and F4 since F1 amplitude will be influenced by the presence of the low-frequency zero, (2) for the uvular model F2 and F4 are expected to be excited by the noise source, while F3 should not be excited since a pole-zero cancellation at that frequency is likely to occur, regardless of the source location and the length of the constriction, and (3) depending on the noise-source location, the Helmholtz resonance for both models (F2 for the pharyngeal and F1 for the uvular) may or may not be excited by the noise source, since the pole-zero distance in that frequency range is highly sensitive to the source location.
Two of the factors that influence formant amplitudes are the pole-zero locations and the bandwidths of the formant frequencies. We have explored in this section the first issue by calculating the pole and zero frequency locations for the pharyngeal and uvular models. In the following section, we will address the second issue by determining the bandwidths of the formant frequencies for both models.
PR
--cb
U_
fo n
II
back
front
cavity
Zb
[]
cavity
Zf
Cavity between the pressure source (p,)and the constriction
Figure 2.4: Network model of a constricted vocal tract in the presence of a noise source (p,) at the vicinity of the constriction. Me, R are the acoustic mass and resistance of the constriction, U, U, are the volume velocity at the lips and the constriction, and Zf, Zb are the impedances seen by the pressure source of the front and the back cavities, respectively.
· ·I· -1 II
13
0
W U. Ix LL0
1
2
3
4
5
6
d
cm
Figure 2.5: Plots of the first three zeros of Uo/p, superimposed on the first four for-mant frequencies as a function of the distance between the pressure source and the constriction d Model I (pharyngeal).
U
Z
W W LL0
1
2
3
4
5
6
d
cm
Figure 2.6: Plots of the first three zeros of U/p, superimposed on the first four
for-mant frequencies as a function of the distance between the pressure source and the constriction d. Model II (uvular).
2.4 Losses in the Vocal T'act
Losses in the vocal tract arise from the resistive components of the impedances of the walls, radiation, glottis, and constriction, and from viscosity and heat conduction. In this section, we will calculate the contributions of the different losses to the bandwidths of the first four formant frequencies for the pharyngeal and uvular models. The program TBFDA1 calculates the bandwidth contributions of all losses except those due to the constriction. Hence, we will use this program to calculate the bandwidth contributions of all losses excluding the constriction, and we will derive expressions for calculating the constriction-losses contribution and perform these calculations separately. The purpose of these calculations is to gain an insight into the degree of damping of the pharyngeal and the uvular formant frequencies, and to determine which of the losses contribute the most to the formant bandwidths for both the closed- and open-glottis cases.
2.4.1 Method
At low frequencies we can model the vocal tract by the circuit shown in Figure 2.7a. In the circuit the volume velocity at the glottis (Ug) is modeled as a current source, the air behind the constriction by its compliance (C,), the wall impedance as an acoustic mass and resistance (M,, R1), and the constriction by its acoustic mass and kinetic resistance (M,, R,).
The circuit elements are represented by the following expressions:
Vb PC2
R
RmechM
MmeihR =
A,, M = ,
A, =C A, Where --p= air density
c= velocity of sound in air
V= volume of air in the back cavity
R,,,mech= mechanical resistance of the walls per unit area
Mwmcch= mechanical compliance of the walls per unit area
A,= surface area of the vocal tract behind the constriction
U,= volume velocity of air at the constriction
A,,
-=
cross-sectional area and length of the constrictionThe resonance of this circuit (h), which is the Helmholtz resonance of the idealized models I and II, could be approximated by:
fh 2 2 1 (2.6)
Where Mo, is the parallel combination of M, and M. (M,IM.).
Assuming that the quality factor (Q=f/bandwidth) of the circuit is high, then we can calculate the contribution of the constriction resistance (Re) to the bandwidth of the resonant frequency (fh) as follows:
B,
2nrM,(M,rM(M +
Me)
+ M,)(2.7)
At high frequencies, we can think of each cavity of the vocal tract as a distributed transmission line of length I and cross-sectional area A (Figure 2.7b). Shadle (1985) showed that the bandwidth contribution of the constriction to the resonances of such a transmission line is:
pc2Re
B, pC2 R (2.8)
= rAI(R2 + (27rfM)2)
(2.8)
The bandwidth contributions of the constriction losses to the first four formant frequencies for models I and II were calculated using Equation 2.7 and 2.8, with A.=0.15
cm2, and two values of l,: 1 and 2 cm. The values for R,,,eh and M,,,,ch were chosen
calculations were performed assuming the volume velocity U, to be 150 cm3/aec for the closed-glottis case, and 300 m3/sec for the open-glottis case. The bandwidth
contributions of the walls, viscosity, heat conduction, radiation, and the glottis (for the open-glottis case) were calculated using the program TBFDA1. The results are shown in Table 2.3.
2.4.2 Results and Discussion
If we compare the bandwidth values in Table 2.3 for the closed-glottis case (A,=0) to the formant frequency locations calculated in Section 2.2 (Table 2.1) we notice that the formant frequencies of both models are underdamped (Q > 0.5). However, the bandwidths of the Helmholts resonances (F: for the pharyngeal and F1 for the uvular) and F4 for both models have wider bandwidths than for the other two formant frequencies. The main contributor to the wide bandwidth of the Helmholtz resonance is the constriction loss (Be), whereas radiation losses presumably account for the widened F4 bandwidth.4 The constriction contribution (Be) for formant frequencies other than the Helmholtz is less significant, and decreases as the formant frequency locations become higher.
The results also show that the formant bandwidths for the open-glottis are higher than those for the closed-glottis. The increase in (Be) occurs mainly because of the assumed higher flow rate for the open-glottis case, while the increase in the bandwidth contribution of the other losses (Bvhrg) is due to the glottal losses which affect the Helmholtz and back-cavity resonances to a great extent.
We saw in Section 2.3 that the pole-zero distance for the Helmholtz resonance could be as high as 300 Hz depending on the source location. The results in this section indicate that the Helmholtz resonance is heavily damped by the glottal losses. So, even if it is not cancelled completely by the zero of the transfer function Uo/p, it is not expected to be strongly excited, since its bandwidth, for both models, is high (greater than 500 Hz).
For both cases (Ag=0 and Ag= 0.1 cm2), the constriction contribution Be decreases
as 1,, or equivalently M, (the acoustic mass of the constriction), increases. This can be seen in Equations 2.7, 2.8 where B, varies inversely with M,.
II
Us
a)
de Ibz
Q.c
Ab -- 1 -Zo- Q.C Afb)
Figure 2.7: Two models of the vocal tract used for calculating the bandwidth contri-bution of the constriction resistance (R,) to the formant-frequency bandwidths : a) Low-frequency model, and b) High-frequency model.
FORMANT-FREQUENCY BANDWIDTHS(Hs) The Pharyngeal Model
Be BA, Be B=01_ l-=1 cm F1 60 30 95 156 F2 152 74 305 642 F3 7 104 11 282 F4 2 165 5 176 1,=2 cm Fl 16 36 27 138 F2 73 72 146 999 F3 2 117 3 172 F4 .83 192 1 191
The Uvular Model
A:=O A=O.l cm2 B, Bw,,L& Be Bw.v /e=1 cm F1 137 63 275 312 F2 35 54 63 99 F3 17 49 30 162 F4 5 213 9 215 1,=2 cm Fl 60 80 121 317 F2 9 63 18 69 F3 6 46 8 173 F4 1 253 2 262
Table 2.3: Bandwidth contributions of the constriction (B,), and the contributions of the other losses (B,,,,) to the bandwidths the first four formant frequencies (Hz) for the pharyngeal and uvular models. For the open-glottis case the glottal losses are also included with the other" losses (B,,,hg) (see text for details).
I -I I