HAL Id: hal-01903841
https://hal.umontpellier.fr/hal-01903841
Submitted on 24 Oct 2018
HAL is a multi-disciplinary open access
archive for the deposit and dissemination of
sci-entific research documents, whether they are
pub-lished or not. The documents may come from
teaching and research institutions in France or
abroad, or from public or private research centers.
L’archive ouverte pluridisciplinaire HAL, est
destinée au dépôt et à la diffusion de documents
scientifiques de niveau recherche, publiés ou non,
émanant des établissements d’enseignement et de
recherche français ou étrangers, des laboratoires
publics ou privés.
Erosion, suspended sediment transport and
sedimentation on the Wadi Mina at the Sidi M’Hamed
Ben Aouda dam, Algeria
Faiza Hallouz, Mohamed Meddi, Yu Fisjak, Samir Toumi, Salah Eddine Ali
Rahmani
To cite this version:
Faiza Hallouz, Mohamed Meddi, Yu Fisjak, Samir Toumi, Salah Eddine Ali Rahmani. Erosion,
suspended sediment transport and sedimentation on the Wadi Mina at the Sidi M’Hamed Ben Aouda
dam, Algeria. Water, MDPI, 2018, 10 (7), pp.895. �10.3390/w10070895�. �hal-01903841�
Water 2018, 10, 895; doi:10.3390/w10070895 www.mdpi.com/journal/water Article
Erosion, Suspended Sediment Transport and
Sedimentation on the Wadi Mina at the Sidi
M’Hamed Ben Aouda Dam, Algeria
Faiza Hallouz 1,2,*, Mohamed Meddi 1, Gil Mahé 3, Samir Toumi 1 and Salah Eddine Ali Rahmani 4
1 Laboratoire Génie de l’Eau et de l’Environnement, Higher National School of Hydraulic, 09000 Blida, Algeria; m.meddi@ensh.dz (M.M.); s.toumi@ensh.dz (S.T.)
2 University of Khemis Miliana, 44225 Ain Defla, Algeria
3 IRD Hydrosciences, 34090 Montpellier, France, gilmahe@hotmail.com
4 Geo-Environment Laboratory, Faculty of Earth Sciences, Geography and Spatial Planning, University of Sciences and Technology Houari Boumediene, 16111 Bab Ezzouar Algiers, Algeria; alirahmani101990@gmail.com
* Correspondence: hallouzfaiza@gmail.com; Tel.: +213-660-319-854
Received: 28 March 2018; Accepted: 26 June 2018; Published: 4 July 2018
Abstract: The objective of this study was to follow-up on the evolution of the hydro-pluviometric
schemes and particular elements of Wadi Mina (6048 km2) to the Sidi M’Hamed Ben Aouda Dam to
evaluate the silting origin and status of this dam situated in the northwest of Algeria. The pluviometric study targeted a series of rains during 77 years (1930–2007), the liquid discharge data cover a period of 41 years (1969–2010) and the solids and suspended sediment concentrations data cover very variable periods, starting from 22 to 40 years for the entire catchment area. The statistical tests for ruptures detection on the chronological series of rains and discharges indicate a net reduction of rains of more than 20% on the entire basin since 1970. The evolution of solids inputs was quantified: the maximum values are registered on autumn start and at the end of spring. The Wadi Mina basin brings annually 38 × 106 m3 of water with a specific degradation of 860 t·km−2·year−1.
By comparing the results found, we thus observe that the basin upstream of SMBA (1B) Dam is the greatest sediment producer towards the dam because it shows a specific degradation equal to 13.36 t·ha−1·year−1.
Keywords: Wadi Mina; Algeria; sediment; ruptures; SMBA Dam; specific degradation
1. Introduction
Algeria has always been confronted with extreme phenomena: periodic droughts which were sometimes severe and lasting and floods that are more often than not catastrophic. These events constitute a major constraint for the economic and social development and have been the subject of numerous studies [1–12].
Following a rain over a catchment area, a complex mechanism of interactions between hydrological and erosive phenomena is started. The streaming related to strong precipitations entails the soil slide by erosion in quantities that are sometimes very abundant. This has an impact on the environment and one of the results is the soils fertility loss and the early filling of water impoundments (dams, ponds, lakes), thus reducing their storing capacity and possibly entailing as well as degradation of the water quality and usage conflicts [13].
Since the Independence of Algeria, the total number of dams in exploitation at national level increased from 14 in 1962 to 65 in 2014 and, if we add the inter-basin water transfer major works,
there are 7 billion m3 of water that are mobilized to be used for drinking water supply, irrigation and
industry [14].
The scale of aggradations and the raise of the bottom of these dam impoundments by successive deposits of sediments brought by the watercourses and the wind are a serious problem whose negative consequences are considerably felt in the agriculture, farming, fishing, electricity and navigation fields [15–17]. The study on the silting of lakes, catchment areas or dams is of considerable interest for attempting to explain the complex mechanisms of solid transport and to quantify the volumes of transported sediments [18–21] and for a potential dredging of the impoundment [22].
The sedimentation in North Africa dams is very high in relation to what is noted at international level. According to Lahlou [23], the 23 major dams that are being exploited in Morocco lose annually 50 Mm3 of their storage capacity. In Tunisia, the annual loss of the storage capacity is estimated
between 0.5% [24] and 1% for a total initial capacity of about 1430 Mm3 [25]. Algeria’s rivers transport
a large quantity of sediments [26,27]. The sediment deposited in Algerian dams is estimated to be 20 million m3·year−1 [28]. Competition for water among agriculture, industry, and drinking water
supply—accentuated by a drought in Algeria—has shown the need for greater attention to be paid to water [29] and for it to be managed at the large basin scale [30]. Surface water resources in Algeria are evaluated to be approximately 8376 billion m3 for an average year [31]. These water resources in
Algeria are characterized by wide variability—the resources for the last nine years have been significantly below this average [32]. Under these circumstances, several dams were built in Algeria to ensure water resources for the supply of drinking water to all its cities and allowed approximately 12,350 km2 of irrigated land to be developed [31–33]. However, the sediments deposits in the dam
reservoirs are estimated, on average, at 20 million m3 per year [34]. The high efficiency of sediments
transport of the Algerian rivers [27,35] encouraged numerous authors to study the transfer of sediments in suspension in this area [36–41]. Considering these problems and to establish the lifespan of dams and to implement a better strategy of water resources management, research on the dynamics of sediments underlines the need to better understand the variations of erosion, deposits and dynamics of storage of sediments in a variety of catchment areas and rivers [42]. In this context, a certain number of studies used the relation of concentration of suspended particles matters (SPM) for acquiring a more complete understanding of the drainage basins processes [19,43,44].
Among the factors that favor erosion (slope, nature of rocks, hilly area, climate, and human activities), climate is recognized as the main factor in the semiarid Mediterranean regions of Algeria that go through short and intense rain episodes, a strong power of evaporation of the wind, prolonged droughts and freezing cycles [45,46]. The erosion is extremely active and the average concentration is at least higher than the global average [42].
Indeed, the main works for surface waters mobilization (big dams, dams and small lakes) were built on the watercourses of basins situated in the northern part of the country. These basins are characterized by various hilly areas dominated, on the one side, by marly lands and soils vulnerable to erosion and, on the other side, by a forest cover limited in the most watered parts and a seasonal vegetation cover. To these natural conditions is added the torrential nature of precipitations that fall at the end of the dry season and that would be responsible for a major part of the erosion and the solid load of water [21].
This article presents a study of erosion, sedimentation and climate change on Wadi Mina, at the Sidi M’Hamed Ben Aouda Dam in the northeast of Algeria, in a semiarid area. It is essential to know the evolution of water resources available for this dam in a variable climatic environment. In addition, since 1976 the rains reduction starting [47] and the increase in extreme events [48], the erosion and solids transport conditions were modified. The first results of the SIGMED (Approche Spatialisée de l’Impact des activités aGricoles au Maghreb sur les transports solides et les ressources en Eau De grands bassins versants) program showed as well the impact of human activities on environment and erosion [49,50], but it is still difficult to quantify the anthropogenic and climatic parts responsible for the recent modifications of the dynamic erosion on the basin [51].
The watershed of Wadi Mina (6048 km2, northwest Algeria) is the subject of numerous works in
The hydrologic part was a study on the rain and water flows in the basin towards available stations supplied by ANRH (National Agency for Hydraulic Resources). The solid transport of suspended particles matters (SPM) was estimated based on specific measures taken by the hydrological services of ANRH during the period 1969–2010. The water volume of the SMBA (Sidi M’Hamed Ben Aouda) Dam was estimated based on the results of the bathymetric measures supplied by ANBT (National Agency for Dams and Transfers) in the period 1978–2004.
In the last part, we studied the sedimentation study on the SMBA Dam and the origin of sediments, comparing the soil loss measured at the hydrometric stations with the dam silting data (bathymetry) with the results of a study of soils erosion by the USLE (Universal Soil Loss Equation) method carried out by Toumi et al. [66]. This is the first comparative study in Algeria which compares the erosion and sedimentation rates on a river basin and the associated reservoir, from several different approaches; this is the originality of this article in relation to the literature.
2. Materials and Methods 2.1. Study Area
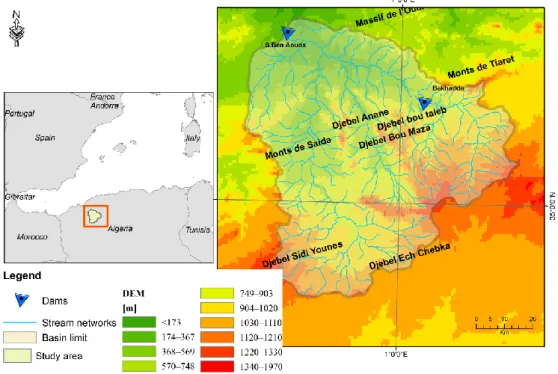
Situated in a semiarid area, the catchment area of Wadi Mina presents strong erodibility and the good availability of pluviometric and hydrometric data. Situated at around 300 km west of Algiers, the catchment area Wadi Mina drains, at the level of the Sidi M’Hamed Ben Aouda (SMBA) Dam, a surface of 6048 km2 (Figure 1). Wadi Mina is among the main tributaries of Wadi Cheliff. There are
two dams on Wadi Mina, the SMBA Dam, subject of our study, and the Bakhadda Dam, situated at 90 km. The topographic study [68] allowed classifying the studied sub-basins in the hard hilly landscape class, in accordance with the IRD (French National Institute for Research for Sustainable Development) classification [69]. The basin of Wadi Mina spreads on dissimilar natural units: • In the south, the Tellian plateaus also include the mountains of Frenda and Saida, with an
altitude ranging from 900 to 1300 m, where limestone shows on the surface.
• In the north, a unit of mountain ranges and basins, generally of inferior altitude of 900 m, within a complex geological structure, individualized in blocks, where Ouarsenis is one of the most remarkable. They are characterized by an abundance of outcrops of marls, very sensible at hydric erosion.
The climate of the region is Mediterranean semi-arid with an annual average precipitation of 305 mm, marked by an irregularity which is both seasonal and inter-annual [68]. Moreover, the analysis of geographical repartition and the diversity of vegetal formations on the basin showed the existence of two parts clearly distinct [59,70]: the north area which is purely marlacious, strongly eroded and lacking vegetation, except for a few small islands of reforestation and plantations of fruit trees in the valley and the south area which is less eroded and where about 50% of the surface is covered by scattered vegetation with very variable density, ranging from the localized forest (pine of Alep) to the very scattered covering scrub. It must be noted that subsistence agriculture reigns with excessive exploitation of soils, a permanent clearing and an intensive overgrazing.
2.2. Acquisition and Preparation of Data
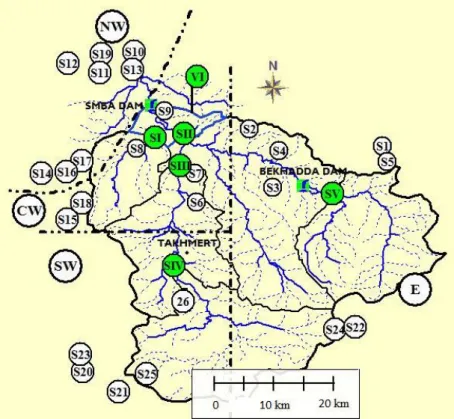
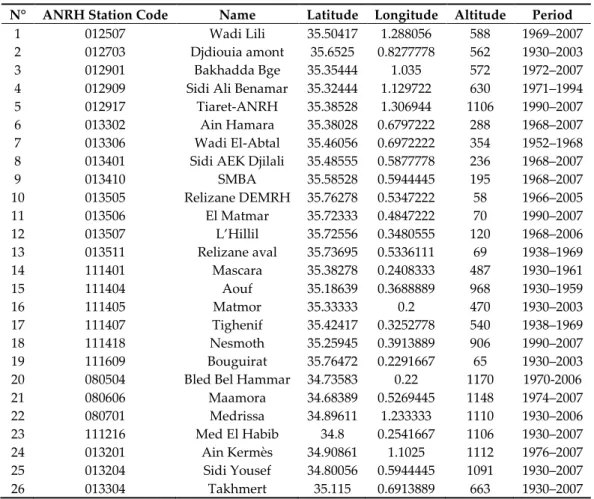
The pluviometric data came from the National Agency of Hydraulic Resources (ANRH). They are registered at 26 pluviometric posts (Table 1) distributed on the catchment area and the related observation duration is variable. The longest chronicles (1930–2007) are registered at the pluviometric stations in the south of the basin (Figure 2).
Figure 2. Localization of pluviometric and hydrometric stations (group of regions: E: east; NW:
northwest; CW: center-west; and SW: southwest).
For the entire 26 stations of the basin of Wadi Mina over a period of 77 years (1930–2007), it has been estimated at around 4% the total number of gaps on all the time series of monthly and annual precipitation. Gaps in rainfall series were filled using the method of the regional vector to facilitate the use of rupture tests [47].
Table 1. Inventory of pluviometric stations (latitudes and longitudes in decimal degrees, altitude in m). N° ANRH Station Code Name Latitude Longitude Altitude Period
1 012507 Wadi Lili 35.50417 1.288056 588 1969–2007 2 012703 Djdiouia amont 35.6525 0.8277778 562 1930–2003 3 012901 Bakhadda Bge 35.35444 1.035 572 1972–2007 4 012909 Sidi Ali Benamar 35.32444 1.129722 630 1971–1994 5 012917 Tiaret-ANRH 35.38528 1.306944 1106 1990–2007 6 013302 Ain Hamara 35.38028 0.6797222 288 1968–2007 7 013306 Wadi El-Abtal 35.46056 0.6972222 354 1952–1968 8 013401 Sidi AEK Djilali 35.48555 0.5877778 236 1968–2007 9 013410 SMBA 35.58528 0.5944445 195 1968–2007 10 013505 Relizane DEMRH 35.76278 0.5347222 58 1966–2005 11 013506 El Matmar 35.72333 0.4847222 70 1990–2007 12 013507 L’Hillil 35.72556 0.3480555 120 1968–2006 13 013511 Relizane aval 35.73695 0.5336111 69 1938–1969 14 111401 Mascara 35.38278 0.2408333 487 1930–1961 15 111404 Aouf 35.18639 0.3688889 968 1930–1959 16 111405 Matmor 35.33333 0.2 470 1930–2003 17 111407 Tighenif 35.42417 0.3252778 540 1938–1969 18 111418 Nesmoth 35.25945 0.3913889 906 1990–2007 19 111609 Bouguirat 35.76472 0.2291667 65 1930–2003 20 080504 Bled Bel Hammar 34.73583 0.22 1170 1970-2006 21 080606 Maamora 34.68389 0.5269445 1148 1974–2007 22 080701 Medrissa 34.89611 1.233333 1110 1930–2006 23 111216 Med El Habib 34.8 0.2541667 1106 1930–2007 24 013201 Ain Kermès 34.90861 1.1025 1112 1976–2007 25 013204 Sidi Yousef 34.80056 0.5944445 1091 1930–2007 26 013304 Takhmert 35.115 0.6913889 663 1930–2007
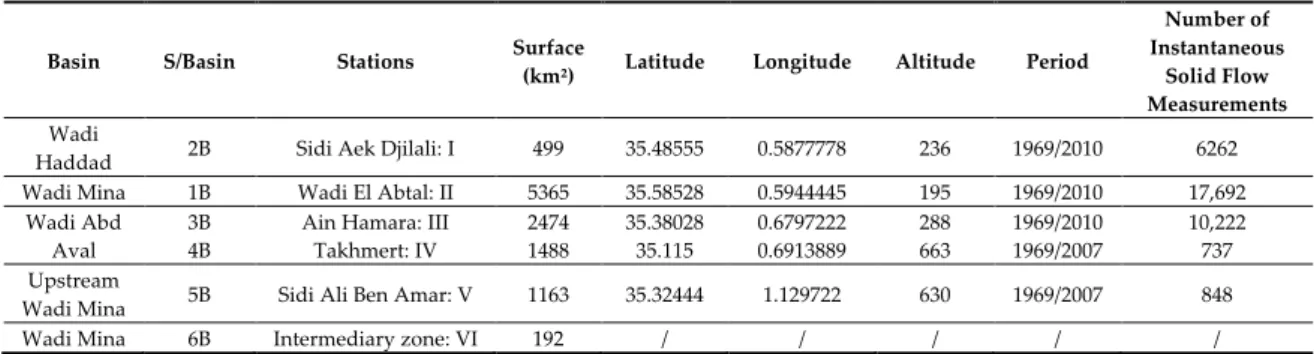
The longest possible series of hydrometric data (1969–2010) were used (Table 2). We have at our disposal five hydrological series on the Wadi Mina basin, with little or no gaps (Figure 3).
The solid discharges and concentrations of SPM data cover 40 years periods from 1970/1971 to 2009/2010 for the Wadi El Abtal and Sidi Abdel Kader Djilali stations, from 1975/1976 to 2009/2010 for the Ain Hamara station (35 years old), from 1985/1986 to 2005/2006 for the Sidi Ali Ben Amar station, and from 1972/1973 to 1993/1994 for the Takhmert station (22 years old).
The measurement of suspended sediment concentrations (C) consists of a systematic sampling of water samples using a 500 cL bottle. These samples are taken at a single point, either on the edge or in the middle of the Wadi. Samples are more numerous during floods, while in low water or when the liquid discharge (Q) is constant during the day, only one sample is taken. The difficulty of the measurement is the non-uniformity of the sediment concentration in the measurement section. The turbidity measurement procedure used by ANRH is developed in the work of Bourouba [35] and Meddi [68].
C and Q measurements were used to define rating curves that estimate C from measured values of Q on the Wadi Mina, according to a common approach [71–76]. The curves most commonly used to estimate sediment transport is a power function [77–79]: Q = aCb, where a and b are regression
Table 2. Inventory of hydrometric stations used for the study.
Basin S/Basin Stations Surface
(km²) Latitude Longitude Altitude Period
Number of Instantaneous
Solid Flow Measurements
Wadi
Haddad 2B Sidi Aek Djilali: I 499 35.48555 0.5877778 236 1969/2010 6262 Wadi Mina 1B Wadi El Abtal: II 5365 35.58528 0.5944445 195 1969/2010 17,692
Wadi Abd Aval
3B Ain Hamara: III 2474 35.38028 0.6797222 288 1969/2010 10,222 4B Takhmert: IV 1488 35.115 0.6913889 663 1969/2007 737 Upstream
Wadi Mina 5B Sidi Ali Ben Amar: V 1163 35.32444 1.129722 630 1969/2007 848
Wadi Mina 6B Intermediary zone: VI 192 / / / / /
2.3. Methods Used
The main objective of the analysis of a chronological series, in accordance with Kendall and Stuart [80], is to bring clarity on the statistical mechanisms generating this series of observation.
Discontinuities in the studied datasets were analyzed using the rupture tests of Pettitt, Buishand, Lee, and Heghinian and the segmentation procedure of Hubert [81]. The null hypothesis tested is that there is no rupture in the series and a rupture is considered as very likely when it is statistically significant and is detected by two tests or two stations. These procedures are well defined by Maftei et al. [82] and in Khomsi et al. [83]. The choice of retained methods is based on the robustness of their foundation and the conclusions of a simulation study of artificially disturbed random series [84]. The study was performed with the software KHRONOSTAT [85], developed by IRD [86].
These tests were applied on the precipitations series in Algeria [87], Morocco [88] and Sub-Saharan Africa [89] as well as on the hydro-pluviometric studies series of the Sudan-Sahelian area [89,90], in West and Central Africa [91], and Tunisia [92]. These methods are thus largely validated in many regions of the world, on rains, discharges or temperatures series.
2.3.1. Flood Frequency Analysis (FFA)
The HYFRAN-PLUS software (version-V2.1) developed by the Canadian Institute (INRS-ETE, Eau Terre Environnement Research Centre of Institut national de la recherche scientifique), is designed for Hydrological Frequency Analysis (FFA) especially for extreme value. In the FFA, data corresponds to observations X1,…,XN which are independent and identically distributed (IID), i.e.,
verify the hypothesis of homogeneity, stationarity and independence. Several models are available to fulfill this task and the selection of the most robust approach to fit the model to data is a great challenge [93]. The prediction procedure is mainly based on the selection of the best fit for a given dataset. Conventional estimates of flood exceedance quantiles are highly dependent on the form of the underlying flood frequency distribution [94]. Several frequency distributions have been developed to fit different probability shapes, especially for extreme values. The first models related to extreme value theory (EVT) are the Generalized Extreme Value distribution [95], Gumbel [96] and then other models such as Lognormal distribution, Pearson family, Halphen family, Logistic distribution related models are proposed to give more flexibility when the EVT hypotheses are not fulfilled [97].
A decision support system (DSS) has been developed in the HYFRAN-PLUS software [98] to discriminate the different classes of the statistical distributions, and especially to estimate the quantiles for high return period T. Note that, for a random variable Q, the quantile QT with a return period T is the solution of the equation: Pr[𝑄 > 𝑄𝑇] =
1
𝑇. DSS is mainly based on the classification of
statistical distributions according to their asymptotic behavior. DSS is mainly based on the classification of statistical distributions according to their asymptotic behavior [99].
There are three nested classes of distributions that are commonly used for extremes [94,100] and implemented in the HYFRAN-PLUS software: Class C (regularly varying distributions) containing Fréchet (EV2), Halphen Inverse B (HIB), Log-Pearson type 3 (LP3) and Inverse Gamma (IG) distributions, class D (the sub-exponential distributions) involving Halphen type A (HA) and B (HB),
Gumbel (EV1), Pearson type 3 (P3) and Gamma (G) distributions and the class E of distributions with inexistent exponential moments (Figures 3 and 4). The Log-Normal (LN) distribution has an asymptotic behavior between the C and D classes [94]. However, the use of the Generalized Extreme Value (GEV) distribution is currently a standard, thanks to the simplicity of its quantile function and the availability of software for parameter estimation [94].
Figure 3. Distributions ordered with respect to their right tails [94].
The methods developed in the DSS allow identifying the most adequate class for adjusting a given sample. These methods are (Figure 4) [94]:
• the test Jarque–Bera (JB test): considered to test the log-normality with selected a priori based on the diagram (represented by coefficients of variation Cv and skewness Cs);
• the graphic log-log: used to discriminate firstly the class C and secondly D and E classes; Mean Excess Function (MEF) used to discriminate the classes D and E; and two statistics: the ratio of Hill and Jackson statistics that can be used to perform a confirmatory analysis of suggested conclusions from the two previous methods (log-log graph and MEF).
2.3.2. Generalized Extreme Value (GEV) Distribution and the Extreme Value Theory (EVT)
The generalized extreme value (GEV) distribution appears to be a universal model for hydrological extremes in several regions of the world (in particular in the United Kingdom), the same as the Log-Pearson type 3 distribution in the USA and Australia or Lognormal distribution in China [94].
When modeling the maxima of random variables, extreme value theory plays the same fundamental role as the central limit theorem when modeling sums of variables. In both cases, the theory tells us what are the limiting distributions. Generally, there are two main ways to identify extremes in real data. Let Y1,…,YN, be a sequence of N random variables, and X their maximum:
𝑋 = max{𝑌1, … ,𝑌𝑁} taken in successive periods. If the variables Y1,…,YN are independent and
identically distributed and F0 is their distribution function (referred here as parent distribution), the
distribution of the maximum X is given by:
𝑯𝑵(𝒙) = 𝑷(𝑿 = 𝐦𝐚𝐱(𝒀𝟏, … , 𝒀𝑵) < 𝒙) = 𝑷(𝒀𝟏< 𝒙, … , 𝒀𝑵< 𝒙 = ∏ 𝑷(𝒀𝟏 𝑵 𝒊=𝟏 < 𝒙) = [𝐹0(𝑥)]𝑁 (1)
Let X1,...,XN constitute the extreme events, also called block of maxima, taken in n successive
periods, for example n years. The limiting distribution for the block of maxima is given by Fisher and Tippett [101]. The Fisher–Tippett theorem states that if the sequence Y1,…,YN are Independent and
Identically Distributed (IID) and if there exist constants 𝐶𝑁> 0, 𝑑𝑁∈ 𝑅 and some non-degenerate
function H such that HN converges, when N tends to infinity, towards H in distribution (𝐻𝑁→ 𝐻),
then H corresponds to one of the three standard extreme value distributions:
Gumbel (EV1): 𝐴(x) = exp(−e−x), 𝑥 ∈ 𝑅 (2) Fréchet (EV2): 𝛷𝑘(𝑥) = {
0 𝑥 ≤ 0
𝑒𝑥𝑝(−𝑥𝑘) 𝑥 > 0 𝑘 < 0 (3)
Reverse Weibull (EV3): 𝛹𝑘(𝑥) = { 𝑒𝑥𝑝(−(−𝑥
𝑘)) 𝑥 ≤ 0
0 𝑥 > 0 𝑘 > 0 (4) Depending on each case, the distribution of the original observation F0 belongs to the
Max-Domain of Attraction (MDA) of A, 𝛷𝑘 𝑜𝑟 𝛹𝑘:
• The Gumbel MDA contains a great variety of distributions such as Normal, Gamma, Exponential and Gumbel.
• The Fréchet MDA contains distributions with power decay tail as the Pareto, Student, Cauchy, Inverse Gamma and Fréchet.
• The Weibull MDA distributions are light tailed with finite right endpoint. Such domain of attraction encloses Uniform and Beta distributions and is not of interest in FFA. The Weibull distribution has an upper bound and is not considered for high extremes.
Von Mises [101] proposed the generalized extreme value (GEV) distribution, which includes the three limit distributions EV1, EV2 and EV3. Another re-parameterization given by Fisher and Tippett [102] is generally used in hydrology:
𝐹𝐺𝐸𝑉(𝑥) = { 𝑒𝑥𝑝 [− (1 −𝑘 𝛼(𝑥 − 𝜇)) 1 𝑘
] 𝑘 ≠ 0 (EV2 and EV3)
𝑒𝑥𝑝 [− exp (−(𝑥 − 𝜇)
𝛼 )] 𝑘 = 0 (EV1)
whenever 1 − 𝑘 (𝑥−𝜇)
𝛼 ≥ 0. When the shape parameter k is positive (respectively negative), the GEV
corresponds to the inverse Weibull (EV3) (respectively Fréchet, EV2) distribution. The limiting case,
k = 0, corresponds to the Gumbel (EV1) distribution. The simplicity of the GEV distribution function
lead to an explicit expression of the quantile function to compute quantile for a given non-exceedance probability p: 𝑥𝑝= { 𝜇 +𝛼 𝑘(1 − (− ln 𝑝) 𝑘) 𝑘 < 0 (EV2) 𝜇 − 𝛼ln (− ln 𝑝) 𝑘 = 0 (EV1) 𝜇 +𝛼 𝑘(1 − (− ln 𝑝) 𝑘 𝑘 > 0 (EV3) (6)
This explicit quantile formula is also useful to generate a GEV samples by inversion method based on the generation of uniform distribution.
2.3.3. USLE Method
A classic example is the Universal Soil Loss Equation (USLE) [103]. This method expresses the long-term average annual soil loss as a product of rainfall erosivity factor (R factor), soil erodibility factor, slope length factor, slope steepness factor, cover-management factor, and support practice factor. USLE only predicts the amount of soil loss that results from sheet or rill erosion on a single slope and does not account for additional soil losses that might occur from gully, wind or tillage erosion. This erosion model was created for use in selected cropping and management systems, but is also applicable to non-agricultural conditions such as construction sites. The USLE can be used to compare soil losses from a particular field with a specific crop and management system to “tolerable soil loss” rates. Alternative management and crop systems may also be evaluated to determine the adequacy of conservation measures in farm planning. However, erosion is seen as a multiplier of rainfall erosivity (the R factor, which equals the potential energy); this multiplies the resistance of the environment, which comprises K (soil erodibility), SL (the topographical factor), C (plant cover and farming techniques) and P (erosion control practices). Since it is a multiplier, if one factor tends toward zero, erosion will tend toward zero.
3. Results
3.1. Analysis of Precipitations
At the monthly scale, some significant patterns arise. There are two periods of maximum occurrence of rupture in the rainfall time series of the stations studied, Autumn until January, which concentrate more than 40% of the annual amount of precipitation, with a peak in December and January, and Spring between April and June with more than 20% of the annual amount and two peaks in June and April. Intermediate seasons show much less occurrences of ruptures during the 1970s. However, during the 1980s the maximum of occurrence of ruptures is in August, and similarly during the 2000s in August and September, while during the 1990s the maximum is in March (Table 3).
The pluviometric posts for which a rupture could be detected are more numerous in the north than in the south. The pluviometric deficits noted are frequently close to 19–20%. This pluviometric deficit is thus felt for more than three decades and seems to be accentuated during the 1970–1980 decade. The areas in the west center and northwest have higher totals ruptures than the other areas on a monthly and yearly scales.
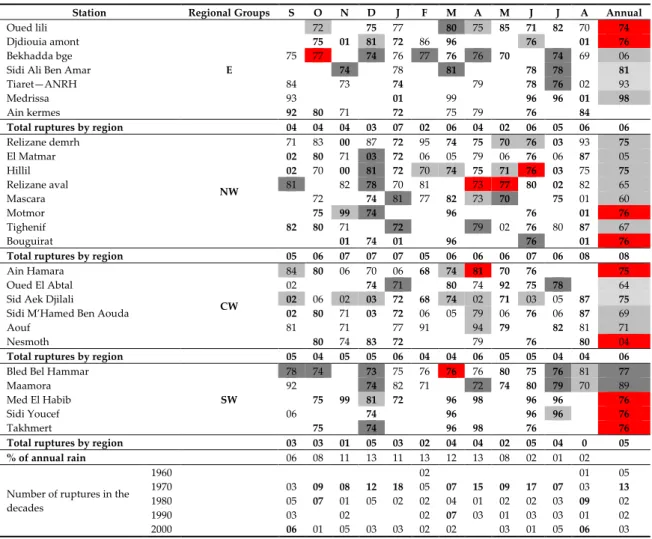
Table 3. Ruptures detected at the level of each pluviometric station. Ruptures dates detected by three
statistical tests (red: strong rupture), by at least two statistical tests (dark gray: probable ruptures), by at least one statistical test (light gray: weak rupture) on the catchment areas (in bold: the ruptures dates detected for more than one catchment area the same year or the same month) (empty box = no probable rupture detected).
Station Regional Groups S O N D J F M A M J J A Annual
Oued lili
E
72 75 77 80 75 85 71 82 70 74
Djdiouia amont 75 01 81 72 86 96 76 01 76
Bekhadda bge 75 77 74 76 77 76 76 70 74 69 06
Sidi Ali Ben Amar 74 78 81 78 78 81
Tiaret—ANRH 84 73 74 79 78 76 02 93
Medrissa 93 01 99 96 96 01 98
Ain kermes 92 80 71 72 75 79 76 84
Total ruptures by region 04 04 04 03 07 02 06 04 02 06 05 06 06
Relizane demrh NW 71 83 00 87 72 95 74 75 70 76 03 93 75 El Matmar 02 80 71 03 72 06 05 79 06 76 06 87 05 Hillil 02 70 00 81 72 70 74 75 71 76 03 75 75 Relizane aval 81 82 78 70 81 73 77 80 02 82 65 Mascara 72 74 81 77 82 73 70 75 01 60 Motmor 75 99 74 96 76 01 76 Tighenif 82 80 71 72 79 02 76 80 87 67 Bouguirat 01 74 01 96 76 01 76
Total ruptures by region 05 06 07 07 07 05 06 06 06 07 06 08 08
Ain Hamara
CW
84 80 06 70 06 68 74 81 70 76 75
Oued El Abtal 02 74 71 80 74 92 75 78 64
Sid Aek Djilali 02 06 02 03 72 68 74 02 71 03 05 87 75
Sidi M’Hamed Ben Aouda 02 80 71 03 72 06 05 79 06 76 06 87 69
Aouf 81 71 77 91 94 79 82 81 71
Nesmoth 80 74 83 72 79 76 80 04
Total ruptures by region 05 04 05 05 06 04 04 06 05 05 04 04 06
Bled Bel Hammar
SW 78 74 73 75 76 76 76 80 75 76 81 77 Maamora 92 74 82 71 72 74 80 79 70 89 Med El Habib 75 99 81 72 96 98 96 96 76 Sidi Youcef 06 74 96 96 96 76 Takhmert 75 74 96 98 76 76
Total ruptures by region 03 03 01 05 03 02 04 04 02 05 04 0 05
% of annual rain 06 08 11 13 11 13 12 13 08 02 01 02
Number of ruptures in the decades 1960 02 01 05 1970 03 09 08 12 18 05 07 15 09 17 07 03 13 1980 05 07 01 05 02 02 04 01 02 02 03 09 02 1990 03 02 02 07 03 01 03 03 01 02 2000 06 01 05 03 03 02 02 03 01 05 06 03
Indeed, 13 stations present a considerable rupture during the 1970–1980 decade for the entire catchment area of Wadi Mina, which represents 50% of the pluviometric stations used in this study (Figure 5).
It is equally interesting to note that the stations that present ruptures are localized differently during each decade: in the northwest of the basin before the 1970 decade, on the entire basin, except for the highlands of south and southeast, between the years 1970 and 1980, and on the entire basin, except for the center, after 1980, but in proportion representing less than half.
Figure 5. Ruptures detected at rainfall stations: (a) before 1970; (b) 1970–1980; and (c) after 1980.
Rupture dates were detected: by three statistical tests (black: strong ruptures); by two statistical tests (dark grey: probable rupture); or by at least one statistical test (light grey: weak rupture).
Indeed, we have noted a rupture corresponding to a decrease of precipitations during the mid-1970s over the whole Wadi Mina basin (58% series present a rupture in 1976) (Table 3), date presented by numerous researchers [6,104], who already indicated the tendency towards drought starting with 1970 in north Algeria. These results are compliant with the recent works in Algeria [8,11] and which concluded to a rains decrease noted during the last thirty years which hit the entire country of Algeria, but especially its western part, adding up to: (a) 30–40% at annual level and more than 40% during winter and spring in the Mascara region; (b) 20–30% on the littoral, starting from the center to the western part of the country; and (c) 20% at annual level and 25% during winter in the center of the country. They confirm as well the results of works carried out on the basins of the extreme west in Algeria [6,11] which concluded to a decrease of rainfall. A rupture in the rainfall time series is frequently observed in 1979–1980, except 1972 for the Wadi Mina basin, at the Wadi El Abtal and Ain Hamara stations, and 1976 for the west-central part of Algeria. These results confirm as well the occurrence in Morocco of a pluviometric deficit starting with 1970 and its continuation during the 1980s, an extremely severe and long drought episode [105]. At the level of North Africa, the results obtained by Meddi et al. [11] in Algeria and by Bouzaiane and Laforgue [106] in Tunisia indicate the same rupture period and show the spatial extension of the drought, accompanied by a net pluviometric reduction. The conclusions of the Intergovernmental group on the climate evolution from 2001 and 2007 [107] and those of the regional report of the United Nations on the changes in North Africa [108], go in the same direction.
3.2. Analysis of Hydrological Data
The discharges register a global decrease since 1970 (Table 4), or the probable ruptures are noted as well during rainy season and dry season (Table 4), which means that even the low water levels are slow, for a sudden drop, it indicates that the level of the groundwater has also abruptly fall.
Table 4. Detection of ruptures in the annual and monthly flow series and annual maximum (Qmaxd) and minimum (Qmind) daily discharge (1968/1969–2006/2007). Dates of ruptures detected by three statistical tests (red: strong ruptures), by at least two statistical tests (dark gray: probable ruptures), by at least one statistical test (light gray: weak rupture) (on the catchment areas (in bold: the ruptures dates detected for more than one catchment area the same year or the same month) (empty box = no probable rupture detected).
Station S O N D J F M A M J J A Annual Discharge Qmaxd Annual Daily Qmind Annual Daily Ain Hamara 72 99 71 74 06 81 84 80 70 00 79 72 92 72 Takhmert 93 75 96 89 95 02 97 94 85 94
Sidi Ali Ben Amar 74 82 82 83 88 87 87 87 89 90 90 81 70 81 Wadi El Abtal 73 73 70 95 72 81 80 76 79 75 74 84 72
Sidi Aek Djilali 70 75 90 70 90 87 91 75 76 76 75 74 75 95 74
% annual discharge Total
Number of ruptures in the decades 1960 0 1970 3 4 3 1 1 1 1 3 2 3 3 22 1980 1 2 1 2 2 3 3 1 1 2 1 15 1990 1 3 1 2 1 2 1 1 11 2000 1 1 1 3
At annual level, the probable rupture dates are 1974, 1975, 1980 and 1994, which corresponds generally to the ruptures detected at month level. In addition, the ruptures on the series of annual daily maximum were for the most part noted in 1970, 1984 and 1995 and the ruptures dates for the annual daily minimum series are detected in 1972, 1981 and 1994. The rupture in the daily maximum flows series is thus never noted the same year as in the average annual flows series, while there are the same ruptures dates for the average annual flows and the minimum daily flows.
In Sahelian and non-Sahelian Africa, many authors have revealed, based on hydro-pluviometric series, a dry phase which started around 1970 [109,110] and which lasts until today [111,112], it was noted as well a decrease of rivers flows [109,113,114], lakes levels [113], as well as a shortening of the rainy season [115,116].
These results indicate a satisfactory concordance with the dates detected on the annual and monthly rainfall of late 1970s/early 1980s. We thus assume that the decrease of runoff would be caused by a global decrease in precipitations on the catchment area of Wadi Mina [47]. However, we must not rule out a possible impact of storages and uses on the drastic decline of low water levels compared to groundwater.
In addition, several authors, among which [117], have as well reported rain decreases for the Mediterranean perimeter: in Spain, Italy, Turkey and Cyprus from 1951 to 1995 [118], between 1950 and 2000 in October in Mediterranean Iberia, March in Atlantic Iberia, January and winter in Greece and winter in the Middle East. Hulme et al. [119] showed a strong decrease of rains for the Mediterranean basin between the start and the end of 20th century. Likewise, subsequent to an analysis of the evolution of pluviometric inputs in the plains of Ghriss (northwest Algeria) [10], it was shown a net decrease starting with 1973, estimated at more than 25%. We can quote as well other results that have indicated that rains simulation over north Algeria, with an annual decrease of 15%, would entail a reduction of the annual runoff of 40% [120]. In Morocco, a climatic rupture that starts around 1976 in certain regions and which extends largely around 1979–1980, to nearly the entire territory, was noted [69,121].
As a consequence of the decrease of rainfall after the 1970s rupture which was observed in most basins of western Algeria, river discharges generally decreased as well. Meddi and Hubert [6] showed that the decrease in river discharge varied between −37% and −70% from eastern Algeria to western Algeria. In the Macta basin in northwest Algeria, runoff was estimated to be 28–36% lower
in 1976–2002 as compared to 1949–1976 [11]. In the Tafna basin, also in northwest Algeria, research [122,123] showed that the decrease in precipitation after the rupture date was, on average, 29% over the whole basin and was accompanied by a decrease of 60% in river flow [42]. In Wadi Sebdou in west Algeria, Norrant and Douguédroit [118] showed that rainfall and discharge began to decrease in the 1970s. The diminution of rainfall by 24% between the period 1939–1975 (526 mm) and the period 1975–2004 (401 mm) induced a decrease by 55% of the yearly volume discharged in 1975–2004 as compared to 1939–1975. A similar variability was observed on Wadi Abd basin (Wadi Mina) [43]. Finally, we note that annual discharges have been decreasing overall since the 1970s, which generally corresponds to ruptures detected at the monthly time step. There is therefore a good agreement with the rupture dates in the annual rainfall series, which suggests a climatic cause, in the first place, the observed decline in discharges in the Wadi Mina basin [47].
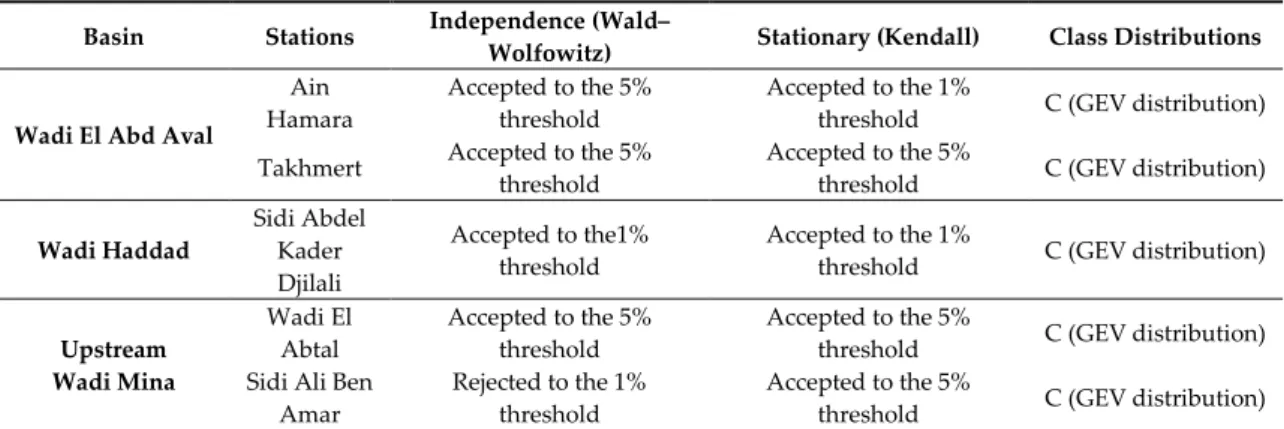
The study of floods is a precondition for the choice of an adjustment distribution and thus the floods flows on the entire Wadi Mina basin are classified in category C and follow a GEV distribution (Table 5).
The results of stationary nature and independence hypotheses tests of the studied data concerning the annual floods of the stations of the sub-basins of Wadi Mina indicate the acceptance of the independence tests of Wald–Wolfowitz and the stationary nature tests of Kendall for all the stations (Table 5).
Table 5. Distribution of floods for each station of the Wadi Mina basin.
Basin Stations Independence (Wald–
Wolfowitz) Stationary (Kendall) Class Distributions
Wadi El Abd Aval
Ain Hamara
Accepted to the 5% threshold
Accepted to the 1%
threshold C (GEV distribution) Takhmert Accepted to the 5%
threshold
Accepted to the 5%
threshold C (GEV distribution) Wadi Haddad Sidi Abdel Kader Djilali Accepted to the1% threshold Accepted to the 1%
threshold C (GEV distribution)
Upstream Wadi Mina Wadi El Abtal Accepted to the 5% threshold Accepted to the 5%
threshold C (GEV distribution) Sidi Ali Ben
Amar
Rejected to the 1% threshold
Accepted to the 5%
threshold C (GEV distribution)
The study of the floods recurrence variability before and after the ruptures was performed on all the stations of the basin of Wadi Mina (Figure 6). For all the stations, the maximum discharges values decreased for the same return period with about 30 to 40%. For example, at the Ain Hamara station and before the rupture of 1992, the floods with intensity lower than 80 m3·s−1 only return once
in five years (Figure 6a). However, beyond this value, precisely starting with 99 m3·s−1, the floods
present longer return periods (20–100 years). However, after the same rupture date and for the same return periods, the intensities of the floods considerably decreased. For example, with a return period of 20 years before 1992, the flood with an intensity of 99 m3·s−1 became centenary.
Figure 6. Impact of ruptures in the hydrometric series on the floods recurrence. (a) Ain Hamara
station; (b) Sidi Ali Ben Amar station; (c) Sidi Abdelkader Djilali station; (d) Wadi El Abtal station; (e) Takhmert station.
The change of the pluviometric regime of the 1970s had thus as an impact a variance of recurrence of floods on all the sub-basins of the catchment area of Wadi Mina.
The pluviometry reduction has, of course, consequences on the watercourses regimes and thus on the availability of water resources which is the key to the success of many development projects. Nevertheless, the consequences of this reduction of flown volumes are already obvious with regard to the water and environment resources exploitation. Agriculture and the alimentation of impoundments are largely sanctioned by this resource decrease. The consequences of this phenomenon are thus very worrying with regard to the good functioning and the cost-effectiveness of projects already performed or planned.
3.3. Solids and Liquids Annual Transports
The annual average concentrations of SPM are compared with annual average discharge (Figure 7). Despite year-to-year irregularities at the Sidi Aek Djilali station, concentrations and discharges have changed in opposite directions. Discharges increased from 14 m3·s−1 in the late 1980s to less than
3 m3·s−1 in the early 2000s, while concentrations increased from 44 g·L−1 in 1974 to nearly 78 g. In 2005,
flows at the El Abtal Wadi station increased from more than 40 m3·s−1 in 1974 to 0.48 m3·s−1 in 1997,
whereas the concentrations evolved by 12 g·L−1, in 1971, to almost more than 67 g·L−1 in 2005.
However, ruptures were detected on the rainfall and discharges from the mid-1970s, but this result show that is no effect of ruptures in precipitation and discharge on the solid load response since the discharge and rainfall decrease in the 1970s and increase in the early 2000s while the sediment load is still increasing. Geomorphologists have noted the difficulty of predicting the impacts of climate change on sediment yield due to nonlinear effects [124–126]. In addition, Achite and Ouillon [42] in their study on Wadi Abd basin, found that the change in flow regime induced a fully nonlinear effect between river discharge and sediment yield. This must be considered in the forecasts, especially in small river basins in semi-arid areas.
Figure 7. Evolution of annual average of discharges and concentrations of SPM in the Wadi Mina
basin: (a) Wadi El Abtal station; (b) Sidi Aek Djilali station.
Regression analysis was performed between the concentration in instant suspended sediment (c) and the instant discharge (Q) at Wadi Mina. Generally, the power model Q = aCb, where a and b
are regression coefficients, is the most used for the estimation of the sediment concentration (Figure 8) [77–79].
Figure 8. Relation between the liquids instantaneous flows and the concentrations of matters in
As for the majority of watercourses, we found a power relation [127] for Wadi Mina, connecting the concentration of SPM in g·L−1 to the liquid discharge in m3·s−1 (Figure 8). A first graphic analysis
of this figure shows a fairly strong dispersion around the regression line, with a very broad concentration range for low discharges below 10 m3·s−1 and concentrations that become significantly
higher, above 10 g·L−1 for discharges greater than 50 m3·s−1.
For studying the basin responses in terms of discharges and SPM during the hydrological year, it was considered useful to regroup the instantaneous values pursuant to the different seasons (Table 6).
Table 6. Seasonal models connecting the instantaneous flows with the concentration of matters in
instant suspension.
STATION Correlation Autumn Winter Spring Summer W. El Abtal Model Q = 0.506C
1.092 Q = 1.940C0.719 Q = 0.889C0.969 Q = 0.483 C0.891 Coefficient R2 0.60 0.20 0.59 0.37
S.A.E.K. Djilali Model Q = 0.031C
1.137 Q = 0.125C0.561 Q = 0.024C1.12 Q= 0.161C0.584 Coefficient R2 0.60 0.20 0.63 0.30 A. Hamara Model Q = 1.038C 0.854 Q = 1.715 8C0.458 Q = 0.893C0.867 Q = 1.292C0.655 Coefficient R2 0.51 0.34 0.55 0.38 Takhmert Model Q =0.8C 1.022 Q = 1.78 8C0.621 Q = 1.13C0.934 Q = 0.842C0.845 Coefficient R2 0.63 0.43 0.66 0.44
S.A.B. Amar Model Q = 0.799C
0.733 Q = 2.437C0.167 Q = 0.67C0.712 Q = 0.277C0.896 Coefficient R2 0.56 0.21 0,64 0.44
The analysis in Figure 9 shows that autumn and spring are distinguished by their strong liquid discharges generating an important flow of SPM. The maximum solid flow is of 42,365 kg·s−1,
achieved in September 1994, resulting from a liquid discharge of more than 351 m3·s−1.
Figure 9. Seasonal variations (summer: June, July and August; autumn: September, October,
November; winter: December, January, February; and spring: March, April, May) of the instantaneous values of discharges depending on the concentrations of suspended particles matters (SPM) (Station Wadi El Abtal). (a) Summer; (b) Autumn; (c) Spring; (d) Winter.
In contrast, during winter and summer, we note a net regression of liquid discharge that do no longer exceed 84 m3·s−1 in winter and 38 m3·s−1 in summer. However, we note a few specificities for
each season.
For autumn, the heavy charge is explained by the fact that rain often falls on a dried up soil and badly protected by vegetation [68].
The basin of Wadi Mina is bare in autumn and, after a long warm period, the autumn floods imply systematically suspended solids inputs in maximum number and this phenomenon is relatively reduced for the following season, in winter or when the lands forming the basin are saturated and the vegetation cover is developed [68].
On the one hand, the torrential and aggressive rains are the ones occurring in October and November and they tear off major quantities of SPM and, on the other hand, the weak vegetation cover of the preceding season (summer) favors the destruction of the soil aggregates that shall be subsequently transported in suspension by the watercourse.
In winter, the erosion of the bed and the banks along the watercourse becomes important because of the increase of discharges in Wadi, and as well runoffs are generated by rainy sequences which are relatively abundant but of weak intensity (0.4 mm) in Takhmert and (29.1 mm) in Ain Hamara. They find a loose soil with vegetation cover that confers soil roughness and favors water retention [128].
In winter, the runoffs remain important, although this season is a little rainy and cold transition period with a succession of freezing and thawing which is caused essentially by the important water reserves, stored in the soil, following the autumn rains.
In spring, the erosion of the bed and the banks along the watercourse becomes important as this is essentially related to the increase discharges in the Wadi and the herbaceous cover and cultures that considerably reduce the mobilization of thin materials on the slopes. We can add as well the reduction of rains of heavy intensity compared with the winter season.
At the end of spring, the soil is humid and the vegetation cover is well developed. On the slopes, the thin soils saturate rapidly and develop important erosion in the gully and mass movement [129,130]. In addition, in this period, the floods have an important role in the production of sediments in the drainage networks. In addition, Hallouz et al. [67], in their study on the Wadi Mina basin, found that the maximum values of the solid inputs, for all the sub-basins, are observed at the beginning of autumn and at the end of the spring, this variability is explained on the one hand by the variation of the vegetal cover (bare soils) during the year and the erosive nature of the autumn rains (high intensities) and on the other hand by the releases made by the Bakhadda Dam, so these two factors allow the first autumn floods to transport large quantities of sediment after a long dry season characterized by high temperatures and the destruction of soil aggregates. Rainfall erosivity is the potential ability of rainfall to cause soil loss [131]. The rainfall erosivity index represents the climate influence on water related soil erosion [132]. Rainfall erosivity is the impact of the kinetic energy of raindrops on soil. Higher velocity and larger size of the raindrops results in higher kinetic energy and higher soil loss. According to Yu [132], most soil erosion researchers and soil conservationists recognize the positive correlation between erosivity and rainfall intensity [133].
3.4. Annual Inputs
The calculation of the sediment average specific load (Ds) in tons is given by the product sum of three variables Q (m3·s−1), C (g·L−1) and T (duration in seconds). Table 7 resumes the average specific
exportations in tons per km2 and per year for each sub-basin.
Table 7. Results of the calculation of sediment charge in tons.
Basins W. Mina (I + II) W. Haddad W. Mina W. Abd W. Mina Amont
Station name (W. Abtal +
S.A. Djilali) S. Aek Djilali W. El Abtal A. Hamara Takhmert S. A. B. Amar Average specific load
(t·km−2·year−1) 860 965 762 502 220 239
Period of observation 1969/2010 1969/2010 1969/2010 1969/2010 1969/2007 1969/2007
The average specific sediment discharge of Wadi Mina at the Sidi M’Hamed Ben Aouda Dam is 860 t·km−2·year−1 (the sum of degradations measured at the stations Wadi El Abtal and Sidi
Abdelkader El Djilali to which is added the load produced on the surface of the transitional basin VI). We note that this value is very moderated in relation to those published for other basins in the region, such as the basin of Wadi Mazafran (Algerian coastal basins), Wadi Isser (Lakhdaria), Wadi Sebdou
(basin Tafna), Wadi Agrioum (east Algerian), whose specific degradations amount to 1610, 2300 and 1120 t·km−2·year−1 [134,135] and 5000 t·km−2·year−1 [136]. Meddi [68] already reported that Wadi
Haddad à Sidi Abdelkader El Djilali has a high average specific load in relation to other catchment areas (Ds = 965 t·km−2·year−1), which means that this sub-basin continues to be the busiest supplier of
sediments towards the dam. This catchment area is the most favorable for the runoff from the point of view of topography and vegetation cover [68]. It is characterized by a discontinuous and poor vegetation cover during warm season. The concentration of floods after the warm season in October and sometimes in May, with strong intensities, would generate strong concentrations in sediments during these months. This context favorable to the runoff and, consequently, to the solid transport explains this serious degradation of soils for this catchment area, in addition to its geological nature which is very favorable as well to this event (marl) [68].
The lowest degradation values are observed for Wadi Abd at Takhmert (220 t·km−2·year−1) and
Wadi Mina upstream of Sidi Ali Ben Amar (239 t·km−2·year−1). These values can well be explained by
the less favorable nature of the runoff of basins which are characterized by floods of average or light power [68].
3.5. Where from Does Originate the Sediments of the Dam?
Thus, the results of bathymetric surveys performed at the level of the SMBA Dam indicated that the capacity loss of the dam since its commissioning in 1978 and until 2004 is evaluated at 82 × 106 m3
(Figure 10), equivalent to a third (1/3) of its initial capacity. Remini and Bensafia [64] estimated that, in 2010, the SMBA Dam registers a sediment volume equal to 109 × 106 m3, namely an annual average
loss of about 3.5 × 10⁶ m3·year−1, equivalent to a sediment load equal to 5.6 106 t·year−1 that deposits
in the impoundment of the dam (considering an average density of the sediment of 1.6 t·m−3).
Initial water volume = 235 × 106 m3 Water volume = 153 × 106 m3
(1978–1985) (1985–2004) Loss = 9.42 × 10⁶ m3 Loss = 71.87 × 10⁶ m3
Figure 10. Evolution of the basin morphology and the surface in free water of the Sidi M’Hamed
Benaouda Dam [14]. (a) Initial water volume (1978-1985); (b) Water volume (1985–2004).
Indeed, according to bathymetric surveys conducted in 1978, 1985, 2000 and 2004, the SMBA Dam has lost much of its capacity (Figure 11), from 1978 to 1985 annual loss estimated to 1.35 million m3, from 1985 to 2000, an annual loss of about 4.41 million m3 and from 2000 to 2004 an annual loss
was estimated to 1.42 × 10⁶ m3, over all these periods of bathymetric measurements, the highest loss
rate was observed between 1985 and 2000, which is probably due to exceptional rains that hit the region during this period, thus in October 1993: “Twenty minutes of rain do 16 dead and a dozen of missing persons in Relizane” [137].
It is important to note that at the start of the dam exploitation, the reservoir filling with fine particles is carried out linearly according to weather conditions. Starting with 2000, there was a decrease in siltation, mainly caused by the dam exploitation mode (periodic shelving of fine particles by the outlet gates) [14].
Figure 11. Evolution of the accumulated loss of water from the Sidi M’Hamed Benaouda Dam [14]. Conversely, the calculations made by the concentration measures for the basin of Wadi Mina at the level of the station of Wadi El Abtal and Wadi Haddad, at the Sidi AEK Djilali station level, and which control a surface of 5856 km2, generated a load equal to 5.2 × 10⁶ t·year−1 (Table 8). The
difference of 400,000 t·year−1 corresponds to the sedimentary inputs of the micro-basin surrounding
the impoundment (192 km2) and the autochthon sedimentation in the impoundment, without being
able to establish the parts of each source. To elaborate further on this topic, we should deploy specific measures as those presented by Maleval [138]. This difference of 400,000 t·year−1 corresponds to a
specific degradation of 21 t·ha−1·year−1, namely 2.4 times more than the specific degradation for the
entire basin of 5856 km2 (Table 8). This difference can be explained, on the one hand, by potential
autochthon sedimentation, but which is not quantifiable for the moment, and, on the other side, by a specific degradation intrinsically higher because of geomorphology reasons, as the eroded products on the slopes arrive very rapidly at the impoundment, without the existence of an intermediary decantation area. Thus, this specific degradation value of 21 t·ha−1·year−1 is even higher than the
“potential” erosion value of about 12 t·year−1, calculated by Toumi et al. [66] for the entire basin, based
on the USLE equation.
Table 8. Sedimentary load and specific degradation in the basin of Wadi Mina.
Designation SMBA Dam
Sedimentary load deposited in the dam impoundment (bathymetry). 5.6 × 10⁶ t·year−1 Sedimentary load by concentration measure on Wadi Haddad and Wadi Mina upstream. 5.2 × 10⁶ t·year−1 Sedimentary load coming from the dam slopes. 4 × 10⁵ t·year−1 Specific degradation (dam slopes). 21 t·ha−1·year−1 Specific degradation (Stations: W.El Abtal + Sidi Abdelkader Djilali). 8.6 t·ha−1·year−1
For concluding this part, we can note that, in accordance with the digits in Table 8, over 90% of sediments of the SMBA Dam appears to come from the contributions of the Wadi Haddad and Wadi Mina upstream of the dam.
Thus, Touaibia [45] showed that the USLE equation allowed to map each parameter of this equation for the entire basin of Wadi Mina and superposition of layers (for each parameter) in a GIS and resulted in values of degradation in t·ha−1·year−1 (Table 9).
Indeed, the results of the concentration measures as well as those found by the erosive potentials equation (USLE) show that the basin upstream of the SMBA (1B) Dam (Figure 12) presents an important erosive risk, because it produces a specific degradation equal to 13.36 t·ha−1·year−1 and 19.64
t·ha−1·year−1, respectively, this because of the predominance of tertiary marls in this part of the basin
from 12% to 30%, generating important corrosive risks with occurrence of the signs caused by diffuse streaming, without forgetting the sparse vegetation cover [139]. In addition, the specific degradations vary from 11.54 to 12.64 t·ha−1·year−1 at the basin level (5B) upstream of the Bakhadda Dam and,
respectively, the basin of Wadi Haddad (2B), calculated by the USLE equation [66] against 2.39 to 9.64 t·ha−1·year−1 on the same sub-basins, these values remaining high, considering that the basin of Wadi
Haddad presents a lithology constituted by the Continental Quaternary (this formation is represented by alluvia, regs and terraces), the Continental Pliocene (represented by lacustrine limestone) and the marine Lower Miocene (represented by a marly formation). The basin vegetation is formed essentially of scrubland, representing almost 30% from the entire basin (degraded forest). The vegetation is overgrazed and is discontinuous in the space [68] and the basin (5B) upstream of the Bakhadda Dam is dominated by limestone and dolomites alternating with marls and an average dense vegetation and slopes varying from 5% to 12% that present weak erosion risks, but can be strong with the presence of agricultural activities, mainly grain farming that dominates soil occupation [139].
The values of specific degradation are low in the southwest part of the basin (basin of Wadi El Abd) and thus the fields in this regional are quasi-flat (slope lower than 10%) [139], and thus the specific degradations are equal to 3.86 t·ha−1·year−1 at the level of the Takhmert station and 8.82
t·ha−1·year−1 at the Ain Hamara station [66], in accordance with the calculations generated using the
USLE equation, and varying from 2.20 t·ha−1·year−1 at the level of the Takhmert station and 5.02
t·ha−1·year−1 at the Ain Hamara station (Table 9), this basin marking the existence of marls which are
friable rocks, thus a favorable factor for degradation and an insufficiency of forest vegetation and the surfaces are often used for pasture [128]. The climatic conditions semiarid are associated with a high degree of rainfall irregularity with average precipitations of 266 mm in Ain Hamara and 238 mm in Takhmert.
The maxim value of losses in soil is registered at the level of the dam basin (400,000 t·ha−1), this
value representing the sum of the solid transport by suspension and that of the bed load which is estimated between 15% and 25% of the suspension [140], namely a loss in soil equal to 392,157 t·ha−1
and by bed load equal to 78,431 t·ha−1, estimating a load transport equal to 20% of the suspension.
Compared to the found values, we observe that the basin upstream of the SMBA Dam (1B) is the greatest producer of sediments towards the dam because it shows a specific degradation equal to 13.36 t·ha−1·year−1, value found after the elimination of release of water from the Bekhadda Dam,
estimated at 1.32 t·ha−1·year−1 on average, considering that this dam registers an average loss
amounting to 0.27 × 10⁶ m3 since its launching in 1936; this result corroborates with that found by
Touaibia [45] as well as with the works of GTZ [141], because this area is dominated by a marly lithological formation situated often on the piedmonts of a slope of 10 to 20% (Table 9), favouring soil erosion.
Table 9. Values of specific degradation per sub-basin.
Sub-basin Wadi Name
Specific Degradation (t·ha−1·year−1)
USLE Equation Concentrations Measure Difference (USLE, Concentrations Measures) 1B 19.64 13.36 6.28/32% 5B Wadi Mina 11.54 2.39 9.15/79% 6B / 21 / 2B Wadi Haddad 12.64 9.64 3.00/24% 3B 8.82 5.02 3.80/43% 4B Wadi El Abd 3.86 2.20 1.66/43%
In addition, the other sub-basins record specific degradation varying from 2.2 to 9.64 t·ha−1·year−1, and these values are close to those found by [66] using the USLE equation, except for the
basin of Wadi Mina upstream at the level of the station of Sidi Ali Ben Amar, where the calculated value using the USLE equation is 4.83 times higher than the one calculated by the direct concentration measures (Figure 12). The value of the basin 5B using the concentrations measure considers the solids
quantities sedimented in the dam impoundment in contrast to that generated by the USLE equation which does not consider the volumes of sediments caught in the Bakhadda dam but it only models potential soil erosion taking place. This calculation approach generated the difference between the estimated values by the two techniques (Table 9).
Figure 12. Specific degradation per sub-basin.
In fact, we only measured the sediment that actually reached the stream system, so the difference between what is measured in the current and what is predicted by USLE is largely due to the deposits of halfway that do not reach the watercourse. This does not prevent lake like Bakhadda dam also playing a role of intermediate trapping on the watercourse.
Soil erosion is such a highly variable process that one should avoid establishing rules for larger catchments without measuring at least a few of the processes taking place directly. Sediment concentration may point towards the real processes, but they are still an indirect value for material eroded. In this study, the purpose of the comparison of the different sources of information that we use is to evaluate the validity of the observed and modelled values: are the fluxes measured in the rivers (SPM) compatible with the rates of erosivity provided by USLE? Does the sedimentation rate in the dam reflect the orders of magnitude of SPM observed in streams? Thus, sub-basins can be used to locate a potential source of sediment in small sub-basins close to the reservoir, for which the erosivity rate could be higher, and/or the proximity to the reservoir allows for greater fraction of SPM carried to reach the reservoir.
The analysis of the photo of the slopes of the dam basin (Figure 13) indicates a favorable environment (inclined slopes and formed of slightly resistant soil, little or no vegetation cover, aggressive climate and human activities), for causing important inputs in sediments that shall deposit directly in the lake. This would explain largely the very serious specific degradation calculated for the small catchment area downstream with 192 km2 that surrounds the dam (6B) after the last station
of hydrologic measurement, obtained by the difference between the equivalent in SPM, deducted from the dam silt volume and the concentration measures in SPM at the upstream hydrological station.
Indeed, the average annual streaming can reach 15–30%, varying with the years and depending on the fallow land silting by weeds between two weedings, but as well with the distribution of showers depending on the agricultural works and the prior humidity of the soil [142]. Average showers falling on the bare, saturated and crusted surface soil can cause a streaming exceeding 60– 80%. Here lies the greatest risk for the dams silting because, gathering in gullies and Wadis, the floods peaks move very important quantities of materials [142].
We consider that the matters in suspension, measured at the catchment area outlet, do not reflect the current dynamics of all the slopes, but they reflect the transport capacity of streaming and runoff waters in the gullies. There exists a stock of fine sediments which is progressively evacuated towards
![Figure 4. Diagram for class discrimination used in the DSS (according to [94]).](https://thumb-eu.123doks.com/thumbv2/123doknet/13741737.437173/8.892.251.642.652.993/figure-diagram-class-discrimination-used-dss-according.webp)