HAL Id: hal-00827924
https://hal-polytechnique.archives-ouvertes.fr/hal-00827924
Submitted on 15 May 2014
HAL is a multi-disciplinary open access
archive for the deposit and dissemination of
sci-entific research documents, whether they are
pub-lished or not. The documents may come from
teaching and research institutions in France or
abroad, or from public or private research centers.
L’archive ouverte pluridisciplinaire HAL, est
destinée au dépôt et à la diffusion de documents
scientifiques de niveau recherche, publiés ou non,
émanant des établissements d’enseignement et de
recherche français ou étrangers, des laboratoires
publics ou privés.
Calculation of the circular dichroism spectra of carbon
monoxy- and deoxy myoglobin: interpretation of a
time-resolved circular dichroism experiment.
Thibault Dartigalongue, François Hache
To cite this version:
Thibault Dartigalongue, François Hache.
Calculation of the circular dichroism spectra of
car-bon monoxy- and deoxy myoglobin: interpretation of a time-resolved circular dichroism
experi-ment..
Journal of Chemical Physics, American Institute of Physics, 2005, 123 (18), pp.184901.
�10.1063/1.2041467�. �hal-00827924�
Calculation of the circular dichroism spectra of carbon
monoxy- and deoxy myoglobin: Interpretation
of a time-resolved circular dichroism experiment
Thibault Dartigalongue and François Hachea兲
Laboratoire d’Optique et Biosciences-Centre National de la Recherche Scientifique (CNRS)-Institute National de la Sante et de la Recherche Medicale (INSERM), Ecole Polytechnique,
91128 Palaiseau Cedex, France
共Received 20 June 2005; accepted 28 July 2005; published online 4 November 2005兲
A calculation of the circular dichroism共CD兲 spectra of carbon monoxy- and deoxy myoglobin is carried out in relation with a time-resolved CD experiment. The calculation is based on the polarizability theory and the parameters are adjusted to fit the experimental absorption and CD spectra. By performing the calculation for intermediate configurations of the protein, we are able to propose an explanation of the CD structure observed on a sub-100 ps time scale. The role of the proximal histidine is, in particular, clearly demonstrated in the first step of the myoglobin relaxation from its liganded to it deliganded form. © 2005 American Institute of Physics.
关DOI:10.1063/1.2041467兴
I. INTRODUCTION
Conformational changes that occur in carbon monoxy myoglobin 共MbCO兲 are known to play an important physi-ological role as a model of the trigger of the allosteric trans-formation which takes place in hemoglobin. Upon ligand dis-sociation, the heme undergoes an ultrafast doming which propagates along the whole protein. Such conformational changes involve many different time scales and much work is devoted to this problem. In order to investigate ultrafast conformational changes, we have set up a time-resolved cir-cular dichroism experiment. Circir-cular dichroism 共CD: differ-ence in absorption for a left and a right polarized light兲 is an optical characteristic of chiral molecules. In large molecules such as myoglobin, it relies on the spatial arrangement of the various chromophores. It therefore joins the advantages of optical techniques 共among which is an unprecedented time resolution兲 with the ability to probe the response of the mol-ecules on a global scale, contrarly to the usual techniques such as absorption or Raman scattering which are generally sensitive to local features. Time-resolved CD has been pro-posed and demonstrated in the past,1,2 but no convincing results were obtained, in particular, because the time resolu-tion proved to be not good enough to yield interesting fea-tures.
Time-resolved CD experiments, however, suffer from a serious drawback which is the difficulty of interpretation. Indeed, CD being a nonlocal probe, it relies on many param-eters because CD at a particular transition can be influenced by other transitions situated at distant part of the molecules. Furthermore, because CD is a signed quantity, large indi-vidual effects very often cancel each other out resulting in weak net signals.
The purpose of this article is to overcome these
limita-tions and to present a model calculation of CD in myoglobin permitting the interpretation of experimental results that we have obtained recently.3In these experiments, a CD transient lasting about 100 ps was observed after photolysis of MbCO. Here, we present a thorough analysis of the origin of the CD in MbCO and in the deoxyform 共Mb兲 which allows us to propose a mechanism responsible for this CD change.
The paper is organized as follows. In the next section, we summarize our main experimental results. In Sec. III, we present the model calculation we have used. This calculation is based on the polarizability theory which is well fitted for CD originating in the coupling of different chromophores in a large protein. This calculation is first applied to the steady-state geometries of the initial共MbCO兲 and final 共Mb兲 states. Then, we simulate several intermediate configurations of the protein and calculate the corresponding CD spectra in order to single out the important parameters. Finally, in view of these calculations, we are able to propose an interpretation of our experimental results which is discussed in Sec. V.
II. EXPERIMENT A. Experimental details
The time-resolved experiment is carried out on a 230M MbCO solution prepared by dissolving commercial horse heart metmyoglobin共Sigma兲 in a buffer 共100 mM tris-HCl, pH = 8.0兲. The solution is placed in a 1 mm path-length silica cell. The experimental setup is based on a classical pump-probe experiment. The pump is directly obtained after frequency doubling a 1 kHz titanium-sapphire output. The pump pulses have an energy of about 300 nJ and their dura-tion is about 250 fs. 15%–20% of the MbCO molecules are photolyzed by the pump. The sample is continuously moved so that a fresh sample is available at each laser shot. The probe pulses, obtained by continuum generation in a sapphire plate, are tunable from 410 to 500 nm. These pulses are sent a兲Electronic mail: francois.hache@polytechnique.fr
0021-9606/2005/123共18兲/184901/9/$22.50 123, 184901-1 © 2005 American Institute of Physics
through the sample after a time delay and the transmitted energy is measured by a photomultiplier tube. In order to access the CD, the probe polarization is modulated alter-nately left and right circular with a longitudinal Pockels cell on which we apply a 120 Hz square voltage. Due to CD, this polarization modulation translates into a⬃10−3transmission modulation which is detected by a lock-in amplifier synchro-nized with the Pockels cell. This setup allows us to simulta-neously measure the transmission and the CD of our sample as a function of the delay between the pump and the probe. Even though the principle is straightforward, this experiment demands a very fine control of the beam polarization in order to avoid artifacts.4The Pockels cell is very carefully aligned through a detailed procedure.5 Furthermore, using various configurations for the pump polarization allows artifacts to be further reduced.
B. Results
Time-resolved CD was first obtained on a nanosecond time scale for probe wavelengths spanning the Soret band.3 The striking feature of these experiments was that, on this time scale, no dynamics could be observed in the CD signal: the deoxy-myoglobin CD spectrum was immediately recov-ered, independently of the time delay. At wavelengths corre-sponding to the MbCO peak, we could only observe a down-ward step whereas at wavelengths corresponding to Mb peak, only an upward step was obtained. However, focusing on the very first times allowed us to observe a nice feature occurring in the CD spectrum on a 100 ps time scale. The results for a probe wavelength of 422 nm 共close to the MbCO peak兲 and of 440 nm 共close to the Mb peak兲 are dis-played in Fig. 1. The peak at zero delay is due to the pump-probe overlap and does not yield conformational informa-tion. This peak corresponds to the pump-probe cross correlation and gives an estimate of our time resolution 共650 fs兲. At positive delays, one gets a large CD drop on a 10 ps time scale, followed by a relaxation toward the Mb steady state in 100 ps. Note that a similar trend was obtained for a wavelength of 355 nm in Ref. 2. In this article, the time
resolution was not good enough to see the decrease, but an increase was observed on a 300 ps time scale, in qualitative agreement with our work.
It is important to note at this point that this 100 ps time scale allows us to rule out possible artifacts and to confi-dently assign this CD change to conformational issues. Purely electronic changes that occur in the heme after pho-tolysis are very short lived6and appear in our experiment as intantaneous. Temperature rise due to the absorption of en-ergetic photons is not expected to perturb much electronic transitions and furthermore are known to be over in 20 ps.7 Finally, pump-induced anisotropy which could deeply influ-ence the CD would depend on the rotational diffusion time of myoglobin, measured to be 35 ns.8 This last point will be further discussed later on in view of our calculations.
Our experiment therefore discloses an ultrarapid confor-mational change which yields information on the very first steps of the allosteric mechanism in myoglobin. The follow-ing section of the article is devoted to presentfollow-ing a model calculation of the CD which allows us to give an interpreta-tion of this conformainterpreta-tional change.
III. CALCULATION OF THE CIRCULAR DICHROISM SPECTRA
A. Outline of the calculation
The origin of the circular dichroism in the Soret band of carbon monoxy myoglobin has been identified by Woody and co-workers as principally coming from the coupling of the heme transitions with the −* transitions of the
sur-rounding aromatic residues.9,10We therefore chose to utilize the classical calculation introduced by DeVoe11 and further extended by Applequist.12 In particular, Applequist’s treat-ment is very well fitted to the calculation of the chiroptical response of molecules consisting of several polarizable units arranged in a fixed position with respect to each other. The optical activity of such molecules originates in the interac-tion through dipole-dipole coupling of the different units.
Applequist’s theory relies on the calculation of the elec-tronic normal modes of the molecules.12When expressed in the normal-mode basis, absorption and circular dichroism can be obtained readily. The main point is therefore the de-termination of these normal modes which implies a matrix diagonalization, a straightforward procedure 共which can, however, be time consuming for large molecules兲. This cal-culation technique has the advantage that, although it is con-siderably simpler that most of the existing theories based on quantum chemistry,13 it nevertheless gives a very good de-scription of CD spectra. In the case of myoglobin where the polarizable groups are very close, a point-charge description would be better and the CD spectra calculated with this simple technique will necessary be somewhat qualitative but anyway sufficient to obtain valuble information on the con-formational issues under study.
We give here a brief account of the principles of the calculation. Details can be found in Refs. 12 and 14. Each molecule is supposed to be composed of N polarizable units, indexed by subscript i. Each unit i is in turn composed of several oscillators, indexed by subscript s. Introducing uisthe
FIG. 1. Circular dichroism for=422 nm 共close to the MbCO peak兲 and =440 nm 共close to the Mb peak兲 as a function of the pump-probe delay. The CD curves are fitted by two exponential functions共7 and 43 psec兲. The inset shows the corresponding normalized transmission curves.
184901-2 T. Dartigalongue and F. Hache J. Chem. Phys. 123, 184901共2005兲
unit vector describing the direction of the polarization of oscillator is, the polarizability tensor of unit i is
␣=i=
兺
s=1 piaisuគisuគis. 共3.1兲
The coefficients ais are complex functions of the light frequency and are assigned a Lorentzian form,
ais= cis is 2 −2− i⌫is , 共3.2兲
isbeing the frequency of the oscillator and⌫isits width. cis is a coefficient proportional to the oscillator strength 共cis = 3e2f
is/ 42m兲.
Let us now consider the dipole momentគis induced on oscillator is when one applies an electric field Eគ . Actually, the local electric field acting on the oscillator is is
Eគloc共uis兲 = Eគ −
兺
j⫽i兺
tT=ij.គjt, 共3.3兲
where the last term accounts for the dipolar field generated by the other units jt, with T= the symmetric dipole-dipole interaction tensor,
T=ij= rij−3I= − 3r−5ijrគijrគij. 共3.4兲 Interactions between oscillators pertaining to the same unit are taken into account in the description of isolated groups and the matrix T= only deals with intergroup cou-plings. It is therefore sufficient to index T= by i, j 共without taking the s , t subscripts into account兲. From Eqs. 共3.1兲 and 共3.3兲, one can introduce a symmetric interaction matrix A=,
A=គ = Eគ. 共3.5兲
Rows and columns of A= are designated by the double indices is and jt, Ais,jt=
再
ais −1␦ st 共i = j兲 uគis. T=ij. uគjt 共i ⫽ j兲.冎
共3.6兲 Diagonalization of A= yields the normal modes of the ensemble of oscillators. Each normal mode is depicted by an eigenvector tគ共n兲whose elements tis共n兲correspond to the contri-bution of the oscillator is. With the help of these normal modes, one obtains quite easily the matrix elements of B= = B=−1, the inverse of matrix A= :12Bis,jt=
兺
n=1 p tis共n兲t共n兲jt 共2n−2+ i⌫n兲 共n 2 −2兲2+2⌫n 2 . 共3.7兲In this expression, contrary to Applequist’s calculation, we do not try to connect the ⌫n’s with the oscillator widths ⌫is but rather consider them as phenomenological param-eters. This feature seems reasonable as bandwidths are intro-duced to take into account the coupling of the transition with the environment and are therefore better defined for a normal mode than for an isolated transition. Besides this fundamen-tal reason, it is also consistent with the current practice which consists to extract the ⌫n’s from the width of the ex-perimental absorption spectra. This matrix B= allows the ab-sorption and the CD spectra to be expressed as
= 10 ln 10 e2N A 20mcn=1
兺
p 2⌫ n 共n 2 −2兲2+2⌫n 2f共n兲, 共3.8兲 ⌬ = 80 3 ln 10 NA 0c2ប兺
n=1 p 3⌫ n 共n 2 −2兲2+2⌫n 2R共n兲, 共3.9兲where e and m are the electron charge and mass, respec-tively, c the light velocity, and NAthe Avogadro number, with SI units except for and ⌬ which are expressed in the usual M−1cm−1; the refractive index is supposed to be equal to 1.
In these expressions, we have introduced the oscillator and rotational strengths for the nth normal mode which can be calculated as f共n兲=4 2m 3e2 is,jt
兺
tis共n兲t共n兲jt uគis. uគjt 共3.10兲 and R共n兲= 2ប 2 is,jt兺
tis 共n兲t jt 共n兲rគ ij.关uគis⫻ uគjt兴. 共3.11兲In the following, we will be interested in adjusting cal-culational parameters to experimental curves. When express-ing the frequencies in eV and the rotational strengths in Debye-Bohr magneton共DBM兲, Eqs. 共3.8兲 and 共3.9兲 read
= 18200
兺
n=1 p 2⌫ n 共n 2 −2兲2+2⌫n 2f共n兲 共M −1cm−1兲, 共3.12兲 ⌬ = 2.6兺
n=1 p 3⌫ n 共n 2 −2兲2+2⌫n 2R共n兲 共M−1cm−1兲. 共3.13兲The interesting feature of this calculation is that it allows the role of each component of the total rotational strength to be determined: the contribution of the coupling between groups i and j to the rotational strength of the nth normal mode is given by R共n兲共i, j兲 = 2ប 2
兺
s,t tis 共n兲t jt 共n兲rគ ij.关uគis⫻ uគjt兴. 共3.14兲 B. Steady-state CD spectraMyoglobin is a 153 amino acid protein which is com-posed of eight␣helices, labeled A–H. These helices form a rather rigid structure which encompasses the so-called heme pocket. The heme cofactor is linked to the F helix through a bond between its central iron atom and the “proximal histi-dine”共His93兲. Ligands such as O2or CO can reversibly bind
to the iron atom. On the other side of the heme pocket lies the “distal histidine”共His64兲 共see Fig. 2兲. Steady-state struc-tures of the protein in its liganded or deliganded forms have been measured by x-ray diffraction.15 These structures are available through the Protein Data Bank共MbCO: 1A6G, Mb: 1A6N兲. They are the starting point of our calculations.
Absorption and CD spectra of MbCO and Mb were mea-sured with a Jobin-Yvon CD6 CD-spectrometer. The spectra This article is copyrighted as indicated in the article. Reuse of AIP content is subject to the terms at: http://scitation.aip.org/termsconditions. Downloaded to IP:
are displayed in Fig. 3. Our first task is to utilize our calcu-lations to reproduce the experimental steady-state spectra.
1. Choice of the parameters
To reproduce the CD of MbCO, we have considered the coupling of the heme with 14 aromatic residues close enough to interact efficiently. On top of the 12 residues already con-sidered by Hsu and Woody,9 we have also introduced two tryptophans which are expected to give nonnegligible contributions16 共see Tables II, III, and Fig. 2兲. Fitting of ex-perimental curves with Eqs. 共3.12兲 and 共3.13兲 amounts to taking the protein geometry and calculating the normal modes for these 15 subunits共Heme+aromatic residues兲. Be-side the geometry given by the x-ray structures, this calcula-tion requires knowledge of several parameters for the aro-matic side chains, on the one hand, and for the heme transitions, on the other hand共see Fig. 2兲.
a. Aromatic residues. The coupling between polarizable units is more efficient if the transition energies are closer. The Soret band of the heme that we consider being in the visible, major contributions is expected from the low-energy electronic bands of the surrounding aromatic residues. Pa-rameters describing these transitions were taken in the
litera-ture. In particular, an ab initio study of phenylalanine, ty-rosine, and tryptophan was published recently17and provided us with the required information. Things are, however, more complicated for histidine which plays a crucial role in the calculation given that the two closest amino acids from the heme are histidines. Complete information including the di-rection of the transition moments are not available and we have utilized Woody’s data.9We have also tried other CNDO results.18Given the semiquantitative level of our calculation, the precise choice for histidine proved not to be determining. Altogether, for the 14 aromatic residues, a total of 46 transi-tions was considered. Summary of the parameters is given in Table I.
b. Heme. Considering MbCO, the Soret band can be reproduced with a unique transition at 2.94 eV which in re-ality corresponds to two heme transitions whose degeneracy is lifted by the coupling with the surrounding residues. We therefore adjusted the heme transition frequencies and oscil-lator strengths so as to reproduce correctly the absorption spectrum共see Table I兲. After coupling with the aromatic resi-dues, the total Soret oscillator strength amounts to 1.35, in agreement with the known value.19 These same parameters are then used to fit the CD spectrum. Bandwidths for the two transitions are also adjusted through these fitting procedures. The results of these fitting procedures are displayed in Fig. 3. The overall agreement is remarkable. In particular, Eqs. 共3.12兲 and 共3.13兲 were readily used with no other adjustment than the oscillator strength of the heme transitions and the bandwidths of the normal modes to obtain the correct mag-nitude for both the absorption and the CD spectra.
The case of Mb is more complex as the heme absorption band is much broader and asymmetric than in MbCO. Two FIG. 2. 共a兲 Sketch of the main aminoacids involved in the CD signal. The
residues yielding a positive共resp. negative兲 rotational strength are drawn in blue共resp. red兲. The proximal histidine 共His93兲 is singled out due to its particular role: it induces the lifting of the degeneracy of the heme transi-tions but contributes very little to the rotational strength. His36, His97, Phe46, and Trp7 which are considered in the calculation are not represented because of their weak contribution to the rotational strength.共b兲 Sketch of the residues with their coordinate axes.
FIG. 3. Absorption spectra for共a兲 MbCO and 共b兲 Mb; CD spectra for 共c兲 MbCO and共d兲 Mb. The red solid lines are experimental spectra and the black dashed lines are calculated ones.
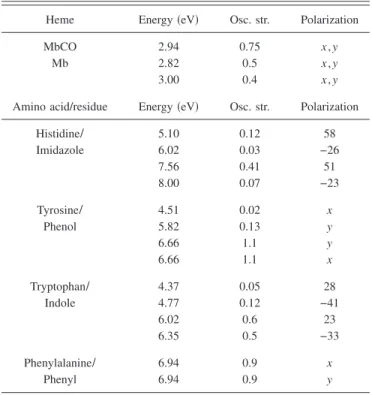
TABLE I. Energy, oscillator strength, and polarization of the electronic transitions of the aromatic pending groups. The polarization is expressed as the angle 共in degrees兲 between the transition moment and the x axis 共see Fig. 2兲.
Heme Energy共eV兲 Osc. str. Polarization MbCO 2.94 0.75 x , y
Mb 2.82 0.5 x , y
3.00 0.4 x , y
Amino acid/residue Energy共eV兲 Osc. str. Polarization
Histidine” 5.10 0.12 58 Imidazole 6.02 0.03 −26 7.56 0.41 51 8.00 0.07 −23 Tyrosine” 4.51 0.02 x Phenol 5.82 0.13 y 6.66 1.1 y 6.66 1.1 x Tryptophan” 4.37 0.05 28 Indole 4.77 0.12 −41 6.02 0.6 23 6.35 0.5 −33 Phenylalanine” 6.94 0.9 x Phenyl 6.94 0.9 y
184901-4 T. Dartigalongue and F. Hache J. Chem. Phys. 123, 184901共2005兲
features can explain this: the onset of the N bands and the vibronic coupling.20To account for this complex structure in a simple manner, we have considered two pairs of degenerate transitions for the heme in its deoxy state. The fitting proce-dures were the same as for MbCO by using Eqs. 共3.12兲 and 共3.13兲. As the agreement is less good than for MbCO, we focus on the fit of the CD spectrum. The absorption spectrum is not very satisfactorily reproduced, indicating the inad-equacy to account for the complex structure of the Mb ab-sorption band. However, the following discussion being de-voted to the CD spectra evolution, we think that this empirical fitting will be reliable enough.
2. MbCO spectrum
Let us first comment on the MbCO CD spectrum. The Soret band originates in the heme B bands which give birth to two normal modes. Analyzing these normal modes in de-tail, one obtains that they principally originate in the cou-pling of the heme with the proximal histidine. Furthermore, as this coupling is weak, the eigenfunctions closely resemble those of the heme with occurrence of a small fraction of the other states. The principal effect of this coupling is the lifting of the degenracy. The two degenerate heme transitions do not couple the same way with the histidine because the imida-zole plane is oriented almost along the heme x direction共Fig. 2兲. The heme transition oriented along this x direction there-fore couples more efficiently with the histidine than the one oriented along the y direction. We can now examine the ro-tational strength for these two normal modes and we obtain +0.9 and −0.5 DBM. These numbers are in good agreement with the experimental value of 0.5 DBM measured for the Soret band. Because the two transitions are very close, the total rotational strength roughly results from the addition of these two values which yields 0.4 DBM. The occurrence of two CD bands of opposite signs explains the shape of the CD spectrum, which is narrower than the absorption one. The strong positive peak comes from the positive contribution whereas the negative contribution results in a narrowing of the peak and the onset of a small negative dip on the long-wavelength side. Note that correct fit of the CD spectrum is obtained only if the two normal transitions are assigned dif-ferent bandwidths 共0.09 for the high-lying transition and 0.35 eV for the low-lying one兲. Fitting of the CD spectrum is very sensitive to this asymmetry. We can connect this asym-metry to the above-mentioned difference in the coupling of the two heme transitions with the proximal histidine. Indeed, our calculation shows that the dipole-dipole coupling energy is more than one order of magnitude larger for the heme x transition than for the y one. Given that transition band-widths are closely connected to the coupling with the bath, it seems normal that the low-energy transition which is more coupled to the environment has a larger bandwidth.
In order to analyze the origin of the Soret rotational strength, we rewrite Eq.共3.11兲 as
R共n兲=
兺
j⫽hemeR共n兲共heme, j兲 +
兺
i,j⫽heme
R共n兲共i, j兲, 共3.15兲
and we keep only the first term defined from Eq.共3.14兲 as
R共n兲共heme, j兲 = 2ប 2
兺
s,t theme,s 共n兲 t jt 共n兲rគheme,j.关uគheme,s⫻ uគjt兴. 共3.16兲 This definition allows the contribution of the individual aromatic residues to the Soret rotational strength to be thor-oughly analyzed. Neglecting the second term in Eq. 共3.15兲 amounts to neglecting the residue-residue couplings which contribute indirectly to the total rotational strength through the normal modes. This error is, however, very small 共see Table II兲.
Contributions of the various residues according to Eq. 共3.16兲 are listed in Table II. Even though details of the con-tributions are very dependent on the protein geometry, these results are in qualitative agreement with Ref. 9. The most important residues are His64, Phe33, Tyr103, and Trp14. Several points are worth mentioning. First, the proximal his-tidine does not contribute much to the total rotational strength. Even though this residue is of paramount impor-tance for defining the normal modes, the imidazole group position being almost perpendicular to the heme plane, it only gives a weak rotational strength. Second, most of the amino acids contribute a positive rotational strength. A no-table exception is the distal histidine which gives a strong negative signal. Finally, note that all helices play a role but interestingly, the E helix which encompasses the heme pocket gives a negative signal whereas the other, more dis-tant helices contribute a positive signal.
3. Mb
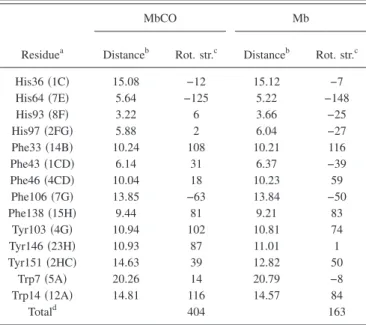
In Mb, the Soret band is shifted to longer wavelengths and the major component peaks at 430 nm. For this peak, TABLE II. Calculation of the contributions of the−*transitions of in-dividual residues to the rotational strength of the heme in the Soret band for MbCO and Mb.
Residuea
MbCO Mb
Distanceb Rot. str.c Distanceb Rot. str.c His36共1C兲 15.08 −12 15.12 −7 His64共7E兲 5.64 −125 5.22 −148 His93共8F兲 3.22 6 3.66 −25 His97共2FG兲 5.88 2 6.04 −27 Phe33共14B兲 10.24 108 10.21 116 Phe43共1CD兲 6.14 31 6.37 −39 Phe46共4CD兲 10.04 18 10.23 59 Phe106共7G兲 13.85 −63 13.84 −50 Phe138共15H兲 9.44 81 9.21 83 Tyr103共4G兲 10.94 102 10.81 74 Tyr146共23H兲 10.93 87 11.01 1 Tyr151共2HC兲 14.63 39 12.82 50 Trp7共5A兲 20.26 14 20.79 −8 Trp14共12A兲 14.81 116 14.57 84 Totald 404 163
aThe amino acids are denoted following the usual abbrevations: His = histidine, Phe= phenylalanine, Tyr= tyrosine, and Trp= tryptophan. The symbols in parentheses designate the residue position in the helices A, B,…. bAll distances are in Angstroms.
cAll rotational strengths are in 10−3Debye-Bohr magnetons共DBM兲. dThe difference between the total rotational strength and the sum of the individual residue contributions comes from the interresidue coupling.
which comes from the B band of the heme, the same conclu-sions as for MbCO can be drawn共see Table II兲. These results are helpful to analyze the measurement taking place at 440 nm. However, for 422 nm, it is important to also con-sider the high-energy shoulder which relies on the higher heme transitions. Analysis of the individual contributions shows that the most important contribution to this high-energy part of the CD spectrum comes from Phe 43 whose benzene plane lies parallel to the heme plane共see Table III兲. IV. SIMULATION OF THE EXPERIMENTS
We want in this section to utilize our calculations to better understand the experimental signals that we have ob-tained共Fig. 1兲. Even though we know the starting and ending points 共MbCO and Mb兲, it is not sufficient to consider the corresponding steady-state CD spectra to understand our data. The first reason is that following the CO dissociation, the heme undergoes an instantaneous electronic transition from a low-spin state to a high-spin one. As already stated, this change is accompanied by a shift of the transition fre-quencies as well as a decrease of the oscillator strengths. Furthermore, the heme domes and the iron atom moves out of the heme plane by a fraction of an angstrom.21This dom-ing is responsible for the larger coupldom-ing between electronic and vibrational transitions.20 This change of electronic tran-sitions automatically induces a change of CD which has nothing to do with a conformational change. It is therefore important to calculate the CD for intermediate configurations in order to single out the effects of conformational changes. In the following, we consider several relevant intermediate configurations. The predicted CD spectra are displayed in Fig. 4. Before proceeding to these calculations, we would like to comment on the effect of the CO molecule. CO has no transition in the visible or near ultraviolet and therefore does not couple efficiently with the heme electronic transitions. However, this weakness of the interaction can be counterbal-anced by its proximity to the heme. When bound to the heme, the CO molecule stands in an upright position with
respect to the heme plane and consequently does not contrib-ute to the MbCO CD. After leaving the heme iron, the CO rapidly goes to a first docking site where it stays hundreds of nanoseconds.22 This docking site being 3 Å away, the effect of CO on the CD spectrum is negligible. Finally, CO motion could impact the CD only in the very first picoseconds when going from the heme to its docking site. This time scale being out of reach of our experiment, we can safely neglect the contribution of CO to our experiment.
A. Intermediate configurations
As a first intermediate configuration, that we denote Mb*, we consider the case where the protein geometry is the
same as MbCO but where the electronic state of the heme has been shifted to the Mb one. Even though this configura-tion has no real existence because the change in the elec-tronic transitions and doming of the heme are closely con-nected, it serves as a starting point of the conformational changes after getting rid of the variation of the electronic state. The predicted CD change when going from MbCO to Mb* corresponds to the instantaneous drop observed at 422 nm 共near the MbCO peak兲 and to the instantaneous in-crease at 440 nm 共near the Mb peak兲.
Following this very first step, we have simulated the effect of the change of geometry of the heme. We have there-fore taken the geometry of MbCO for all the amino acids except for the heme. We have also considered the case where the heme and the proximal histidine have been moved to their final geometry. In both cases, the corresponding CD spectra are very close to the final Mb CD spectrum. This interesting feature shows that the large CD change that we observe in our experiment cannot be related to a progressive change from the MbCO geometry to the Mb one. We have therefore to examine other possible explanations of our ob-servations. Given the importance of the proximal and distal histidine in the origin of the CD spectrum, we have exam-ined the effects of a rotation of the imidazole planes on the CD spectra. Rotating the distal histidine, in fact, did not al-low to lead a large change and even though such movements are probable due to collisions of the CO in the first docking site, they cannot be invoked to interpret our experiment. TABLE III. Calculation of the contributions of the −* transitions of
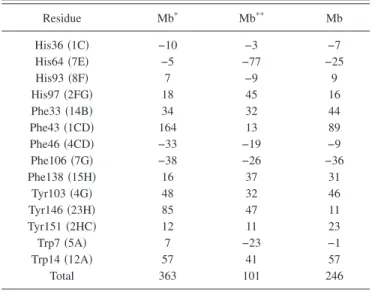
individual residues to the rotational strength共in 10−3DBM兲 of the heme in the high-energy band of Mb, Mb*, and Mb**共see text兲.
Residue Mb* Mb** Mb His36共1C兲 −10 −3 −7 His64共7E兲 −5 −77 −25 His93共8F兲 7 −9 9 His97共2FG兲 18 45 16 Phe33共14B兲 34 32 44 Phe43共1CD兲 164 13 89 Phe46共4CD兲 −33 −19 −9 Phe106共7G兲 −38 −26 −36 Phe138共15H兲 16 37 31 Tyr103共4G兲 48 32 46 Tyr146共23H兲 85 47 11 Tyr151共2HC兲 12 11 23 Trp7共5A兲 7 −23 −1 Trp14共12A兲 57 41 57 Total 363 101 246
FIG. 4. Calculated spectra for MbCO and Mb and for two intermediate configurations Mb*and Mb**共see text兲.
184901-6 T. Dartigalongue and F. Hache J. Chem. Phys. 123, 184901共2005兲
B. Rotation of the proximal histidine
Rotation of the proximal histidine about the axis perpen-dicular to the heme proved to deeply affect the CD spectrum. This result of our calculation is surprising at first sight be-cause, as stated previously, the proximal histidine does not provide a large contribution to the total rotational strength due to its perpendicular position with respect to the heme. Indeed, rotation of the imidazole plane does not change this symmetry. The reason for the huge effect of this rotation is to be sought in the coupling between the heme and the proxi-mal histidine which mainly determines the norproxi-mal modes of the system. As schematically drawn in Fig. 5, the two x , y degenerate heme transitions are coupled to His93 and give birth to two nondegenerate normal modes. Each mode is a combination of all the original transitions, with a predomi-nance of the heme transitions, and has a rotational strength which originates in the coupling of the heme with the other residues. In MbCO or Mb, the two modes have rotational strengths with opposite signs, giving rise to the CD spec-trum. When His93 is rotated, the positions and the oscillator strengths of the normal modes do not change appreciably but their composition in terms of original transitions is strongly modified and so is the repartition of the rotational strength between the two modes. This change translates into a large modification of the CD spectrum. Note that the contribution of the proximal histidine to the total rotational strength does not change dramatically and remains very small.9 The change comes from the other amino acids. We have consid-ered a rotation of / 6 in Fig. 4. One can see that the CD decreases strongly in this case. Rotating further the proximal histidine results in an interchange of the sign of the rotational strength between the two normal modes. It is not clear how bandwidths should be modified in such a strong perturbation, but in any case, such a rotation is expected to completely change the shape of the CD spectrum. The configuration with the proximal histidine tilted by / 6 is denoted Mb**in the
following.
C. Pump-induced anisotropic CD
We have taken advantage of our calculation to address another problem that can be encountered in our time-resolved CD experiment, namely, the pump-induced aniso-tropy of the sample. Indeed, myoglobin molecules whose heme plane lies parallel to the pump polarization are prefer-entially excited. This means that after excitation, the sample is no longer isotropically distributed. CD in anisotropic samples being different from isotropic sample,23 could give rise to a time evolution of our CD signal connected to the
randomization of the sample and not to conformational changes. Even though such a reorientation process is ex-pected to last 35 ns8and therefore cannot explain our 100 ps change, it seems interesting to quantify this effect. In a recent paper,14 we have extended Applequist’s calculation to this anisotropy problem and shown that it was possible to ac-count for anisotropy by introducing a tensorial rotational strength. We have applied this to our experiment by calculat-ing the CD spectra for a sample where 20% of the molecules are excited and comparing the cases of a pump-induced an-isotropic distribution and of an an-isotropic one. In the aniso-tropic case, the proportion of excited molecules depends on the angle between the normal to the heme and the beam propagation direction. Because it is proportional to the ab-sorption cross section, it is readily calculated and averaged over the initial isotropic distribution. The results are dis-played in Fig. 6, clearly demonstrating that this effect is neg-ligible in our experiment. This insensitivity to the anisotropy of the distribution is connected to the x , y quasidegeneracy of the two Soret transitions.
V. DISCUSSION
We come now to a discussion of our experimental results in view of our calculation. First of all, we can understand that no dynamics could be observed on nanosecond or longer time scale even though motion of remote amino acids is still expected on such time scales.24 Indeed, our calculation shows that once the electronic-induced change of the CD is taken into account, no major changes occur when passing from the liganded geometry to the deliganded one. Two points can explain this insensitivity. On the one hand, the residues move relatively little compared to the heme and on the other hand, even though individual residues can bring a noticeable change to the total rotational strength, these changes can be positive or negative and result on average in a weak modification.
The second point we want to address is the dip we ob-serve in the time-resolved CD curves at 422 and 440 nm. As indicated in Sec. IV, the only geometric change that can in-duce such a decrease of the CD is connected to the rotation of the imidazole plane in the proximal histidine. Note that this feature allows us to understand the observed trends for 422 nm as well as for 440 nm. In order to characterize better this effect, we have analyzed the contributions of the indi-FIG. 5. Sketch of the electronic levels for the heme and His93 and the
normal modes resulting from their coupling. The two low-lying normal modes have rotational strengths of opposite signs.
FIG. 6. Calculated CD spectra for a mixing of 80% MbCO and 20% Mb* for an isotropic distribution共blue dashed line兲 and a pump-induced aniso-tropy共red solid line兲.
vidual residues to the rotational strength 共Table II兲 and we have plotted in Fig. 7 their variation when the protein passes from Mb*to Mb**and from Mb**to Mb. It is clear from this
figure that rotation of the proximal histidine profoundly changes the contribution of His64 and Phe43 to the total rotational strength. These two amino acids are indeed very close to the heme and strongly coupled to it. Upon relaxation of the proximal histidine together with the rest of the protein toward the final deoxy configuration, evolution of the rota-tional strengths is reversed, canceling the major part of the effect. Only for Tyr146 does the contributions evolve in the same direction, but as already stated, this noticeable change is almost completely canceled out by other contributions.
Our studies therefore allow us to propose a picture of what is happening in the first 100 ps following myoglobin photolysis. Following the departure of the CO, the heme un-dergoes a very rapid doming which in turn creates a stress on the proximal histidine. From our measurements, this stress settles in a few tens of picoseconds. This is the stress which is responsible for the large change in the CD that we observe. It is not possible to know precisely from our measurements what is the motion of the histidine as there exist many de-grees of freedom, but the role of histidine in the very first step of the process can be confidently assessed from our calculations. This stress then relaxes through the movement of the F helix to which the proximal histidine belongs which in turn triggers the whole relaxation of the protein to its deoxy form. From our measurements, we see that the histi-dine stress relaxes on a 100 ps time scale, revealing an im-portant step in the heme pocket relaxation. It is interesting to note that these time scales for the rise and for the decay of the signal are in agreement with the energetic dynamics mea-sured through thermal phase grating.25This feature conforms with the idea that local motions are directly connected to energetic relaxation in the bath. These times are moreover similar to the dynamics of the frequency shift of the Fe–His vibration measured by time-resolved resonance Raman spectroscopy.26They could also be associated with the slow components already observed in the heme doming.27
VI. CONCLUSION
In this article, we have presented a model calculation of the CD spectrum of myoglobin. By calculating the spectrum for various configurations, we have been able to show that global change of the protein geometry from the initial state 共MbCO兲 to the final one 共Mb兲 does not explain the transient decrease that we observe in our time-resolved experiment. However, our calculation pinpoints the crucial role played by the proximal histidine in defining the protein normal modes and shows that motion of this histidine can explain our re-sults. We can therefore conclude that our CD experiment allows us to observe the initial stress of the proximal histi-dine following the heme doming. This stress relaxes through the movement of the F helix and triggers the global rear-rangement of the myoglobin to its deoxy configuration. Re-laxation of the proximal histidine is measured on a 100 ps time scale. This short time scale corresponds to the very first motion of the protein. By accessing such a short time scale, this resolved technique is very complementary to time-resolved x-ray diffraction techniques which yield informa-tion on a 150 ps time scale.24This technique should also be very powerful in studying first events in ␣-helix formation because such secondary structures have characteristic CD signatures in the ultraviolet that should be accessible to time-resolved experiments.
ACKNOWLEDGMENT
We thank Alexandre Chenal for providing us access to a CD spectrometer for the measurement of the steady-state CD spectra.
1S. J. Milder, S. C. Bjorling, I. D. Kuntz, and D. S. Kliger, Biophys. J. 53, 659共1988兲.
2X. Xie and J. D. Simon, Biochemistry 30, 3682共1991兲.
3T. Dartigalongue and F. Hache, Chem. Phys. Lett. 415, 313共2005兲. 4J. W. Lewis, R. A. Golbeck, D. S. Kliger, X. Xie, R. C. Dunn, and J. D.
Simon, J. Phys. Chem. 96, 5243共1992兲.
5T. Dartigalongue and F. Hache, J. Opt. Soc. Am. B 20, 1780共2003兲. 6S. Franzen, L. Kiger, C. Poyart, and J. L. Martin, Biophys. J. 80, 2372
共2001兲.
7M. Lim, T. A. Jackson, and P. A. Anfinrud, J. Phys. Chem. 100, 12043 共1996兲.
8J. Hofrichter, A. Ansari, C. M. Jones, R. M. Deutsch, J. H. Sommer, and E. R. Henry, Methods Enzymol. 232, 387共1994兲.
9M. C. Hsu and R. W. Woody, J. Am. Chem. Soc. 93, 3515共1971兲. 10G. Blauer, N. Sreerama, and R. W. Woody, Biochemistry 32, 6674
共1993兲.
11H. J. DeVoe, Chem. Phys. 43, 3199共1965兲.
12J. Applequist, K. R. Sundberg, M. L. Olson, and L. C. Weiss, J. Chem. Phys. 70, 1240共1979兲.
13C. Diedrich and S. Grimme, J. Phys. Chem. A 107, 2524共2003兲. 14F. Hache and T. Dartigalongue, Chem. Phys. 303, 197共2004兲. 15J. Vojtechovsky, K. Chu, J. Berendzen, R. M. Sweet, and I. Schlichting,
Biophys. J. 77, 2153共1999兲.
16G. Geraci and L. J. Parkhurst, Methods Enzymol. 76, 262共1981兲. 17D. M. Rogers and J. D. Hirst, J. Phys. Chem. A 107, 11191共2003兲. 18C. Andraud共Private communication兲.
19W. A. Eaton and J. Hofrichter, Methods Enzymol. 76, 175共1981兲. 20A. Cupane, M. Leone, E. Vitrano, L. Cordone, U. R. Hiltpold, K. H.
Winterhalter, W. Yu, and E. E. Di Iorio, Biophys. J. 65, 2461共1993兲. 21C. Rovira, K. Kunc, J. Hutter, P. Ballone, and M. Parrinello, J. Phys.
Chem. A 101, 8914共1997兲.
22D. Vitkup, G. A. Petsko, and M. Karplus, Nat. Struct. Biol. 4, 202 共1997兲.
FIG. 7. Histogram of the calculated variation of the contribution of the residues to the rotational strength of the high-energy band when passing from Mb*to Mb**共red兲 and from Mb**to Mb共blue兲. See text for the defi-nition of the intermediate structures.
184901-8 T. Dartigalongue and F. Hache J. Chem. Phys. 123, 184901共2005兲
23D. Che, R. A. Goldbeck, and D. S. Kliger, J. Chem. Phys. 100, 8602 共1994兲.
24F. Schotte, M. Lim, T. A. Jackson, A. V. Smirnov, J. Solman, J. L. Olson, G. N. Phillips, M. Wulff, and P. A. Anfinrud, Science 300, 1944共2003兲.
25R. J. D. Miller, Acc. Chem. Res. 27, 145共1994兲.
26Y. Mizutani and T. Kitagawa, J. Phys. Chem. B 105, 10992共2001兲. 27M. Lim, T. A. Jackson, and P. A. Anfinrud, Proc. Natl. Acad. Sci. U.S.A.
90, 5801共1993兲.