Costs of Complexity in Hewlett-Packard's Inkjet Printer Business by
Cassian Naughton
Bachelor of Arts in Management Science and Information Systems, Trinity College Dublin, 1997 Master of Science in Statistics, Trinity College Dublin, 2000
Master of Arts in Management Science and Information Systems, Trinity College Dublin, 2006 Submitted to the Department of Electrical Engineering & Computer Science and
the MIT Sloan School of Management in Partial Fulfillment of the Requirements for the Degrees of
Master of Science in Electrical Engineering & Computer Science and Master of Business Administration
In Conjunction with the Leaders for Manufacturing Program at the Massachusetts Institute of Technology
June, 2007
02007 Massachusetts Institute of Technology. All rights reserved. Signature of Author _______________________
Sinr o MIT Sloan School of Management Dept of Electrical Engineering & Computer Science May 11, 2007
Certified by
-Stephen Graves, Thesi Advisor, Abraham Siegel P ofessor of Management, / MIT Sloan School of Management Certified by
Pablo a r o, Thesis~dvisor, Associate Professor Department of Eetrical Engineering and Computer Science Accepted by
Debbie Be an, Execufve Director, Masters Program
SMI-Sbar6 School ofiManagement Accepted by
Arthur smith, Chair, DepartfinentaTCommittee on Graduate Students Department of Electrical Engineering and Computer Science
JSSACHUSETTS INSTITUE OF TECHNOLOGY
MITLibraries
Document Services Room 14-0551 77 Massachusetts Avenue Cambridge, MA 02139 Ph: 617.253.2800 Email: docs@mit.edu http://libraries.mit.eduldocsDISCLAIMER OF QUALITY
Due to the condition of the original material, there are unavoidable flaws in this reproduction. We have made every effort possible to provide you with the best copy available. If you are dissatisfied with this product and find it unusable, please contact Document Services as soon as possible.
Thank you.
The images contained in this document are of
the best quality available.
Costs of Complexity in Hewlett-Packard's Inkjet Printer Business by
Cassian Naughton
Submitted to the Department of Electrical Engineering and Computer Science and the MIT Sloan School of Management on May 11, 2007
In Partial Fulfillment of the Requirements for the Degrees of Master of Science in Electrical Engineering and Computer Science
and Master of Business Administration Abstract
This thesis deals with the cost of complexity at Hewlett-Packard's inkjet printer business. The term cost of complexity refers to the costs associated with offering a more diverse portfolio. The most basic example is to consider the situation of increasing the number of items for sale from one to two. As the second item is added setup costs will be incurred since there will now be changeovers from the production of one item to the other. If there are unique components in the added product then there will be additional suppliers to be managed etc. As more and more products are added in search of additional revenue the cost of complexity can rise dramatically. Eventually the costs associated with offering the additional end items can outweigh the
incremental revenue earned. While it is easy to measure the revenue from these peripheral offerings it is difficult to determine the associated costs. This combination means that the number of end items offered can grow unabated. In this thesis we examine a framework for analyzing the trade-off between the costs and benefits of offering increased variety.
Thesis Supervisor: Pablo Parrilo
Title: Associate Professor, Department of Electrical Engineering and Computer Science Thesis Supervisor: Stephen Graves
Title: Abraham Siegel Prof of Management, MIT Sloan School of Management
ACKNOWLEDGEMENTS
I owe a great deal of thanks to many people for such an enriching two years at MIT. Firstly, I would like to thank Jim and Alyson for persuading me to come to MIT and the LFM program. I owe a great deal of gratitude to the administrative staff Nancy, Davicia and Tayisiya who more than any other group of people made sure I got through my 2 years with the minimum paperwork, delivered, JIT.
Also I would like to recognize the effort Hewlett-Packard put into the project through, Gavin, Scott and Brian. The project would not have happened without the generous sponsorship of Bill Crandall. I owe a great deal of thanks to Prof. Graves for taking the time to carefully correct this thesis.
This is the third thesis I have written during my numerous stints in college. The one common theme that has prevailed throughout all my time at college is the encouragement, love, support
and humor of my parents, to whom I owe so much.
TABLE OF CONTENTS
Acknowledgem ents...5
Chapter 1: Introduction and Sum m ary... 8
1.1 The Client Com pany: Hew lett-Packard ... 8
1.2 Project Background: HP's Inkjet Printer Division... 8
1.3 The Project Team ... 8
1.4 Term s of Reference ... 9
1.5 Sum m ary of Rem aining Chapters... 10
Chapter 2: Conclusions and Reccom endations ... 12
Chapter 3: Com plexity m anagem ent ... 14
3.1 Com plexity Drivers... 14
3.2 Effects of Com plexity ... 15
3.3 "Good" vs. "Bad" Com plexity... 17
3.4 W ays to A ddress Com plexity ... 17
3.5 G oal of Variety M anagem ent ... 18
3.6 Process for V ariety M anagem ent... 20
Chapter 4: Com pexity M anagem ent at IPG ... 22
4.1 W hat is an end item at Hewlett-Packard ... 22
4.2 Reducing the num ber of end item s ... 23
4.3 The Decision M aking Approach... 25
4.4 W hat is a good consolidation... 26
4.5 W as it a good idea to offer this product in the first place ... 27
Chapter 5: The Cost Saving Categories... 29
5.1 Com plexity Costs ... 29
5.2 Estim ating the Costs of Variety ... 32
5.3 M arket Developm ent Funds ... 37
5.4 Price Protection... 38
5.5 End of Life Funds ... 38
5 .6 R etu rn s... 3 8 5.7 W arranty ... 39
Chapter 6: The Increase in Localization M aterials... 40
6.1 W hat are localization m aterials... 40
6.2 Sam ple calculations... 41
6.3 Practical considerations... 41
Chapter 7: Im plem entation of Com plexity Reduction... 43
7.1 Challenges and Opportunities... 43
7.2 Stages of Im plem entation ... 46
7 .3 R e su lts ... 4 8 Endnotes... E rror! Bookm ark not defined. Bibliography... 50
CHAPTER 1: INTRODUCTION AND SUMMARY
1.1 The Client Company: Hewlett-Packard
Bill Hewlett and Dave Packard, two Stanford alumni, founded the Hewlett-Packard Company (HP) in 1939. Its first products were built in a garage in Palo Alto and Disney was one of its first customers. Disney used the product for a new sound system in the movie Fantasia. In May of 2002, HP merged with Compaq Corporation to strengthen its position in both consumer and business computers. HP is a fortune 11 company, serving over one billion customers in 170
different countries. The company currently employs over 150,000 people. It is split into three business units centered on its core technologies: Personal Systems Group (PSG), Imaging and
Printing Group (IPG), Technology Solutions Group (TSG).
1.2 Project Background: HP's Inkjet Printer Division
The Imaging and Printing Group (IPG) consists of two main divisions: Inkjet and Laserjet. Each division consists of a corporate entity and subdivisions for each of the different geographies that HP competes in. The Inkjet product portfolio consists of black-and-white, color, photosmart and all-in-one lines of business. The photosmart printers are capable of printing high quality digital images directly from a camera. The all-in-one line of printers has photocopy, fax and scanning capabilities. At the corporate level, there has been a consistent push to optimize the overall complexity of product offering of HP. During the last number of years, HP undertook a number of complexity management initiatives. The firm also engaged with external consulting firm Bain in 2000 for a similar effort. Raphel (2005) and Landivar Chavez (2006) were two LFM projects which examined complexity in the North American desktop and the server lines of businesses respectively.
1.3 The Project Team
The project team consisted of executive sponsors, business experts from supply chain and marketing and two SPaM members. SPaM is the acronym for the Strategic Planning and Modeling unit of HP. SPaM is an internal consulting group that partners with the functional
business experts to solve high impact business issues. As internal consultants there is constant focus on doing what is best for HP. As the main SPaM resource on the project, my role was to lead the overall effort moving the project through any and all roadblocks.
1.4 Terms of Reference
The Inkjet Printing Group (IPG) engaged SPaM to conduct a complexity management project. As a result the inkjet product-lines i.e. black-and-white, color, photosmart and all-in-one printers were the focus of the initiative.
The project targeted reducing the explosion of products offered through individually localized printers. The net effect of this was to examine in detail the effect of combining regional offerings rather than reducing complexity by removing feature or feature sets from the product portfolio.
1) Identify the largest costs associated with supporting increased complexity. Create a model to illuminate these hidden costs.
The initial phase of the project focused on gathering information to help determine the pain points of complexity. This would help determine the size of the potential benefits to HP for
completing the program. It was also necessary to identify each of the major stakeholders in complexity management decisions and to make sure all viewpoints were carefully considered.
2) Provide simple rules of thumb to help HP implement ongoing complexity management in the Inkjet Printing Group.
Although a complex model might be used to gain insight into the nature of the costs associated with complexity the aim of the project was to ensure sustained complexity management without the need for advanced analytical support. To ensure success the business would need simple rules-of-thumb which could be applied to ensure near optimal results under the pressure of everyday business in the fast paced tech environment.
3) Determine which members of the organization are best placed to ensure the correct tradeoffs are made.
Organizational structures are becoming more complicated in today's matrix organizations. To help implement new business processes it is imperative to ensure the right people are involved. HP uses an internal system termed RACI to ensure the right people are included to the
appropriate level. RACI stands for Responsible, Accountable, Consulted and Informed. In establishing the new process the relevant resources have to be categorized using the above
system.
1.5 Summary of Remaining Chapters
Chapter 2 outlines the main conclusions and recommendations of the project. The interested reader can find further detail behind the recommendations in the subsequent chapters.
Chapter 3 provides an overview of the topic of complexity management. It provides a generic discussion about what drives complexity, its effects as well as how it can be tackled.
Chapter 4 provides some background to orientate the reader as to how complexity management was conducted for the IPG group at HP. It examines which level of the product hierarchy the project focused on.
Chapter 5 provides an overview of the aim of the project at the highest level. It describes how we view the costs and savings in the context of the variety management for IPG
Chapter 6 starts with an introduction into how one can estimate the savings from reducing the costs of complexity. It then proceeds to detail some of the specific cost categories that can be investigated. How important each of these categories is will vary from business of business.
Chapter 7 starts with a discussion of the types of in-box material that comes with a printer. It closes with a discussion on the types of trade-offs companies have to make when determining which in-box materials to include.
Chapter 8 rounds out the thesis by discussing the implementation of variety management at HP. Although the actual results are confidential it is worth examining how implementation shapes analysis.
CHAPTER 2: CONCLUSIONS AND RECCOMENDATIONS
Through the project Hewlett-Packard was able to optimize the inkjet product portfolio offered in Asia. This led to a reduction in the SKU count of between 25-35%. It is anticipated that this reduction in the SKU count will result in substantial savings. Due to the confidential nature of the work the precise amount cannot be revealed. See chapter 8.
Hewlett-Packard Inkjet hardware now has a process by which to manage variety in an on-going manner. The appropriate resources and the roles they need to play were identified. Although the results presented in this thesis are for the IPG group in Asia there was considerable effort
invested in unifying the approaches taken by European and American regional divisions. See chapter 8.
The nature of lower level materials is not as static as was first imagined. Through implementing certain lower level material consolidations a number of further opportunities for cost reduction have been identified and will be incorporated in future product releases. See chapter 7.
Although there are significant savings to be had from examining consolidations at any and all stages of the product hierarchy, it is typically easier to implement changes to the final
localization stage. A number of reasons are presented for this in chapter 4 and one of the main reasons is it doesn't reduce the revenue projections for any item.
Although there are savings in a variety of cost categories, a significant portion of the anticipated cost savings will be from reduced operating expenses. These will be things such as reduced R&D and planning effort. If a project is to be successful, then the company will need to value these savings.
Complexity management is one tool available to help reduce costs and maintain superior
profitability. Postponement, modularity and commonality are all natural supplements and no one program will provide a complete solution in all situations.
As with any initiative the effect needs to be monitored to ensure the desired outcome is being achieved. Even though it is difficult to determine in retrospect which savings were due to the complexity management and which were due to the numerous complementary initiatives that were also implemented, it is essential to determine ensure that the cost calculator is properly calibrated.
CHAPTER 3: COMPLEXITY MANAGEMENT
3.1 Complexity Drivers
Complexity (or variety) management has received considerable attention in recent years. Quite simply it refers to offering customers the product differentiation they are willing to pay for to the extent that the additional revenue received must offset the additional costs. Later on we will examine the revenue and costs aspect of the equation, but for now we will discuss why there has been an increase in complexity.
Global corporations: Today more than ever companies are competing in more and more
markets. Hewlett-Packard has over 1 billion customers in over 170 countries. This represents a diverse group of people with differing needs. Often the countries have different languages, currencies, customs and regulations. With increased pressure in the market place,
Hewlett-Packard wants to offer its customers increasingly higher quality items. By offering increasingly more tailored products Hewlett-Packard can increase its value proposition to its customers.
Increasing sophistication: Products are being packed with more and more features. Initially all printers were black and white. Now there are color printers, photo printers, as well as printers with fax, scan, and copier capabilities. This increase in the number of product attributes has driven an explosion in the dimensions on which products are competing.
Organizational Processes: The focus at Hewlett-Packard is on bringing the next generation of innovative products to market as quickly as possible. A fast and efficient New Product
Introduction (NPI) process has been established to support this. Indeed Olavson and Fry (2006) state "at one time at Hewlett-Packard it was harder to get a travel request approved to travel from San Francisco to Houston than it was to gain approval for a new SKU (stock keeping unit) to be launched". Like many product development companies it is easier to launch a SKU than to get one removed
Increasing Channels: In an attempt to reach more customers, manufacturers are supplying their products to more and more customers through a variety of channels. There are often differences in products that are supplied to stores where advice is given versus selling online where the customer receives no advice from a sales clerk.
Retailer competition: With the retailers in each channel coming under increasing pressure, the retailers are leaning on the manufactures to provide them with differentiated products to help draw customers into their stores. For example, Staples may require a specific Hewlett-Packard printer that is only available at Staples to gain a competitive edge on Best Buy.
Industry Consolidations: Many industries are experiencing an increase in merger and
acquisitions activity. In technology as the roles and functions of media converge more and more, acquisitions are taking place. The merger of Hewlett-Packard with Compaq Corporation in May (2002) was the largest corporate merger to date. With such mergers comes huge complexity and massive integration challenges.
3.2 Effects of Complexity
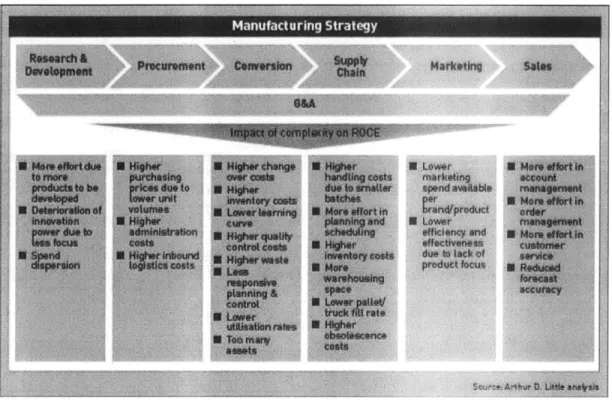
Many experts agree that one of the main obstacles preventing companies from managing variety is that the costs are often hidden in nature and are at best extremely difficult to estimate. A 2004 study by Arthur D. Little identified many possible effects of complexity on a company's return on capital employed (ROCE) as summarized in Figure 3-1.
Figure 3-1: Arthur D. Little findings on the effects of complexity across the value chain
The Arthur D. Little findings show that product portfolio decisions have consequences up and down the value chain. Treating each column in the above diagram as a silo, (which it is in many organizations) it is easy to imagine how as each stage of the value chain tries to optimize, it may have detrimental consequences on the other stages of the value chain.
If a unique part is introduced by marketing to satisfy a particular demand, it is easy to imagine how this low volume part may result in increased work for procurement since the part may have to be dual sourced and for R&D since it mean further testing. Marketing is unlikely to be aware of these additional costs incurred and may view them as only minor changes.
As more complexity is introduced into a company, the planning process becomes more difficult. One of the difficulties arises simply from the fact that the same amount of available time must now be split across more and more parts. The number of mistakes is likely to increase, yet the cause of these mistakes will go unaddressed.
Another source of difficulty comes from the fact that with rising complexity the pooling effect is reduced so it becomes more difficult to forecast correctly and the quantity of safety stock will have to increase to maintain the same service level. If it is not increased the number of stockouts
is likely to increase. If the number of stockouts increases the company will usually face
additional expenses. One common expense is airfreight. As the product runs short, the company has to choose more costly transport options. These bottom line expenses come on top of the considerable effort that is expended by the organization to deal with the increased fire fighting. There is also considerable opportunity cost as time that would otherwise be invested in
improvement activities is lost and the company can find itself falling further and further behind its competition.
3.3 "Good" vs. "Bad" Complexity
It is important to note that not all complexity is bad. If the customer is willing to pay for it and the organization understands what it costs, complexity can help capture additional customers or markets. The 2004 white paper by Arthur D. Little distinguishes the different types:
"As far as the incremental profitability that results from this added complexity structurally compensates for the additional cost, we speak of 'good complexity.' The problem, however, is often that adding complexity requires fundamentally adapting a company's operating model in order to prevent the additional costs incurred exceeding the potential financial
benefits."
The authors term the last situation "bad complexity". If a company fully understands the true costs associated with complexity, it can use this information to price accordingly. Indeed if a company understands its costs so deeply, it will be able to use this information to gain strategic advantage in markets where competitors operate with less detailed information. By only serving customers who are either profitable or strategic, the firm will leave unprofitable customers to the competition. Since the competition does not understand the true costs associated with serving these customers, it is likely it will serve these customers at a loss.
3.4 Ways to Address Complexity
The organization has only two methods to control complexity: 1) Reduce the number of end items in the portfolio
2) Recover the costs
By reducing the number of end items offered the organization will realize savings in reduced inventory holding costs, obsolescence, improved planning etc. A full discussion of the costs is covered in Chapter 6.
In the second method the firm can use the information on the costs of complexity in contract negotiations or in pricing its products.
The firm will consider between these methods and will most likely choose one. If however a company finds that neither of these options is feasible then it may elect to do nothing and
continue business as usual. While this is clearly suboptimal, it may be the only practical avenue open to a firm until it can renegotiate contracts etc.
3.5 Goal of Variety Management
The overall goal of variety management is summarized in Figure 3-2 which appears in Olavson and Fry, (2006). Firstly we want to reduce the number of products with very low volumes. Products that sell in very low volumes should be servicing strategic customers. We want to move the volume from some of our slower running products to the faster running ones. By
increasing the volume on the higher running products we hope to take advantage of the
experience curve and to drive even better economies of scale on products which are generating the most revenue.
A
2. Variety control lever: ensure high ROI on vadlety-ddven costs (primaly QpU) with
data-drtven scr : ning- of now partprpsl
state Decision proce.., ROI
calculator I guidelines
I
I
Core Offeing (top 25%) JI Extended Ofeng (other 75%) Number of productsFigure 3-2: Olavson and Fry, 2006 Dynamics of Value-Drive Variety Management
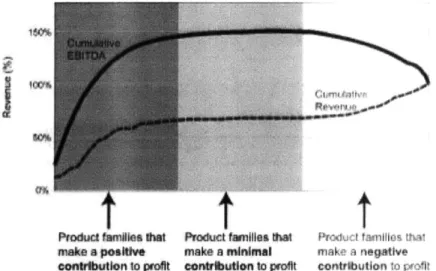
Ideally if we could calculate the true return on our products it would be easy to identify which products to focus on. Conceptually we can think of how this translates to a profit versus revenue
give the current product portfolio. Mercer Management Consulting discusses this issue in its paper "Unlocking profitability in complex companies." Figure 3-3 shows their analysis of profitability as a function of profit with a clearly visible optimum. The pursuit of incremental revenue comes at the expense of profitability, mainly due to the hidden costs of complexity.
19
.Demand s6hfting lever control volume-ddven
aiabile cnsts (pnmarily COGS; up to 10% of material costs)
Process changes and
operational metrics
T
T
Product famnlee tt make a poalti
contibution to prot
Product famlles that make a minmal contrition to profit
matl nega l t confributIon, 0o pr
Figure 3-3: Taha and Mitchell, 1999, profitability as a function of revenue
3.6 Process for Variety Management
The Ideal variety-management process is a tW.hased approach that itwolves an up-tont ,oestmernt of time to assess cost Impacts and developguideines for ongoing variety management.
* Collect data across evelop gudeines * Oocumnt costs and Crot sunc tIonsi * Track productivity
entire P&L prmduct fWeo benefts of proposal committee hosts motrics and provide
liffcycl* Inroov"nt coltl a well as impact on pedodk forum to feedback to aene
variety nd benefts of new comp*Xfty Using evaluate proposah management maag Introductiom godellms tach p*oposal ts # Aewd strong
o -w-hich cost *Automate tthe * oament srategkc evalvated Objctively performanc.
to trget which guidelines iia cOnItdatiwon Using # Correct *uide?'nes errors and
product variants to simple spreadsIe Improve process
focus on. which lerets tool
to pulI etc. * rmt' " on *Ident and estimate
value-rtven and c0rret Prct""es -,kflmroles and varlety-driven costs of
complexty management
Figure 3-4: Hewlett-Packard's Variety Management Process
Olavson and Fry, (2006) detail the approach they recommend for tackling variety management. I will discuss each of the stages quickly and the interested reader should consult the reference.
For completeness the two basic phases Olavson and Fry discuss are outlined below.
The first phase is the up-front analysis and objective setting. This phase consists of two steps. In the first step a thorough review of the drivers of complexity should be conducted. The focus of the analysis should be determined. Which products and what sorts of complexity are we trying to address. Chapter 4 discusses this issue in some detail. Once the focus has been determined the analysis of the costs is conducted. In practice this step involves a thorough review of the P&L to determine the largest cost categories. It also involves numerous interviews with experts to model some of the costs. Once a detailed understanding of the costs and how variety affects them is determined, the project moves into the second step.
In the second step the cost calculations are automated in a tool the business can use and useful rules of thumb are provided. In practice, although it is relatively easy to automate the
calculations, it is not as easy to strike the perfect balance between usability and detail.
Remember at this stage the tool will need to be used by everyday business people, so it has to be intuitive, simple to use and require as little user input as possible. For the tool to be integrated into the process, it must meet these criteria. The tool must be simple to use, since the focus of the company will be on getting products to market as quickly as possible so the process won't accommodate overhead activities.
In the second phase termed ongoing management, the process is used to evaluate new products. Once the input from the cost calculator is considered along with any strategic considerations, an informed decision is made. The reasoning and logic as to why the specific decision was made should be documented. Once the decision is made and documented, performance metrics should be monitored to ensure that the anticipated benefits from the program are experienced. In an
ever-changing business environment it is often difficult to determine if the benefits are experienced as expected. However it should be possible to perform a rough validation of the initial cost estimates. This feedback loop is an essential part of a mature process and should not be forgotten. However, it is often overlooked as new improvement opportunities are pursued.
CHAPTER 4: COMPEXITY MANAGEMENT AT IPG
4.1 What is an end item at Hewlett-Packard
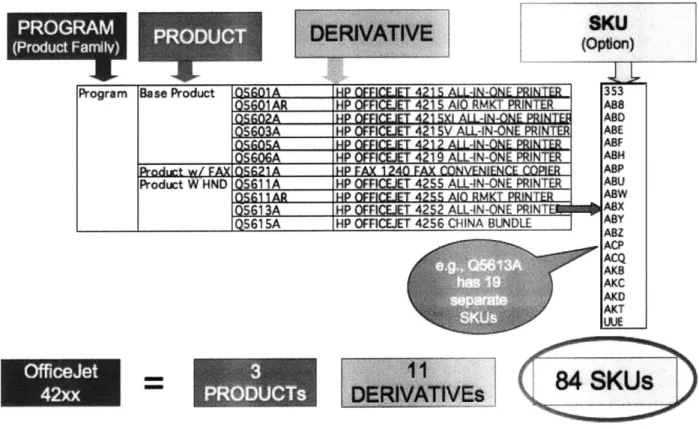
There are a number of ways to tackle product variety in the portfolio. The genealogy of a product is shown below. A number of products come from one program. The differences between products are substantial i.e. a base product then an added fax capability. A number of derivatives are then created from each of the products. These represent more minor differences such as different print speeds etc. The final stage of differentiation is the SKU or option code level. At this stage localization materials are added to tailor the product for a country or group of countries.
Program Base Product
Product *N Product W HN O-SG01AR OS902A 05603A QSGOSA S5AA AX 0921A D0G5611A
No
A
SKU
(Opton) HE E= 421s ALILAN-OE PRINER 353HP OFFC 19ET 4215 AJO RMKT PRtNTER ABS
"4P 4;~ 41 SX1 ALL-NEg PMI ABD
HP ZFF 421 5V ALL-4N-ONE PRINTER ABE
:1P OFFiJE 4;1,g AiLAJ-O PRINTER ABF
HP OFFICEUET 4219 ALLAN-ONE PNTR ASH
14P FAX 1240 FAX MDNVENIENCE CORIER ASP HP OFFICEJET 42SS ALLONONE PRINTER ABU
P FICFJt|E 4299 AIQ RMKT PRINTER ABW HP OFFICEJET 42S2 ALLON-ONE PRINT ASX
HP OFFKCEET 4256 CHINA WUNDLE M
AEK A8D ABE AB ASH AKO "T
Figure 4-1: Genealogy of an end item at Hewlett-Packard
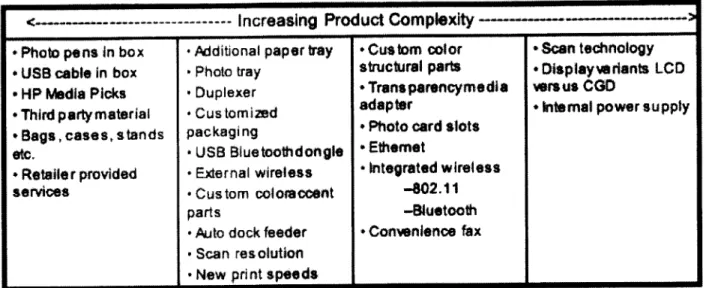
Table gives an example of the nature of some of the changes that distinguish different programs, products and derivatives.
PRGA
PROUC
Q!;f11IAft OS613A QSG1 SA
<---- - --- Increasing Product Complexity ---
---+ Photo pens in box - Additional paper tray Cus tom color + Scan technology
* USB cable in box -Photo tray structural parts -Displayvwdrants LCD
-HP Media Picks -Duplexer * Trans parencymedia versus CGD
*Third partymaterial -Customizd adapter * internal power supply
*Bags, case s, s tands packaging * Photo card slots
etc. - USB Bluetoothdongle * Ethernet
* Retailer provided -External wireless &Integrated wireless services , Custom coloraccent -0211
parts -Bluetooth
-Aito dock feeder * Convenience fax
-Scan resolution
New
print speedsFigure 4-2: The Complexity of Product Characteristics
4.2 Reducing the number of end items
Clearly if a program has 3 products, 4 derivatives and 20 options then there are 3x4x20=240 final end items which the consumer can purchase. To reduce the number of final end items we can reduce any of the number of products, derivatives or options. From the example we can see that there are a number of alternatives routes to reduce the size of the end offering.
1) Reducing the number of products by one would reduce the number of end items by 80. 2) Reducing the number of derivatives offered would reduce the number of end items by 60.
3) The most obvious Reducing the number of programs by one would reduce the number of
end items by 240.
4) Reducing the number of different option codes would reduce the size of the offering by 12.
At first appearance it would appear that reducing the number of option codes is the most ineffective means to reduce the number of end items. However each of the other methods
focuses on a particular program whereas reducing the number of end items would apply across programs. Therefore it there are 30 programs in existence the net effect will be to reduce the number of end items by 12x30 = 360.
Each of the programs, products or derivatives Hewlett-Packard offers addresses specific price points and feature sets. By removing a program, product or derivative there would be a
corresponding drop in the revenue earned by Hewlett-Packard. However, by consolidating the
option codes offered we can reduce the number of end items offered without any detrimental impact on revenue. For example if we currently have two different end items serving two different countries say Portugal and Spain, where the only difference between the two end items is the language in the manual. Now if we put two manuals into each printer's box (one for each of the countries we can serve either country with the same end item. It is reasonable to assume that there will be no decrease in the overall number of printers sold. By effectively pooling the demand in each of the countries we would expect to avail of all the usual advantages associated with pooling such as reduced setup time and reduced inventory requirements.
Even though we believe there are products that do not earn enough incremental revenue to offset the variety-adjusted costs associated with the increased complexity, it is a far harder proposition to gain marketing support to consolidate the offering by removing products with unique feature sets than it is to continue to offer the same feature set but to consolidate the localization
4.3 The Decision Making Approach
Before delving deeper into the calculations necessary to make an informed decision on variety management, it is beneficial to provide an overview of logic being used.
Quite simply what we are looking to determine is when do the benefits of offering additional variety outweigh the costs associated with offering that variety. Traditionally this means if I offer another product will the incremental revenue I receive by offering this product outweigh the costs associated with offering it. The incremental revenue has to take into account the revenue received net of any cannibalization of other products sales. The costs include set-up time etc.
If we focus on variety management at the SKU level this translates to when should I consider putting 2 power cords into a box to meet 2 different markets.
Lets run through some scenarios:
Suppose after conducting an extensive variety cost modeling exercise, we determine that the total cost of variety is $5,000 fixed set-up cost and a $0.40 variable cost per unit. Let's assume I have only 2 markets for example Australia and New Zealand. Let's further assume that the only difference between the two products sold in each of these markets is that the New Zealand end item has a unique feature which costs $1. The total variable cost for the Australian and New Zealand items is $0.40 and $1.40 respectively. Let's further assume that the demand in New Zealand is for 100 printers and in Australia it is 1000 printers
Scenario 1:
If we decide to supply 2 unique printers then the total cost is:
5,000 + 0.4*(100) + 5,000 + 1.4*(1000)
= $ 10,000 + 1,440 = $11,440
Scenario 2:
If we supply only one printer to both markets and incur the additional variable cost of $1 for all the items sold then.
5,000 + 1.4*(l100) $ 5,000 + 1,540 = $6,540
The cost difference between the two scenarios is now $11,440 - $6,540 = $4,900
In the 2nd scenario costs are reduced substantially. These costs are purely illustrative. The actual costs will be different for different companies using different processes and will also vary across different product families.
We can see the net effect of this type of consolidation is to transfer a substantial part of the cost from fixed costs to variable costs. Therefore, if the market sizes were one hundred times larger the total cost would be
Scenario l Scenario 2
5,000 + 0.4*(10,000)
+ 5,000 + 1.4*(100,000) 5,000 + 1.4*(1 10,000)
= $ 10,000 + 144,000 = $154,000 5,000 + 154,000 = $159,000
Now under scenario 1 we incur $5,000 less than under scenario 2. It is clear that there is an obvious trade off between costs associated with increasing the in-box materials and the savings in the form of variety adjusted cost reductions. It is clear that no one scenario will suit all products.
4.4 What is a good consolidation
Clearly in the previous example we would want to consolidate in the first scenario but not in the second because of the cost savings. This leads us to ask so what does a good consolidation look like and are there any easy ways to identify them. The subsequent paragraphs present the desirable characteristics of a consolidation.
Small additional spend: Good consolidations occur when there is little increase in the cost of additional in-box materials. This can be because the anticipated sales volumes or the per unit cost of the in-box materials consolidated is small. For example, if a phone cord cost 5 cents (and the power cord still costs $1), it is advantageous to consolidate products with different phone cords before consolidating products with different power cords.
Little impact on Revenue: If the product packaging is modified slightly we can see that there will be little impact on revenue. However, if the packaging is modified drastically so that it now appears cheap or confusing, then there may be lost sales.
Real dollar savings: In the example we chose to consolidate in scenario 1. It is worth examining the nature of the costs in more detail. When we calculate the cost of the additional in-box
material, it seems quite clear that the increase is real. The fact that we are certain of the dollar expense of power cords leads to this being termed "hard" costs. However, if we look at the savings and make the assumption that the $5k setup costs was spread across 50 people in person hours, then we might look at this saving differently. This type of saving is termed "soft" since we cannot be sure that the time saved will be redirected into value-add activities. If it is directed
into value-add activities what will they be worth? On the other end of the spectrum an argument could be made that the people would remain hired anyway and that this cost is in effect a sunk cost and should not be included. We may choose to deal with this by creating a range; however the range is likely to be very wide.
It is clear that costs of this nature are certainly different than say a $5k expenditure on a fixture for each product where we know the expenditure is exactly $5k. Therefore ideally we would like the majority of the savings to be in areas where the dollars are in some sense real. More on the
nature of the costs is covered in chapter 5.
4.5 Was it a good idea to offer this product in the first place
After a detailed investigation of the costs of variety is conducted, a clear understanding of the variety-adjusted profitability of an end item is determined. With this information in hand it is
relatively clear if it was truly profitable to offer the end item. Traditionally this decision is based on whether or not the benefits outweigh the costs. However it is likely that the firm has
numerous alternative product development opportunities. Clearly if R&D is a binding constraint, we will only want the R&D personnel to be engaged in projects where the return is in line with the company's expectations. If a company invested in all projects which were only marginally profitable, then the return on investment would approach zero given a sufficiently large capital investment. Instead most corporations target a return of approximately 10% in which case the products they release should provide a similar return. Therefore we should only release products that provide a return on investment which is comparable to that of the company. This
recommendation is well documented in the finance literature; however it was only specifically referred to in terms of complexity in Olavson and Fry, (2006).
CHAPTER 5: THE COST SAVING CATEGORIES
5.1 Complexity Costs
Until now we have talked about the nature of complexity costs generically and the only distinction we have made is the one between "hard" and "soft" cost categories in the previous chapter. At this point we are going to delve deeper into the cost categories individually.
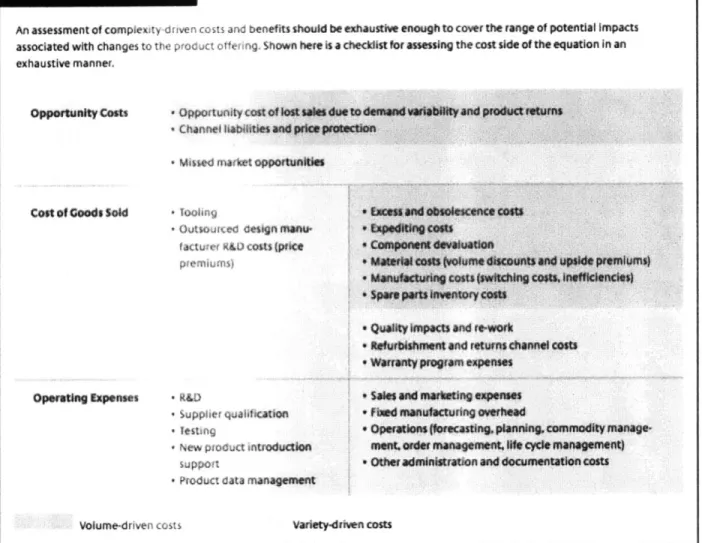
An assessment of complexi y di ven co st and benefits should be exhaustve enough to cover the range of potential Impacts associated with changes to the pf otct of ering. Shown here is a checdist for assessing the cost side of the equation In an exhaustive manner.
Oppoftunfty Cfsts
cot of Goods $ald
" opporunlty cost of y pduatmms
0 Channel ab4lies WW price protcbmti -Mused mark t opportunin
# Toofic
oitso esgimnu(
fa tw Ur ,O costs (price p em J~ fi
Oporatng Expenses *R&D
* upphr iualifritlon
l esting
New prO uct introducton suppo t
Pfroduct data managemMnt
* Qualty kW ct and rk
* Refmbishment and returns channel cot " WWrW"t program expenses
* Saw and adwting expenses * Fbdmanututufng overhead
* OWmtk 111ocecasting.planing, commodity anage. ment.omrdw mparagemerit. If cycnanagement)
" Ottwr adminfatravfon and documpentation costs
Volume-driven costs Varietydnven costs
Figure 5-1: Complexity Cost Checklist Olavson and Fry 2006
Figure 5-1 is provided in Olavson and Fry (2006) and details many of the cost categories that should be examined as part of a variety management effort. The figure distinguishes between three sets of costs, opportunity costs, costs of goods sold and operating expenses.
A further subdivision is made between variety and volume driven costs. Variety driven costs are costs which are driven by the number of distinct end items offered. In Olavson and Fry (2006) they state that there is a strong relationship between costs associated with handling product returns and portfolio size. They provide the following graph to highlight their point.
AVERAGE RETURN COST PER UNIT
Spring '03 Fall '04 Srng '0 0 nter '05 Summer '05 0 * ~Winter '04 ummor W0 Sum mer '04 6 0 Spring '03 Fall '03 Winter '03
NUMBER OF SKUS OFFERED
Figure 5-2: Example of Variety Driven Costs, Olavson and Fry 2006
While in practice the relationship may not be as obvious because of the presence of a number of other factors it can still be used to guide the analysis.
Volume driven costs are far better understood. There has been much written about the
economies of learning and economies of scale. With complexity we are forfeiting the chance to take full advantage of these effects. Olavson and Fry (2006) state with volume driven variety we will want to establish a "core" and an "extended" offering. The goal will be to steer as much demand as possible to the core offering. They provide the following guidance to direct the cost investigation effort.
"The relative importance of variety-driven and volume-driven complexity should follow from the up-front analysis in order to develop complexity cost guidelines. Generally speaking, product types requiring significant ongoing management or up-front investment will benefit from controls on variety-driven costs, and product types that require high volumes to achieve operational economies of scale will benefit from controls on volume-driven costs."
Olavson and Fry (2006) warn that is common to see variety management efforts that are not appropriately tailored. Indeed because different areas of the organization see the variety driven costs in different ways they typically start of with a preconceived notion of the best way to tackle the costs of variety. Indeed they provide the following anecdotal evidence based on their
experience.
"One personal computer business had focused almost entirely on balancing marketing benefits with (variety-driven) R&D costs in its ad hoc variety-management process. It was a surprise to some to learn that the volume-driven, supply chain costs exceeded the variety-driven R&D costs by a factor of 7-to-i. As a counter example, a high-end server business where a supply chain manager helped to initiate a variety-management project discovered that the R&D costs of variety exceeded the volume-driven supply chain costs by a factor of ten."
Now that we have discussed the volume driven and variety driven costs, it is important to realize that not all these costs are equal. Some are invested upfront and will become sunk costs from that point in time onwards. Some are "hard" costs which effect the cost of sales etc. Some are "soft" costs which represent time invested in certain ongoing activities e.g. planning. It is important to distinguish between these types of costs. One of the main reasons why it is so important is as the audience becomes more educated about the costs of variety it will look to this level of detail before agreeing to any consolidations.
Now that we have covered the nature of the costs in some detail I will provide some detail as to how to estimate what the actual costs are. Some of these methods are drawn on literature in activity based costing. We will then proceed to discuss some of the individual cost items listed in Figure 5-1.
5.2 Estimating the Costs of Variety.
After determining the relevant cost categories there are a number of ways to estimate costs. As we discussed earlier there are broadly two types of complexity driven costs, namely variety and volume driven costs. We will discuss methods which are broadly suited to estimating these types of costs.
Variety Driven Costs:
One of the most common methods is to discuss the costs with the business users and try to determine what drives the effort they must put into each item. In R&D you can discuss how much effort it takes to develop a new end item. At this point you'll discover to what extent end
items are influenced by complexity of design and previous product development.
A simple discussion may reveal that it takes 4 R&D personnel 4 hours or 0-5 days each to develop a new end item. The average salary for R&D personnel may be 5300 per day. In this
case then the total effort may be quantified as 4 x 0-5 x 300 = $600. After delving deeper we may find that it depends on what extent the new end item is leveraged off of previous R&D work. In which case we may decide to provide a range estimate of for example $400 -$1000.
We may simple prefer to multiply it by a percentage which indicates to what extent the new item is leveraged on previous R&D work e.g. 50%; therefore anticipated cost is now $600 x 0-5 $300.
Figure 5-3: Example implementation of Variety Costs
From Figure 5-3 we show how it is also desirable to make the costs easy to modify or to deselect them altogether. This is very useful in client meetings to advance the discussion to bring parties to agreement.
Although it is desirable to strive for accuracy at all stages, 100% accuracy is not required. After the data is collated a number of checks will be performed and in general the estimation errors in each of the cost elements will to some extent average out. The business experts will most likely need reassurance that their inputs are the best available and that they will be rationalized before actions are taken based on them.
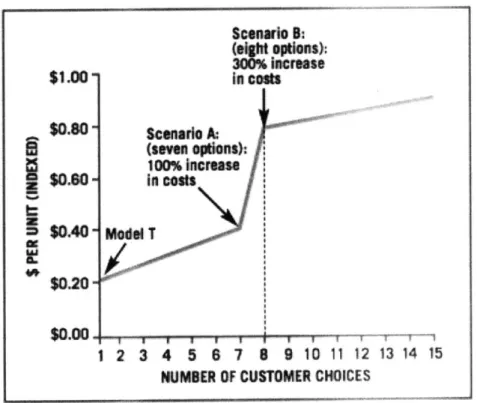
Another approach to modeling variety driven costs is provided by, Gottgredson and Aspinall
(2005). They propose what they term a Model T analysis. To perform a model T analysis you
have to "set the baseline". To set the baseline you have to identify what the situation would look like if you only made one product. Operationally this means that if we currently spend $100,000 in R&D each year to deliver 20 products, what would it cost to deliver just one. Is it 100,000/20 = 5,000 per product or is most of the investment up front with marginal incremental investment required. That is 50,000 for the first product and 50000/19 = $2,632 for each additional product. To illustrate the methodology the authors provide the following example.
$1.00' $0.60 - $0.40-$0.20 $0.00. Scenaio B: %Coptions):
SIncrease
In cots Scenario A (seven opdons) 100% Incres In costs Moe T 4 5 8 7 B 9 10 11 1 NUMBER OF CUSTOMER CHOICE1
2 3
Figure 5-4: Example implementation of Variety Costs
In Figure 5-4 we see an example of an industrial supplier that saw that by offering one additional option caused a huge leap in costs. Therefore it decided that offering seven options was optimal for its business.
2 13 14 15
Volume Driven Costs:
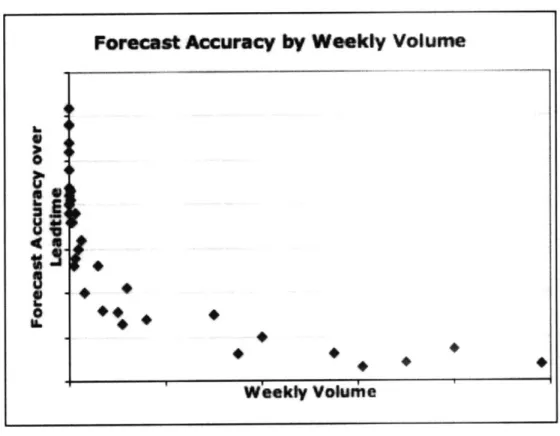
Many costs are influenced by volume. We noted earlier that learning and scale economies are two of the most obvious. In general forecast accuracy improves as volume increases.
Improvements in forecasting result in decreases in inventory related costs as the company can better predict demand. Traditional inventory theory focuses on what is termed the "holding costs" which covers the opportunity cost of the capital tied up in the inventory as well as the costs of physically carrying the inventory e.g. warehouse space costs, storage taxes, insurance, breakage, spoilage. In Gianpaolo Callioni, et al (2005) states that these costs account for only
10% of the inventory-driven costs experienced by Hewlett-Packard. The article further describes four major cost categories of inventory driven costs. These are component devaluation costs, price protection costs, product return costs and obsolescence costs. I will discuss these further in the next section where we delve into each of the cost categories. For now it is sufficient to say
that these inventory driven costs are substantial and provide us ample motivation for the example of how to estimate how variety influences volume.
"Excess inventory was the main driver of Hewlett-Packard's PC costs; one year, in fact, inventory driven costs equaled the PC business's total operating margin."
Gianpaolo Callioni, et al (2005).
In order to determine how forecasting accuracy is impacted by volume it is useful to plot one against the other. For purely illustrative purposes, a plot of the weekly product volume against the forecast accuracy over the lead-time using fictitious data is shown in Figure 5-5. The graph illustrates the widely known fact that forecast accuracy is extremely poor for low volume products and improves dramatically as the volume increases.
Figure 5-5: Example of Volume Driven Costs
Now we have a rough description of the relationship from the graph, we need to fit a model to provide us with a simple summary of the relationship. If we change the x-axis to show
log(volume) it will make the relationship linear. Now we can fit a linear regression to the data to provide the summary information.
Forecast Accuracy by Weekly Volume
Forecast Accuracy by Weekly Volune
Figure 5-6: Linear Regression of forecast accuracy and volume
In practice the model will not fit the data as well as that used in the illustration but it should still provide useful information.
Now that we have described each of the costs categories and some estimation methods at a high level, it is now time to discuss each of the cost categories. The inventory related costs discussed in the next section are discussed in detail Gianpaolo Callioni, et al (2005).
5.3 Market Development Funds
Retailers hold inventory on behalf of HP. In order to help retailers move HP stock, HP pays the retailers some amount of money. The retailers can then use this to run advertisements etc. This is done in order to incentivize the retailer to sell HP branded goods in lieu of competitor's goods
such as Canon or Lexmark. It is also done to help prevent returns since these are often costly. It may be better to give a certain retailer an additional $20 off a product that to incur a $30
shipping cost in returns.
37
I6
5.4 Price Protection
If HP dropped the retail price of a product after units have already been shipped to a sales
channel, it sometimes reimburses its channel partners for the difference for any units that had not yet sold, so the channel partner didn't end up selling at a loss. Given how quickly price drops for electronic items this exposes HP to substantial price protection risks. For example if a channel partner might buys a product from HP when the prevailing market price was $1,000 and then the item sold five weeks later at a new price of $950, HP will reimburse the $50 difference.
5.5 End of Life Funds
Since finished good inventory is held locally there are a number of measures which HP takes to minimize potential product excess due to the difficulties in matching supply and demand at the local level. If the product excess exists at an individual retailer rather than across a channel, Hewlett-Packard will use the end of life funds to cut the sale price of a product to stimulate demand to meet supply. This typically occurs at the end of a products lifecycle when the current generation product must be cleared out of the store to make way for the future generation.
Unfortunately this eats into profitability and is often quite an expensive practice.
5.6 Returns
All of HP's printers are sold with a product warranty and the ability to return the product within a specified time period. With additional offerings comes the potential for customer confusion. As the customer becomes more and more confused the likelihood that they will return the product to HP increases. For example suppose there are two printers where the only difference
between the two products is that one prints at 36ppm and the other at 28ppm. As a customer I may purchase the 36ppm printer and then decide that since the effective printing speed is slower to return it and purchase the 28ppm model. This option would obviously not exist if there was only one printer offered.
Retailers are another source of returns. Distributors can simple return unsold goods to Hewlett-Packard for a full refund. In a sense this is like 100% price protection costs. Callioni (2005) says in one case that "product returns constituted more than 10% of the product's revenue, not because of product failures but because resellers were returning excess inventory". They further state that apart from increasing additional "operational costs (shipping, handling, product
retesting, and the like), returns lengthened the time a product spent in the supply chain before reaching an end user, increasing HP's exposure to additional devaluation risks and inventory finance costs".
The relationship between returns and variety was illustrated in Figure 5-2. Returned products are usually refurbished and sold on however this is a costly process.
5.7 Warranty
Warranty costs also tend to increase with variety. HP like many other companies operates a number of customer service centers where customers can call in with any issues they experience. The costs associated with training personnel increases when the number of items increases. A more subtle argument often made is that if engineering has less time to devote to proper testing, warranty claims will be higher and that further engineering resources will have to be devoted to root cause analysis of the customer faults.
CHAPTER 6: THE INCREASE IN LOCALIZATION MATERIALS
6.1 What are localization materials
An inkjet printer is sold with a number of items which are used to customize it for the end market.
- Windows CD: Printer installation CD for Microsoft Windows platform * Macintosh CD: Printer installation CD for Microsoft Windows platform - e-document CD: Electronic version of manual and other documentation " Quick Guide: This is a short set of instructions on how to get started quickly e Manual: This is the full manual
* Bezel/Overlay: This is the plastic part of the printer which contains the numbers and
" Stickers Overlay: There are a number of stickers on the box for regulatory reasons or for promotional reasons. For example where to buy ink
" Setup Poster: A poster on how to set up the printer may be included. * Power cord: A power cord for the local country/ region.
* Phone cable: A phone cable for the local region if the printer has fax capability * Blue Bag: In some countries a special antistatic bluebag is a regulatory
requirement.
Error! Reference source not found. below highlights some of the complexity that retailers are facing in some of the dimensions listed above. With 28 languages 7 different power cords and
17 different phone cords it is easy to imagine just how many end combinations there are in such a market.
28 different credn .jud ra h languages Piuaniani NorwVegian -0 is, h crtuguese Rkormanian Rus s ian an* Sivk Slvenian dsh
7 different power cords (plugs)
17 different phone cords (plugs)
Figure 6-1: Complexity Facing Retailers in Europe
6.2 Sample calculations
In order to determine the effect of combining different end items we need to get the costs of each of the components. Once we determine the costs of each of the end items it is an exercise in simple arithmetic to determine what the incremental cost is for combining two end items.
For example we know that the only difference between the end items sold in Ireland and England is a different phone cord and we know that the phone cord for Ireland costs $0.50. To determine what the incremental cost is if we combine the two end items we need to determine the increased cost of adding the phone chord for Ireland to the England sales volume and the cost of adding the phone cord for England to the Ireland units. Thus we can take the forecasted volume for
England and multiply it by $0.50 as the cost for Ireland and then conduct a similar exercise for Ireland and sum the two to find the total.
6.3 Practical considerations
Remember if we want to have standard option codes we will have to do this for all products that ship to each area. These products may be vastly different, from low to high volume and from rather inexpensive printers to extremely expensive printers. However if we are not overly
concerned with having the same option code for each printer then we can customize the localization materials individually for each platform, product family or derivative.
In many cases this cost estimated from the prior example is a conservative one. On each of the dimensions there are a number of measures the business can take. For example if we apply the same logic to manuals and put an Ireland and an England manual in each box and we determine that the resulting increase in costs is substantial, the business may decide to reduce the number of pages to reduce the cost or switch to supplying the materials in electronic format. The business may also decide to pictorially represent many items to overcome any language issue. For power cords, plug adapters come with many products; indeed many laptops ship with two pronged power cords in Europe to minimize the problem of having to accommodate so many varieties of plug ends.
There are also a number of practical considerations that have to be taken into account. For example the box that the printer is shipped in is of limited size and we will not want to increase the size of the overall package, since this may increase the shipping cost if it reduces the number of printers that can fit on a pallet. There are other considerations too. The surface area of the box will determine the number of stickers that can fit on it. Similarly, there is a limit to the number of languages that will fit on a CD.
Strategically we will want to make sure that the consolidations make sense. For example even if we could fit eight power cords in a box and it was economically justified, we may not want to since it may confuse the end customer. In the case of putting eight language stickers on a box the business may decide that it makes the product appear lower quality.
Finally, as we decide which consolidations to make we need to be cognizant of our customers cultural sensitivities. For example we may not want to combine a China and a Japan product because of the historical tensions between the countries. Within the calculation we assumed that when we consolidated option codes there would be no loss in revenue. We have to ensure that the changes are perceived as minor in order for this assumption to hold.
CHAPTER 7: IMPLEMENTATION OF COMPLEXITY REDUCTION
At Hewlett-Packard a number of complexity management initiatives had already been conducted. Raphel, Aaron (2005) and Landivar Chavez, Jose (2006) were two LFM projects which focused on complexity management for desktop computing and servers respectively. With this in mind the broader organization was supportive of the effort and in particular senior management
already had expectations as to how much variety should be reduced across the business. Each of the regional business units in the Americas, EMEA and Asia began its own investigation into the
directive.
7.1 Challenges and Opportunities
Senior management had set an ambitious goal for each of the businesses to substantially reduce variety. However how this was to be achieved was left entirely up to each of the businesses. Indeed the final decision as to how much variety was to be reduced was also left up to each of the businesses. The first challenge then was to identify what was the most appropriate level of the organization to engage to begin the variety reduction program. Figure 7-1 illustrates the organizational structure of the Imaging and Printing Group (IPG). At the top level the GBUs are responsible for deciding which platforms to bring to market. Each regional unit is responsible for determining how to bring each platform to its market. Therefore if the project focused on platforms, the GBU would be the main point of contact; however if we focused on final end
items, the regional players would be the most appropriate point of contact.
Figure 7-1: Organizational Structure of IPG Business Unit
Initially the project was focused at the regional level. This was mainly driven by the initial senior management interest in the project and also by the belief that by starting higher up the value chain we may be able to make the biggest impacts.
Landivar Chavez (2006) provides the following illustration of how the difficulty in
implementing product changes is influenced by the stage of the product that is tackled. It also shows his estimate of the Pay-off for the server division.
PNy-off Implemcntation
4atd,
Medium~