CRISPRi Screens to Identify Combination Therapies for the Improved Treatment of Ovarian Cancer
By
Erika Daphne Handly B.S. Chemical Engineering Brigham Young University, 2014
Submitted to the Department of Biological Engineering in partial fulfillment of the requirements for the degree of
Doctor of Philosophy in Biological Engineering at the MASSACHUSETTS INSTITUTE OF TECHNOLOGY
February 2021
© 2020 Massachusetts Institute of Technology. All rights reserved.
Signature of author……… Erika Handly Department of Biological Engineering February 2021
Certified by……… Michael Yaffe Director MIT Center for Precision Cancer Medicine Department of Biological Engineering and Biology Thesis Supervisor
Accepted by………... Katharina Ribbeck Professor of Biological Engineering Chair of Graduate Program, Department of Biological Engineering
2
Thesis Committee members
Michael T. Hemann, Ph.D. Associate Professor of Biology
Massachusetts Institute of Technology Douglas A. Lauffenburger, Ph.D. (Chair)
Ford Professor of Biological Engineering, Chemical Engineering, and Biology
Massachusetts Institute of Technology
Michael B. Yaffe, M.D., Ph.D. (Thesis Supervisor) David H. Koch Professor of Science
Prof. of Biology and Biological Engineering Massachusetts Institute of Technology
3
CRISPRi Screens to Identify Combination Therapies for the Improved Treatment of Ovarian Cancer
By
Erika Daphne Handly B.S. Chemical Engineering Brigham Young University, 2014
Submitted to the Department of Biological Engineering in partial fulfillment of the requirements for the degree of Doctor of Philosophy in Biological Engineering
ABSTRACT
Ovarian cancer is the fifth leading cause of cancer death for women in the United States, with only modest improvements in patient survival in the past few decades. Standard-of-care consists of surgical debulking followed by a combination of platinum and taxane agents, but relapse and resistance frequently occur. To identify genes that confer sensitivity or resistance in tumor cells treated with platinum chemotherapeutics, I performed genome-wide screens combining cisplatin or oxaliplatin with CRISPRi pooled gene knockdowns. Screens were analyzed at 9-days to mimic patient care, and at 48-hours to isolate the short-term DNA damage response. Genes whose knockdown caused sensitivity to the platinum chemotherapeutics were identified through a multi-objective optimization approach to account for knockdown efficiencies and variances in sequencing depth. To filter the noise in the genome-wide screen and more confidently identify ‘hits,’ a smaller pooled CRISPRi screen of four hundred targets was designed, and a few ‘hits’ were validated. Interestingly, knockdown of FAAP24, a component of the FA core complex, was found to sensitize multiple ovarian cancer cells to platinum compounds, and thus may be a promising candidate for a combination treatment with oxaliplatin and cisplatin.
Chapter 5 details an implementation of a combination therapy with cisplatin using peptide nanoparticles. Peptide nanoparticles are a promising therapeutic for the delivery of siRNA and allow for targeting of specific proteins that are difficult to inhibit with small molecular inhibitors; specifically, nanoplexes allowed for the targeting of the REV3 protein, the catalytic component of the translesion synthesis polymerase. Interfering with REV3 expression through siRNA has a synergistic effect with cisplatin treatment in both human and mouse models of lung cancer, indicating that REV3 is an excellent target to combine with cisplatin therapies. This REV3 knock-down sensitivity was also extended to human ovarian cancer cell lines, indicating the potential of the combination treatment for both lung and ovarian cancers.
Thesis Supervisor: Michael B. Yaffe
4
Acknowledgments
I would like to thank everyone who made the work for my thesis possible, specifically the Ovarian Cancer Research Foundation (OCRF), the Koch Institute of Integrative Cancer Research, the Biological Engineering Program at MIT, and the Center for Precision Cancer Medicine (CPCM) for providing the funding for this work. I would thank my advisor, Michael Yaffe, for his scientific insights, support both in science and in life, and dedication to the proper training of young scientists. He is an excellent hypothesis generator and has an ability to connect topic that most people would think are disparate fields due to his eclectic interests. My thesis committee, Douglas Lauffenburger and Michael Hemann, gave fantastic ideas and progressed the work on the project greatly. My lab-mates were instrumental for teaching me lab techniques, engaging in scientific discussion, and keeping me sane. Special acknowledgements for Yi Wen Kong, Christian Braun, Tatiana Netterfield and Jesse Patterson for directly helping me on my work. Thank you for also being kind and fun to work with. Also, special thanks to my bay mates Tatiana Netterfield and Sriram Ganapathy for talking about life and science, and making coming into work fun and positive. Brian Joughin and Pau Creixell were very patient helping me with any and all computation questions. Additionally, thank you to all the people who entertained me in tissue culture and kept me entertained during long tissue culture sessions; notable good talkers include Ian Cannell, Bert van de Kooij, Karl Merrick and Sanjeev Dhara. Leny Gocheva, the director of research at the Koch Institute, has always taken time to be supportive of me, provide words of encouragement, and is amazing at editing (with quick turnarounds!). Thank you to our lab support team – Susanne Swartwout, for keeping the lab functional and working with a chaotic group of scientists, and Tom Dietzel, for keeping Mike on track and being master of the schedule.
I had some great mentors through undergraduate work as well that should be mentioned. William Pitt let me research in his lab as a freshman in undergraduate, and gave me one of my first experiences with biomedical research. Brian Woodfield also mentored me as an early researcher and was very fun, intelligent, and inspirational. Christian Metallo let me study under him for a summer internship with the Amgen program, and the skills I learned in that lab were the most relevant to my research today. I would not have been prepared for MIT without that internship and his guidance. Finally, I would like to thank Dr. Todo, Dr. Hiroshi, and Dr. Asahi, who let me study with them at Hokkaido University and who worked extremely hard to teach me in English when it was not their primary language (I speak Japanese, but my science Japanese vocabulary is limited). I was very lucky to have the opportunity to study with them.
I come from a wonderful family who has been supportive of every venture I have chosen to pursue. My parents, Paul and Kyoko Handly, are a constant source of support and encouragement, and obviously played a crucial role in who I am today. I am very grateful for everything they have done, and continue to do. My siblings, Naomi and Jonah, are a source of inspiration and fun, and my older sister Naomi has been leading the way in academic studies since I was born. I have a great role model in her. My husband, Seth Vogel, has done a great job encouraging me to work hard and has been a source of comfort and commiseration when science does not work. With Seth,
5
I gained a whole other family as well, who have been supportive and encouraging to me as well. My grandpa, Tatsuo Izumi, believed in my scientific abilities very early on, and invested time in learning about the biomedical sciences and set me up with my first internship studying diabetes. He emphasized hard work and I miss his random phone calls in my life.
My thanks extend to a whole community of friends, roommates, and classmates (not necessary in distinct categories) who have been inspirational and supportive of me. The Biological Engineering program has been a great community of classmates to study and grow with. Specific thanks to Ally Huang – for being a great roommate and friend, George Sun – for supporting me through my first few times trying to do computational work and being a hilarious friend, and Malvika Verma – for being my running buddy and keeping me physically and mentally healthy through graduate school. Corinne Saltzman was a great roommate through graduate school, and still motivates me to work hard and have fun. My undergraduate roommate, Heidi Carlston, is still one of my best friends and person I go to for random fun ideas and just generally life advice. My church community in general has always provided support and reassurance, and helped keep my faith strong through graduate school.
Finally, I would like to acknowledge some key inspirations for going into cancer research. I have multiple family members who has have died of cancer, which has shaped my career trajectory and has motivated me to join the "fight" against cancer. My grandmother, Setsuko Izumi, died while I was young of pancreatic cancer and my aunt, Oko Izumi, died of breast cancer while I was in High School. Both cases were jarring and demonstrated the devastating effects that cancer can have on a family. While I was in college, my grandmother, Cristel Handly, died of high grade serous ovarian cancer, which is the same type of cancer I have the opportunity to study today. I am grateful I have had so many good people in my life who still continue to motivate me to try harder to find cures for these diseases that are so frustrating.
6
Table of Contents
ABSTRACT ...3 ACKNOWLEDGEMENTS ...4 TABLE OF CONTENTS ...6 LIST OF FIGURES ... 9 LIST OF TABLES ... 12 LIST OF ABBREVIATIONS ... 14 CHAPTER 1: INTRODUCTION ... 161.1 Ovarian cancer background... 16
1.1.1 Ovarian cancer treatment ... 18
1.1.2 Cell of origin for ovarian cancer ... 20
1.2 Chemotherapeutics investigated ... 21
1.3 Screening background ... 23
1.3.1 CRISPRi background ... 23
1.4 Thesis Overview ... 26
CHAPTER 2: CRISPRI 9-DAY GENOME WIDE SCREEN ... 28
2.1 Introduction ... 28
2.1.1 Ovarian cancer cell lines ... 28
2.1.2 Drug dosages and screen duration ... 29
2.1.3 CRISPRi screen layout ... 29
2.2 Methods ... 30
2.3 Results ... 48
2.3.1 Cell line selection ... 48
2.3.2 Read Mapping ... 51
2.3.3 HITSelects ... 52
2.3.4 Guide-set Enrichment Analysis ... 57
2.3.5 MAGeCK Analysis ... 61
2.3.6 DNA damage response analysis ... 67
2.3.7 Comparison to clinical data ... 71
7
2.4 Discussion ... 78
CHAPTER 3: CRISPRI 9-DAY TARGETED SCREEN ... 81
3.1 Introduction ... 81
3.2 Methods ... 81
3.3 Results ... 93
3.3.1 MAGeCK analysis ... 93
3.3.2 Comparison of three cell lines ... 94
3.3.3 Comparing HITSelect and guide-set enrichment analysis ... 99
3.3.4 Gene signatures previously developed in literature... 101
3.3.5 FAAP24 as a novel target to validate ... 103
3.4 Discussion ... 108
CHAPTER 4: CRISPRI 48-HOUR GENOME WIDE SCREEN... 111
4.1 Introduction ... 111
4.2 Methods ... 111
4.3 Results ... 112
4.3.1 MAGeCK analysis ... 112
4.3.2 DNA damage response analysis ... 116
4.3.3 9-day versus 48-hour comparison ... 116
4.3.4 Comparison to clinical data ... 124
4.4 Discussion ... 129
CHAPTER 5: REV3 AND CISPLATIN SENSITIVITY IN LUNG CANCER ... 131
5.1 Introduction ... 131
5.2 Methods ... 134
5.3 Results ... 135
5.4 Discussion ... 144
CHAPTER 6: CONCLUSIONS AND FUTURE DIRECTIONS ... 145
6.1 Conclusions ... 145
6.2 Future Directions ... 150
8
APPENDIX ... 169
I. Vector maps ... 169
II. Gene ontology enrichments for HITSelect analysis for 9-day genome-wide screen ... 172
III. GSEA analysis for 9-day genome-wide screen ... 197
IV. Targeted screen pooled library genes ... 200
V. sgRNA rankings in 9-day targeted screen ... 206
VI. Screen quality controls ... 212
9-day screen ... 212
9-day targeted screen ... 213
9
List of Figures
Figure 1: American Cancer Society 2020 estimates for cancer deaths in women in the United
States ... 16
Figure 2: Two common types of ovarian tumors ... 17
Figure 3: McGuire et al. clinical trial for cisplatin and paclitaxel9 ... 18
Figure 4: Age-adjusted ovarian cancer mortality rates* by Age Group and Race/Ethnicity, 1975-201512 ... 19
Figure 5: Diagram of the origin of high grade serous ovarian carcinoma ... 21
Figure 6: CRISPRi system uses dCas9 ... 24
Figure 7: CRISPRi screen layout ... 30
Figure 8: CRISPRi sgRNA for Rev3 binding sites shown relative to the entire Rev3L gene ... 32
Figure 9: CRISPRi sgRNA for Rev3 binding sites ... 32
Figure 10: Rev3 mRNA expression levels relative to Gal4 control ... 33
Figure 11: Single cell clone expression levels of REV3 ... 34
Figure 12: Competition assay schematic ... 35
Figure 13: Competition assay to determine drug dosages for cisplatin, oxaliplatin, and 5-FUR . 36 Figure 14: REV3 competition assay schematic ... 38
Figure 15: Competition assay to see the effects of sgREV3 knock-down with cisplatin and 5-FUR treatment ... 38
Figure 16: Ovcar8 dCas9 cells infected with CRISPRi library express both BFP and GFP ... 40
Figure 17: Viral titer for CRISPRi libraries 83969 and 83970 ... 41
Figure 18: Combined infections with viral libraries 83969 and 83970 ... 42
Figure 19: PCR checks to determine what quantity of gDNA was appropriate to use to process samples ... 44
Figure 20: Cisplatin dose-response curves for three high grade serous ovarian cancer cell lines 49 Figure 21: Clustering of high grade serous ovarian cancer cell lines for mRNA expression of p53 downstream gene markers... 50
Figure 22: P53 downstream activity in 4 ovarian cancer cell lines ... 51
Figure 23: Correlation of CPMs between replicates ... 52
Figure 24: GOrilla analysis of HITSelect ranking of the 9-day screen for cisplatin treatment .... 53
Figure 25: GOrilla analysis of HITSelect ranking of the 9-day screen for oxaliplatin treatment 54 Figure 26: REVIGO analysis for cisplatin depleters ... 55
Figure 27: REVIGO analysis for cisplatin enrichers ... 55
Figure 28: REVIGO analysis for oxaliplatin depleters ... 56
Figure 29: REVIGO analysis for oxaliplatin enrichers... 56
Figure 30: Guide-set enrichment visualization for cisplatin ... 57
Figure 31: Guide-set enrichment visualization for oxaliplatin ... 58
Figure 32: GSEA analysis of guide-set enrichment analysis for cisplatin depleted category ... 59
Figure 33: GSEA analysis of guide-set enrichment analysis for cisplatin enriched category ... 59
Figure 34: GSEA analysis of guide-set enrichment analysis for oxaliplatin depleted category ... 60
Figure 35: GSEA analysis of guide-set enrichment analysis for oxaliplatin enriched category .. 60
10
Figure 37: MAGeCK gene ontologies that were depleted in the cisplatin 9-day screen ... 62
Figure 38: MAGeCK gene ontologies that were enriched in the cisplatin 9-day screen ... 63
Figure 39: MAGeCK gene ontologies that depleted in the oxaliplatin 9-day screen ... 63
Figure 40: MAGeCK gene ontologies that depleted in the oxaliplatin 9-day screen ... 64
Figure 41: MAGeCK pathway analysis visualized on Pathview ... 65
Figure 42: MAGeCK pathway analysis visualized on Pathview ... 66
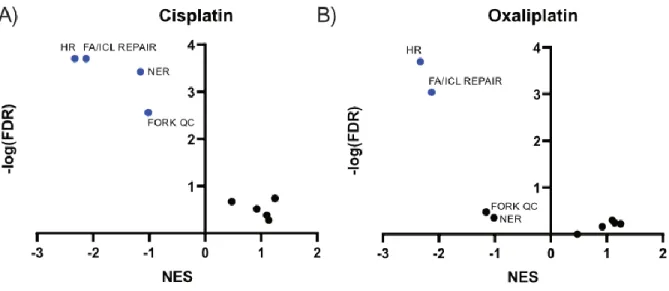
Figure 43: GSEA analysis of enrichments of known DNA damage pathways ... 68
Figure 44: GSEA enrichment plots comparing homologous recombination and nucleotide excision repair in cisplatin and oxaliplatin treatment. ... 68
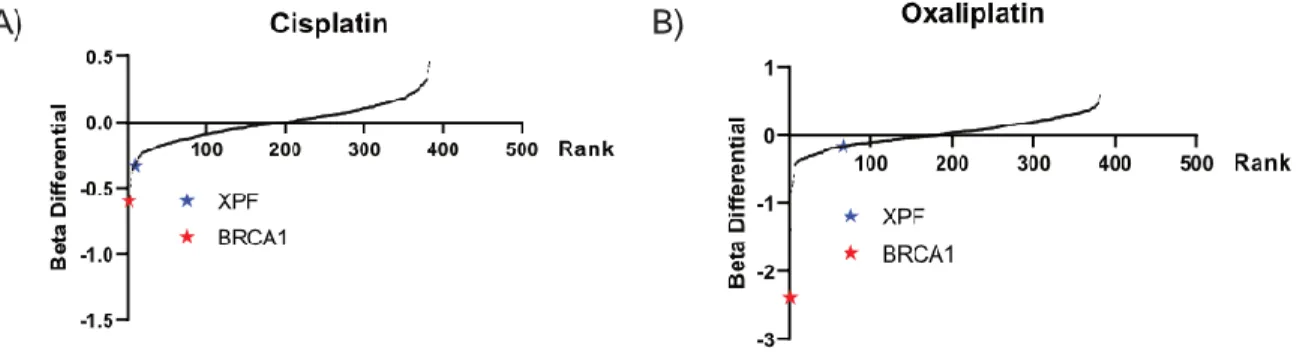
Figure 45: Comparison of BRCA1 and XPF in ovcar8 targeted screen ... 69
Figure 46: Competition assay comparing NER and HR importance in cisplatin and oxaliplatin treatment ... 70
Figure 47: Relative mRNA levels of BRCA1 and XPF siRNA knock-downs ... 70
Figure 48: Mageck 9-day cisplatin CRISPRi screen correlation with TCGA mRNA ovarian cancer expression data ... 71
Figure 49: Mageck 9-day oxaliplatin CRISPRi screen correlation with TCGA mRNA ovarian cancer expression data ... 73
Figure 50:MAGECK-MLE analysis of cisplatin versus oxaliplatin 9-day genome-wide treatments ... 77
Figure 51: MAGeCK gene ontologies that showed greater depletion in cisplatin compared to oxaliplatin treatment ... 77
Figure 52: MAGeCK gene ontologies that showed greater depletion in oxaliplatin compared to cisplatin treatment ... 78
Figure 53: PLK2 levels in ovarian cancer cell lines ... 82
Figure 54: Determining dosages for targeted screen ... 83
Figure 55: Infection rate for 3 ovarian cancer cell lines in targeted screen ... 85
Figure 56: Flow chart illustrating the curation of the targeted screen library ... 90
Figure 57: Targeted screen MAGeCK results for cisplatin ... 93
Figure 58: Target screen MAGeCK results for oxaliplatin ... 94
Figure 59: Overlap of cisplatin depleters for three ovarian cancer cell lines ... 95
Figure 60: Overlap of cisplatin enrichers for three ovarian cancer cell lines ... 95
Figure 61: Overlap of oxaliplatin depleters in three ovarian cancer cell lines ... 96
Figure 62: Overlap of oxaliplatin enrichers for three ovarian cancer cell lines ... 96
Figure 63: Achilles comparison of gene essentiality in HGSOC with BRCA1 mutations ... 98
Figure 64: Achilles comparison of gene essentiality in HGSOC with BRCA2 mutations ... 98
Figure 65: Comparison of GSEA enrichment analysis of Fanconi anemia and interstrand cross-link repair pathways ... 99
Figure 66: Gene set enrichment analysis for cisplatin depleters... 100
Figure 67: Overlap of gene signatures with targeted screen ‘hits’ ... 103
Figure 68: Heat map of sensitivity levels of select targeted screen 'hits' ... 104
Figure 69: Kaplan-Meier Survival outcomes for serous ovarian cancer patients with FAAP24 overexpression ... 104
11
Figure 70: Competition assay for siRNA knock-down of FAAP24 with cisplatin and oxaliplatin
treatment ... 106
Figure 71: CTG analysis of siFAAP24 with cisplatin treatment ... 106
Figure 72: Relative viability calculated by bliss independence for cisplatin treatment ... 107
Figure 73: CTG analysis of siFAAP24 with oxaliplatin treatment ... 107
Figure 74: Relative viability calculated by bliss independence for oxaliplatin treatment ... 107
Figure 75: Competition assay to determine drug dosages to use for cisplatin and oxaliplatin in 48- hour screen ... 112
Figure 76:MAGeCK analysis for 48-hour screen for cisplatin ... 113
Figure 77:MAGeCK analysis for 48-hour screen for oxaliplatin ... 113
Figure 78: Gene ontology for 48-hour screen for cisplatin depleters ... 114
Figure 79: Gene ontology for 48-hour screen cisplatin enrichers ... 114
Figure 80: Gene ontology for 48-hour screen oxaliplatin depleters ... 115
Figure 81: Gene ontology for 48-hour screen oxaliplatin enrichers ... 115
Figure 82: GSEA analysis of DNA damage specific gene sets ... 116
Figure 83: Overlap of the 9-day and 48-hour genome screen ... 117
Figure 84: Mageck 48-hour cisplatin CRISPRi screen correlation with TCGA mRNA ovarian cancer expression data ... 125
Figure 85: Mageck 48-hour oxaliplatin CRISPRi screen correlation with TCGA mRNA ovarian cancer expression data ... 127
Figure 86: Translesion Synthesis Pathway ... 132
Figure 87: siRNA treatment of TLS components to determine cisplatin sensitivity ... 136
Figure 88: siRNA effects alone for TLS components ... 136
Figure 89: mRNA levels measured by qPCR for TLS components ... 137
Figure 90: Ovcar8 translesion synthesis sensitivity ... 138
Figure 91:KP tumor development and transduction with luciferase-GFP ... 140
Figure 92: Cisplatin and nanoplex-siRNA treatment schedule... 141
Figure 93: Tumor burden of KP mice treated with siControl+Cisplatin or siREV3+Cisplatin . 142 Figure 94: H&E staining for comparison of siControl+cisplatin treatment versus siREV3+cisplatin treatment ... 143
12
List of Tables
Table 1: 5’ amplification primers for sgRNA regions of gDNA ... 44
Table 2: PCR reactions components ... 45
Table 3: List of cell lines tested to use for the screen ... 48
Table 4: Quadrant II gene ontology enrichments for TCGA vs. CRISPRi 9-day cisplatin screen data ... 72
Table 5: Quadrant III gene ontology enrichments for TCGA vs. CRISPRi 9-day cisplatin screen data ... 72
Table 6: Quadrant IV gene ontology enrichments for TCGA vs. CRISPRi 9-day cisplatin screen data ... 73
Table 7: Quadrant I gene ontology enrichments for TCGA vs. CRISPRi 9-day oxaliplatin screen data ... 74
Table 8: Quadrant II gene ontology enrichments for TCGA vs. CRISPRi 9-day oxaliplatin screen data ... 74
Table 9: Quadrant IV gene ontology enrichments for TCGA vs. CRISPRi 9-day oxaliplatin screen data ... 76
Table 10: 5’ amplification primers for sgRNA regions of gDNA for targeted screen ... 89
Table 11: PCR reaction components... 89
Table 12: Gene set enrichment analysis summary ... 101
Table 13: Overlap of top 1000 ‘hits’ from 9-day and 48-hour genome wide screen for cisplatin and oxaliplatin depleted and enriched categories ... 118
Table 14: Overlap of top 1000 ‘hits’ from 9-day and 48-hour genome wide screen for cisplatin depleters ... 121
Table 15: Overlap of top 1000 ‘hits’ from 9-day and 48-hour genome wide screen for cisplatin enrichers ... 122
Table 16: Overlap of top 1000 ‘hits’ from 9-day and 48-hour genome wide screen for oxaliplatin depleters ... 123
Table 17: Overlap of top 1000 ‘hits’ from 9-day and 48-hour genome wide screen for oxaliplatin enrichers ... 124
Table 18: Quadrant II gene ontology enrichments for TCGA vs. CRISPRi 48-hour cisplatin screen data ... 126
Table 19: Quadrant III gene ontology enrichments for TCGA vs. CRISPRi 48-hour cisplatin screen data ... 126
Table 20: Quadrant IV gene ontology enrichments for TCGA vs. CRISPRi 48-hour cisplatin screen data ... 127
Table 21: Quadrant I gene ontology enrichments for TCGA vs. CRISPRi 48-hour oxaliplatin screen data ... 128
Table 22: Quadrant II gene ontology enrichments for TCGA vs. CRISPRi 48-hour oxaliplatin screen data ... 128
Table 23: Quadrant III gene ontology enrichments for TCGA vs. CRISPRi 48-hour oxaliplatin screen data ... 129
13
Table 25: GO term enrichment analysis done with GOrilla for Hitselect cisplatin enrichers. ... 178 Table 26: GO term enrichment analysis done with GOrilla for Hitselect oxaliplatin depleters. 186 Table 27: GO term enrichment analysis done with GOrilla for Hitselect oxaliplatin enrichers. 194 Table 28: GSEA analysis on guide-set enrichment analysis for cisplatin 9-day genome-wide screen. ... 197 Table 29: GSEA analysis on guide-set enrichment analysis for oxaliplatin 9-day genome-wide screen. ... 198
14
List of Abbreviations
CRISPR clustered regular interspersed PAM repeats STICs serous tubal intraepithelial carcinomas
PARP Poly (ADP-ribose) polymerase
TP53 tumor protein p53 BRCA1 breast cancer 1 BRCA2 breast cancer 2
NER nucleotide excision repair TLS translesion synthesis 5-FU 5-fluoro uracil
5-FUR 5-flouro uridine 5-FdUR 5-fluorodeoxyuridine
CRISPR clustered regularly interspaced short palindromic repeats PAM protospacer-adjacent motif
sgRNA guide RNA dCas9 nucleus dead Cas9 CTG Cell Titer Glo
TCGA The Cancer Genome Atlas CCLE Cancer Cell Line Encyclopedia CRISPRi CRISPR interference
GFP green fluorescent protein RFP red fluorescent protein REV3 Protein reversionless 3-like HGSOC High grade serous ovarian cancer BFP blue fluorescent protein
c-parp cleaved parp CPM counts per million
MAGeCK Model-based Analysis of Genome-wide CRISPR/Cas9 Knockout
DNA deoxyribonucleic acid RNA ribonucleic acid
GSEA Guide-set enrichment analysis UV ultraviolet
MLE maximum likelihood estimation mRNA messenger RNA
VSVG Vesicular stomatitis virus G DMSO dimethyl sulfoxide
PCR Polymerase chain reaction
qPCR quantitative PCR
RT-PCR reverse transcription polymerase DMF Dimethylformamide
15 PBS Phosphate-buffered saline
gDNA genomic DNA
HR homologous recombination ICL interstrand crosslink repair FA Fanconi anemia
BER base excision repair
FORK QC replication fork quality control
EJ end-joining
RER ribonucleotide excision repair MMR mismatch repair
16
Chapter 1: Introduction
1.1 Ovarian cancer background
Ovarian cancer is the fifth leading cause of cancer related death for women in the United States1,2 (Figure 1). Only 45% of women with ovarian cancer survive beyond five years due to two major reasons: 1) late-stage diagnosis and 2) resistance to therapeutics4. Early diagnosis is difficult because symptoms typically manifest once the cancer has metastasized; therefore, even though ovarian cancers are not within the top ten most common cancers in women in the United States, it still is one of the most deadly cancers for women2.
Figure 1: American Cancer Society 2020 estimates for cancer deaths in women in the United States The American Cancer Society, INC, surveillance research study estimated the top ten female causes of cancer related death among women in the United States2. Ovarian cancer is projected to have 13,940 deaths from the cancer, which is 5% of the total deaths attributed to cancer in the United States for women. Estimates do not include Puerto Rico or other US territories. Reproduced from American Cancer Society, Surveillance Research, 2020.
Epithelial ovarian cancers account for 90% of ovarian tumors and are characterized into five histological types: serous, mucinous, endometrioid, clear cell, and undifferentiated5. Tumors types are broadly categorized as Type I or II based on TP53 mutation and aggression, with Type
17
I tumors being non aggressive (low-grade serous carcinomas, clear cell, and mucinous carcinomas) and Type II being genetically unstable and more aggressive (high-grade serous carcinomas, high grade endometrioid carcinomas, malignant mixed mesodermal tumors, and undifferentiated)6. High grade serous carcinomas is the most common and deadly tumor type, and will be the focus of my screen7 (Figure 2).
Figure 2: Two common types of ovarian tumors
Ovarian cancers are divided into two major subtypes with type II tumors characteristically more aggressive, deadly, and common. Modified from Jones and Drapkin, Front. Oncol, 20138.
18 1.1.1 Ovarian cancer treatment
Currently, high grade serous ovarian cancer is primarily treated with surgical debulking followed by a platinum/taxane chemotherapy combination3. This regime is largely based on a trial conducted by McGuire et al. in 1996, which showed that combinations of cisplatin and paclitaxel increased median patient survival from 24 to 38 months compared with cyclophosphamide and paclitaxel treatment, which was the standard of care at the time (Figure 3)9. However, although 85% of patients initially respond positively to the combination of cisplatin and paclitaxel, resistance to treatment develops in the majority of cases4. Thus, improvements in ovarian cancer therapies have taken only modest improvements in the past decades, though examples of targeted therapies for specific mutation subsets have recently been shown to be effective, such as the recent FDA approval of Olaparib, a PARP inhibitor for ovarian cancer patients with BRCA1 or 2 mutations10,11.
Increased survival was seen for ovarian cancer patients treated with combination therapies of paclitaxel and platinum compared to paclitaxel and cyclophosphamide. Reproduced from McGuire et al., N. Engl. J. Med., 1996.
19
It is also important to note that while there have been improvements in the treatment of ovarian cancer, the benefits of these treatments have largely been confined to the younger populations of women with ovarian cancer. The older population of women above the age of 65, who more commonly have and die of ovarian cancer, have seen modest improvement in outcome in the last few decades (Figure 4)12. This is hypothesized to be due to the fact that younger women can tolerate harsher chemotherapeutic schedules, or simply have more homogenous diseases that are easier to treat.
Figure 4: Age-adjusted ovarian cancer mortality rates* by Age Group and Race/Ethnicity, 1975-201512
*Per 100,000, age adjusted to the 2000 US standard population. Note: American Indians and Alaska Natives not pictured due to <25 deaths in some years. Rates for Hispanics exclude data from Louisiana, New Hampshire, and Oklahoma due to missing data on Hispanic ethnicity for some years. Reproduced from US mortality data, National Center for Health Statistics, Centers for Disease Control and Prevention, 2017160.
20 1.1.2 Cell of origin for ovarian cancer
The cell of origin of ovarian cancer has been a subject of great controversy. After years of misconception, it now appears that the, the epithelial surface of the fallopian tube, rather than the surface mesothelium of the ovary, is the true home of the cell of origin of the ovarian cancer13–16. The fallopian tubes provide a large epithelial surface area for malignant transformation from which tumors then spread to the ovaries, and later metastasize through the abdominal cavity15 (Figure 5). These findings emerged from the following pieces of evidence: examination of tubal segments of woman with BRCA mutants contained cellular dysplasia in the tubal epithelium17, 93% of tubal intra-epithelial carcinomas were found in the distal tubal fimbriae of sample from patients with advanced stage carcinomas18, and a mouse study by Kim et al. found that ovariectomized mice
continued to develop high grade serous carcinomas while mice that had the fallopian tube removed did not develop cancers15. An analysis by the Johns Hopkins Kimmel Cancer Center and the Dana -Farber Cancer Institute found that multiple tumor samples from nine high grade serous ovarian cancer patients were genetically similar to the serous tubal intraepithelial carcinomas (STICs) lesions19, which are the lesions found in the fallopian tube and shown to be the precursors for high
grade serous carcinomas20. A similar study comparing whole-sequencing and copy number analysis of STICs and ovarian carcinoma confirms the genetic similarity of STICs and high grade ovarian carcinomas21. Benign secretory cell proliferation are seen on the fallopian tube in patients with BRCA mutations or serous carcinomas, which contain cellular signatures of either a p53 alteration22 or another genetic event not p53 related (secretory cell outgrowths or SCOUTs)23. High
grade serous carcinomas are comprised of entirely these secretory cells, while the normal fallopian tube epithelium contains both ciliated and secretory cells16.
21
Figure 5: Diagram of the origin of high grade serous ovarian carcinoma
High grade serous ovarian cancers largely originate from the fallopian tube from STIC lesions. These mutated cells metastasize to the ovary and throughout the peritoneum. Reproduced from National Cancer Institute, “Many Ovarian Cancers May Start in Fallopian Tubes, Study Finds”, 2017.24
1.2 Chemotherapeutics investigated
One potential reason for the lack of effective mono-therapies for ovarian cancers could be the heterogeneous nature of the tumors25, making combination therapies an attractive therapeutic
option. The current combination standard of care, cisplatin and paclitaxel, work through different mechanisms and have non-overlapping toxicities, except for nephrotoxicity9. Cisplatin becomes
aquated upon entry into the cell, undergoing displacement of its two cis-Cl ligands by replacement with H2O26, followed by nucleophilic attack by N-heterogenous bases of DNA, primarily adjacent
guanine residues to form an intra-strand crosslink27,28. Crosslinks are recognized by the DNA damage recognition machinery leading to cell cycle arrest and DNA repair via nucleotide excision repair (NER) or translesion synthesis (TLS), but when DNA is irreparably damaged apoptotic
22
pathways are activated29. Interstrand crosslinks also form with cisplatin damage at a much lower
percentage (~5% of crosslinks); however, these crosslinks require more complicated repair requiring both the activation of the Fanconi anemia pathway and homologous recombination, which creates double strand breaks, indicating that interstrand crosslinks might be primarily responsible for the toxicity of cisplatin30–32. Paclitaxel promotes microtubule assembly and prevents depolymerization which arrests cells in mitosis29,33,34.
In my screen, cisplatin will be investigated as well as oxaliplatin and 5-FU due to recent evidence in several labs including the Yaffe lab, that oxaliplatin and 5-FU might work through previously unrecognized mechanisms. Importantly, both drugs are used clinically as second-line therapies for ovarian cancers35. Oxaliplatin is believed to work similarly to cisplatin by causing intrastrand
crosslinks, but the crosslinks cause a different DNA contortion and the adducts are more hydrophobic36. This is believed to be the cause behind the non-overlapping cross-resistance of oxaliplatin with cisplatin37. However, work by the Hemann lab indicates that oxaliplatin works through a DNA damage-independent mechanism, indicating that oxaliplatin has potential for combination therapies that differ from cisplatin38. The cytotoxic effects of 5-FU are generally
believed to result from inhibition of thymidylate synthase39,40 and impairment of DNA synthesis, although misincorporation of metabolites of 5-FU into RNA has been described41,42 . 5-FU has
shown limited efficacy in recurrent epithelial ovarian cancers, but is used as a second-line therapy43. New findings in the Yaffe lab indicate that RNA damage may constitute the main mechanism for action responsible for 5-FU cytotoxicity, indicating the potential for new synergistic therapies that co-target an RNA damage response. Since we are most interested in
23
studying the RNA damage component of 5-FU, we will be using the metabolite 5-flouro uridine (5-FUR) which is incorporated into RNA and causes RNA damage.
1.3 Screening background
In order to investigate new combinations therapies that can be combined with currently used chemotherapeutics, I used a genome-wide CRISPRi screen; harnessing the power of the modularity of the CRISPR system and testing multiple hypothesis at once. This large-scale screen was followed up with smaller, targeted screens to reduce the noise of a genome-wide screen.
1.3.1 CRISPRi background
The approach I used to generate genomic knock-downs was clustered regularly interspaced short palindromic repeats (CRISPR). Cas9 is a bacterial immune defense system that has been adapted for precise genome editing in eukaryotic cells44,45. Cas9 in bacteria cuts foreign DNA that is encoded by CRISPR arrays; this function can be modified to genomic editing applications in eukaryotes by guiding Cas9 with chimeric sgRNA that matches a target site44. The sgRNA targets a genomic segment through Watson-Crick base pairing and the site has to be located immediately downstream of a protospacer-adjacent motif (PAM), which is an 5’-XGG-3’ sequence that is required for correct binding by Cas9 machinery46. The power of CRISPR for a screen is the modularity of Cas9. Large guide RNA (sgRNA) libraries can be packaged into viral vectors and transduced into cell lines. Using CRISPR sgRNA libraries, genome-wide loss of function screens were first used for determining genes that cause resistance to etoposide and vemurafenib in chronic myelogenous leukemia and melanoma, respectively47,48; and since then, multiple CRIPSR screens have been conducted to study different biological changes49. In contrast to RNAi screens,
24
CRISPR/Cas9 screens are can target almost any segment of DNA and are believed to have less off-target effects than RNAi48,50.
For my screen, the CRISPRi system was used for the screen. The system uses a nuclease dead Cas9 and a series of specific guide RNAs directed at the transcription start site to block transcription of key genes51 (Figure 6). Importantly, this reduction of gene expression, rather than complete gene deletion with a standard CRISPR system, more accurately mimics levels of protein inhibition that can be achieved by the types of small molecule chemical inhibitors used clinically. The additional benefit of the system is that many genes, such as RNA binding proteins, that are known to be important for DNA damage sensitization are also essential genes52–54; thus, the CRISPRi system allows for investigating these essential genes by decreasing expression without completing knocking out their essential functions.
The dCas9 protein is mutated at the RuvC1 (D10A) and HNH (H841A) domains, which inactivate its nuclease function (purple circles). The mutated dCas9 can be targeted to a specific region of the genome through sgRNA sequences, and when binding is targeted to downstream of a transcription start site (TSS), dCas9 can block transcription elongation by blocking RNA polymerase II (Pol II) or the binding of important transcription factors (Txn)55. Modified from Dominguez et al., Nat. Rev. Mol. Cell Biol., 2015.
dCas9
PAM sequence
Transcription
Factors
25
Platinum sensitizer screens have been previously performed in yeast, and demonstrated the importance of specific components of the DNA damage signaling and repair machinery in inducing sensitivity to cisplatin27. Since cisplatin is known to form crosslinks that are repaired through nucleotide excision repair (NER) or bypassed by translesion synthesis (TLS), it makes sense that genes involved in those processes, if knocked out, could add sensitivity to cisplatin treatment. Yeast studies have confirmed that deletion of genes involved in nucleotide excision repair (RAD1, RAD2, RAD4, RAD10, RAD14), and translesion synthesis (REV1, REV3)56,57 enhance sensitivity to cisplatin treatment. In addition, genes involved in other repair mechanisms including post-replicative repair pathway (RAD6, RAD18, MMS2), and homologous recombination (RAD51, RAD52, RAD53, MMS4, RAD54, RAD55, RAD57, RAD59, SAE2), also seem to play a role.
A limited number of RNAi screens in human cancer cell lines mostly have found overlap with yeast screens. A genome wide RNAi screen in HeLa cells identified components of the DNA damage response involved in stalled replication forks (ATR, CHK1, RAD18) and homologous recombination repair (BRCA1, BRCA2, RAD51, SHFM1, REV1L, REV3L) which all caused sensitivity to platinum58. An RNAi screen targeting the kinome on an ovarian cancer cell line (SKOV3), showed that ATR, CHK1, and PRKAB1 knock-down sensitized cells to cisplatin response59. However, SKOV3 cells are a very poor representation of high grade serous ovarian cancer due to the presence of wild-type p53 and a hypermutability phenotype60. Consequently, the translational potential of that screen seems doubtful. Furthermore, most of the human cell line screens to platinum were analyzed by metabolic assays of cell viability (Alamar blue or Cell Titer Glo), which are affected by changes in metabolism and do not always provide a measure of cell death. An assay measuring cell number directly provides a more robust understanding of what is
26
occurring. In keeping with this, Nijwening et al. performed a screen on primary human fibroblast with p53 knock-down (BJET-p53KD) using a nuclei count with Dapi stain, and found that CHK1, RAD51, and SHRM1 knock-down resulted in a non-specific general toxicity. Other hits from the RNAi screen done by Bartz et al27,58, however, were validated using this approach.
1.4 Thesis Overview
I propose that a highly focused CRISPRi/CAS9 screen in a representative cell line of ovarian cancer will identify additionally genes that sensitize ovarian cancers to therapeutics, with consideration given to cell line model, chemotherapeutics tested, and duration of the screen. The careful choice of cell line model will provide a greater probability that the treatment is specific for high grade serous ovarian carcinomas. Cisplatin, oxaliplatin, and 5-FUR will be tested in the screen, since cisplatin is the standard of care and oxaliplatin and 5-FU are second-line therapies. The comparison of these three drugs will give greater insight into how the drugs themselves work and the screen will give understanding into how to sensitize ovarian cancers to the drugs more effectively. The platinum chemotherapeutic, cisplatin, has been used to treat ovarian cancers for over 40 years; however, though initial response to cisplatin is robust, resistance and relapse in ovarian cancers is common. Thus, scientists in the 1980s worked to discover platinum compounds with more durable responses and less side effects, which lead to the development of carboplatin and oxaliplatin61. Carboplatin was found to work similarly to cisplatin62, but oxaliplatin worked through a different mechanism of action and had non-overlapping side effects63. The compound 5-FU was found to be an effective treatment for platinum resistant ovarian cancer when combined with oxaliplatin and high-dose leucovorin (FOLFOX)64, and additional work from the Yaffe lab with 5-FUR, a metabolite of 5-FU, suggested additional work needed to be done to understand
27
how 5-FU worked. Due to difficulties with increased sensitivity of ovarian cancer cells to 5-FUR after a puromycin selection step, the 5-FUR arm of the screen was dropped, but the increased sensitivity of 5-FUR and puromycin was investigated further. Finally, the duration of the screen was initially decided to be 9-days to more closely mimic the chemotherapeutic regime given to most ovarian cancer patients (patients are dosed with chemotherapy on 2- or 3-week cycles). The 9-day genome wide screen was further extended to a targeted screen to expand the genome-wide findings to 2 additional cell lines, as well as increase confidence in the ‘hits’ that the targeted screen identified as important in platinum therapy response. In addition to the 9-day timepoint, the genome-wide screen was done once again with a 48-hour end-point. This allowed for the comparison of acute and longer-term drug treatment effects, as well as test a drug treatment endpoint that was focused on cell death (rather than cell death, growth inhibition, trypsinization, reattachment).
28
Chapter 2: CRISPRi 9-day genome wide screen
2.1 IntroductionThe 9-day genome wide screen was designed to investigate potential combination therapies with the two platinum drugs, cisplatin and oxaliplatin, as well as investigate the mechanisms of action of the two drugs. In order to do this effectively, the CRISPRi system was used to mimic levels of gene expression achievable by small molecule drug inhibitors. Careful consideration was given to cell line selection, drug dosages, duration of the screen, and amount of death/growth inhibition achieved in order to make the screen as clinically relevant as possible.
2.1.1 Ovarian cancer cell lines
For the screen, the cell line chosen to model high grade serous ovarian cancer will play a major role in the results that are obtained. Ovarian cancers form heterogeneous bulk tumors that are difficult to represent by a single homogeneous cell line; however, there are a few distinguishing features that can be accounted for to choose the most accurate cell line model. First, TP53 is mutated in almost all high grade serous ovarian carcinomas65 and additional mutations in BRCA1, BRCA2, RB1, and CDK12 occur more frequently in these tumors than expected by chance66. Domcke et al. examined copy number correlation with patient tumor samples, common ovarian cancer genetic events, and hypermutation status in 47 cell lines to find which cell lines were most representative of ovarian cancers60. Their analysis provides a rough idea of representative cell lines to use for my screen, and persuasively categorizes some cell lines as bad representations of the cancers. Genomic analysis by the Cancer Genome Atlas (TCGA) also identified pathways that are frequently in ovarian cancer tumors such as P13K/RAS and RB signaling66. Combining this
29
genomic data with in vitro studies of p53 activity can give an idea of what cell lines provide a better representation of ovarian cancer and what cell lines should be used for a large screen design.
2.1.2 Drug dosages and screen duration
Before a large-scale screen is undertaken with a genome wide library, experimental parameters such as duration of drug treatment and dosage were carefully considered and determined. Importantly, we wanted our in vitro screening platform to mimic in vivo treatment of patients as closely as possible. High grade serous ovarian cancer patients are generally treated with surgical debulking followed by intraperitoneal chemotherapy, which is administered for 1-4 hours and repeated on a 3 week cycle67,68. To mimic this treatment regimen as closely as possible in a cell line model, we chose to use a transient drug treatment of 4 hours and a late time point that had 50% cell depletion (50% cell viability was chosen to allow for the screen results to show both enrichments and depletions in the results).
2.1.3 CRISPRi screen layout
The overall screen layout is detailed below (Figure 7). The sgRNA viral library is prepped in 293T cells and the ovcar8 dCas9 cells are infected with the library. Following puromycin
selection, ovcar8 cells containing the library are treated with chemotherapeutics for 4 hours, after which the drug is removed and replaced with fresh media. Cells are then grown out for 9 days and split as needed throughout, while maintaining the necessary cell number for 100-fold representation. At day 9 cells are harvest, genomic DNA is isolated, and the sgRNA region was PCR amplified. Amplicons are then sequenced.
30 2.2 Methods
Cell culture
Human ovarian cancer cell line ovcar8 and ovcar4 was grown in RPMI supplanted with 10% fetal bovine serum, while cov362 and skov3 cells were cultured in DMEM and ES2 cells were cultured in McCoy’s Modified Medium. All cell lines were grown in a 5% CO2 humidified atmosphere.
CellTiter-Glo (CTG) viability assay
Cells were plated in a 96-well plate at 1000 cells per well in 100 uL of media and allowed to adhere for 24 hours. 10 uL of 11X cisplatin concentration is added to the cells to make the final concentrations 100 uM and 2-fold dilutions down (10 concentrations total). Cisplatin is dissolved in DMF and wells are normalized to the DMF vehicle control. 72 hours later 50 uL of CTG (Promega #G7572) is added to the wells, the plate is then vibrated for 3 minutes to ensure mixing, and luciferase is read.
Figure 7: CRISPRi screen layout
Cells expressing dCas9 are infected with genome wide library. Library infected cells are selected with puromycin and treated with drug for 4 hours. Cells are then grown out and genomic DNA is extracted, sgRNA region is amplified, and samples are sequenced.
31 Clustering of CCLE data
Ovarian cancer cell line gene expression data was obtained from the cancer cell line
encyclopedia69. Data was then clustered hieratically using GenePattern70 based on a self-curated list of downstream markers of p53 activity.
P53 activation measurements
The ovarian cell lines es2, ovcar8, cov362, and skov3 cells were plated at 1 million cells per plate on 10 cm plate and allowed to adhere overnight. The next day 5 uM doxorubicin treatment or DMSO vehicle control were added to the plates and 24 hours later the plates were harvested for mRNA extraction. PUMA and p21 levels were assessed by qPCR.
Single cell dCas9 clone generation
CRISPRi machinery was made using the dCas9 two step system developed by the Weissman lab. Initially, 293T cells were transfected with retro-dCas9-10xGCN4-GFP (pHRdSV40-dCas9-10xGCN4_v4-P2a-SpeIXhoI-GFP, obtained from the Hemann lab), a VSVG packaging vector, and a retro RNA polymerase using the Takara Calcium phosphate transfection kit (CalPhos Mammalian Transfection Kit #631312). 24 hours after transfection fresh media was added to the 293T cells and 24 hours later media containing virus was harvested for infection. Ovcar8 cells were then infected with filtered virus containing media (0.450 uM filter) and co-treated with 8 ug/mL of polybrene for 48 hours. Fresh media was then applied to the Ovcar8 cells and cells were expanded for sorting. Cells were sorted for dCas9 expression by gating for GFP positive cells. Single cell clones of GFP positive cells were also sorted into a 384 well plate using conditioned
32
media, or media that had been used to culture ovcar8 cells for 24 hours that had been filtered through a 0.450 um filter. Cells were allowed to grow out for 3-4 weeks. After single cell clones were grown out, clones were analyzed for GFP expression and clones not expressing GFP were not used further. Clones 2, 6, 7, 8 were used for further analysis.
Single cell clone expression of REV3
Ocvar8 cells that had been bulk sorted for GFP expression were then infected with 5 guides targeting REV3, designed using the Weissman library guides. Rev3 guide binding sites are shown below (Figure 8-9).
Figure 8: CRISPRi sgRNA for Rev3 binding sites shown relative to the entire Rev3L gene
33
Rev3 guides were cloned into a Lenti-U6 vector expressing tdTomato (pU6_tdtomato-NT1, obtained from the Hemann lab). Guides and a Gal4 control guide were cloned into a lenti-guide backbone using the Target Guide Sequence Cloning Protocol from the Zhang lab48,71. Ovcar8 cells were then infected with lentiviral containing media produced using the same calcium phosphate protocol. Cells were then sorted for RFP and GFP double positive expression and ovcar8 double positives were analyzed for decreased Rev3 expression analyzed by mRNA levels (Figure 10). Briefly, RNA was extracted using the Macherey-Nagel RNA extraction kit and RT-PCR was performed on 1 ug of RNA using SuperScript III First-Strand Synthesis System (ThermoFisher #18080051). Fast sybr green master mix (Thermo Fischer # 4385612) was used according to the manufacturer’s cycling conditions for 40 cycles. Data were analyzed using the delta-delta Ct method and plotted as fold change versus control. Guide 3 was used for further study.
After single cell clones were grown out (3-4 weeks), clones were analyzed for GFP expression and clones not expressing GFP were not used further. Clones 2, 6, 7, 8 were used for further analysis. Clones were infected with lenti-guide virus with guides targeting Rev3 or Gal4, using the same calcium phosphate transfection into 293T and infection protocol used previously. Each clone was
34
then sorted for double positive expression of GFP and RFP and was then analyzed for Rev3 levels by mRNA, with clone 6 and 8 showing robust knock down of Rev3 levels (Figure 11). Clone 6 was then selected for further study based on ease of growth and similar morphology to the parental ovcar8 cell line.
Competition assay for drug dosage
To determine the dosage of cisplatin that should be used, a competition assay between ovcar8 GFP cells and ovcar8 cells was conducted. 1 million ovcar8 GFP cells were plated and allowed to adhere for 24 hours in a 15-cm plate. The next day, media was removed and cells were treated with 15 mL of media containing either 5, 3, and 0 uM of cisplatin. Media was removed after 4 hours and cells were washed and trypsinized. In parallel, ovcar8 cells were trypsinized. Ovcar8 GFP and ovcar8 cells were then combined in a 1:1 ratio and the ratio of cells was determined by flow
A)
B)
Figure 11: Single cell clone expression levels of REV3
Single cell clones of ovcar8 cells expressing dCas9 were infected with guides targetting REV3 or a Gal4 and assessed for REV3 mRNA knock-down. A) Schematic showing how a single clone is infected with guides targetting REV3 or Gal4 B) REV3 mRNA levels are then normalized according to the following formular (sgREV3 REV3 mRNA expression/sgREV3 GAPDH mRNA expression)/(sgGAL4 REV3 mRNA expression/sgGAL4 GAPDH mRNA expression)
35
cytometry. The mix of cells was then plated at 100,000 cells per well in a 6 well plate. At day 4, cells were split for day 6 and day 9 and analyzed for GFP percentage at day 4, 6 and 9.
Cells were investigated for sensitivity to cisplatin and oxaliplatin through a competition assay (Figure 12), and results determined that 5 uM of cisplatin, 7.5 uM of oxaliplatin, and 5 uM of 5-FUR for a four-hour treatment assessed at day 9 would be the conditions used for the screen (Figure 13).
Figure 12: Competition assay schematic
Cells expressing a flourescent marker (in this case GFP) are treated with DNA damaging agents for 4 hours. After treatment, flourescent marked cells are mixed in a 1:1 ratio and cells are allowed to grow out. Cells are assessed by flow cytometry for depletion.
36 Competition assay for drug sensitivity to sgREV3
Once a dosage and time of treatment was determined that caused approximately 50% cells death, the increased sensitivity of Rev3 knock down on cells was analyzed using a similar competition assay (Figure 14) to ensure that the CRISPRi system was correctly replicating known cisplatin DNA damage repair mechanism. Protein reversionless 3-like (Rev3) is involved in TLS72, which is one of the known mechanisms of cisplatin DNA damage tolerance.
Clone 6 lines expressing either the Rev3 of Gal4 guide were used since clone 6 showed a robust knock-down of Rev3. Rev3 or Gal4 cells (RFP/GFP+) were combined 1:1 with clone 6 cells (GFP+) with no guide. Cells were plated at 100,000 cells per well in a 6 well plate and allowed to
Figure 13: Competition assay to determine drug dosages for cisplatin, oxaliplatin, and 5-FUR
Flow cytometry was used to assess GFP positive cell populations after treatment with drug for 4 hours. Cells were measured at day 6 and 9 after treatment and the percent GFP postive cells is normalized to day 0 initial percentages.
37
adhere overnight. The next day, cells were treated with new media at 0, 3, 5 uM cisplatin for four hours. A well of cells was analyzed for day 0 measurements. After four hours, cells were washed and fresh media was applied to cells. At day 4, cells were trypsinized and some of the cells were reseeded for day 6 and day 9 analysis while the rest of the cells were used for flow cytometry analysis. Cells were analyzed by flow cytometry on day 6 and 9 as well.
It appeared that by day 9, cells expressing the guide for Rev3 were about 30-40% more sensitive to cisplatin treatment at 5 uM than Gal4 control cells. From the drug response, it appears that a dose of 5 uM for 4 hours after nine days results in a 50% growth inhibition of the treated cells, with an additionally 30% inhibition of growth induced by a REV3 knock-down. Thus, 5 uM of cisplatin looked like a promising dose to conduct the full screen at. As a control, cells treated with 5-FUR or GAL4 had no increased sensitivity to cisplatin treatment (Figure 15), which increases confidence that the CRISPRi machinery is working correctly and the system can recapitulate cisplatin sensitivities seen in literature.
38
Figure 14: REV3 competition assay schematic
Cells infected with sgGAL4/sgREV3 are mixed in a 1:1 ratio with dCas9 cells. The mixture of adhered cells is then treated with drug for 4 hours and depletions and enrichments are measured by flow cytometry at various time points.
Figure 15: Competition assay to see the effects of sgREV3 knock-down with cisplatin and 5-FUR treatment
Cells expressing sgREV3 were mixed in a 1:1 ratio with dCas9 cells and treated with cisplatin or 5-FUR. Ratio of GFP/RFP was measured at day 4, 6, and 9. All results are normalized to day 0 initial GFP/RFP ratios.
39 Library amplification
The Weissman lab CRISPRi genome wide libraries (Addgene 83969, 83970) were amplified using Feng Zhang’s protocol Genome-scale CRISPR Knock-Out (GeCKO) v2.0 pooled libraries: GeCKO pooled electroporation, plating, determination of transformation efficiency and maxi prep48,71. The library was split into two library preps, the top 5 sgRNA library (#83969) and a supplemental library containing 5 guides per gene (#83970), making a total of 10 guides per gene. The library is a genome wide library targeting 20,907 genes.
Library virus generation and titer
The library virus was generated using the same calcium phosphate transfection described earlier, but was scaled up to 2 15-cm plates. Once again, 293T cells were transfected with the library, a VSVG packaging vector, and a lenti RNA polymerase using the Takara Calcium phosphate transfection kit (CalPhos Mammalian Transfection Kit #631312). 24 hours after transfection 15 mL of fresh media was added to the 293T cells and 24 hours later media containing virus was harvested for infection. Media containing virus was then collected and filtered through a 0.450 uM filter. Two more rounds of media addition and virus harvesting occurred to collect a total of 45 mL or media per plate, or 90 mL of each library.
The viral titer of the virus was then determined. Ovcar8 dCas9 cells were plated at 200 thousand cell per well in a 6 well plate. The initial infection with the library was done at low multiplicity of infection to insure one guide per cell (10-15% infection with guide sgRNA libraries). The library contained a BFP marker and puromycin resistance, so cells could be selected for infection with puromycin and the viral titer could be determined based off of BFP fluorescence. Cell were
40
allowed to adhere overnight and then were infected with varying concentrations of virus containing media with 8 ug/mL of polybrene. 48 hours after infection, cells were assessed for library infection. Ovcar8 dCas9 cells contain GFP and Ovcar8 dCas9 infected with the Weissman lab library express BFP, which is demonstrated in the figure below (Figure 16).
Figure 16: Ovcar8 dCas9 cells infected with CRISPRi library express both BFP and GFP
Ovcar8 cells infected with both dC9 express GFP, measured on the FITC channel. The Weissman CRISPRi library contains a BFP marker that is measured on the BV421 channel
The two CRISPRi libraries, each containing 5 guides per gene were assessed for viral titer using the same method. The viral library 83969 appeared to have about a 10% infection at 25% viral media and 75% fresh media, while the viral library 83970 seemed to achieve about a 10% infection with 12.5% viral median and 87.5% fresh media (Figure 17).
41
Figure 17: Viral titer for CRISPRi libraries 83969 and 83970
Viral titer was measured 48 hours after infections with varying percentages of viral media with fresh media. Complete virus (CV) is 100% virus and descending percentages of virus are listed above each column. GFP measures dCas9 fluorescence and BFP measures the library infection.
Ovcar8 cells were then analyzed for the combined library infection to ensure that the combined library worked at approximately the same infection rate as individually. The same plating method, infection, and analysis was used. From the results, the viral library 83969 infected at 25% viral media and the viral library 83970 infected at 12.5% viral media, achieved the
approximately 10-15% desired infection rate (Figure 18). Each replicate of the screen was treated at these viral media concentration levels and fell within the 10-15% infection range.
42
Figure 18: Combined infections with viral libraries 83969 and 83970
Viral titer was measured 48 hours after infections with the combined library. 83969 was infected at 25% and 83970 was infected at 12.5%. GFP measures dCas9 fluorescence and BFP measures the library infection.
Screen protocol
Ovcar8 dCas9 cells are plated at 5 million cells per well in 30 15-cm plates. Since the library targets 20,907 genes and the library consists of 10 guides per gene, at 100-fold representation, 20 million cells need to be infected. With an infection rate of 10 percent, this amounts to 200
million cells needed at the time of infection. Ovcar8 cells have a doubling time of 25 hours so at 25 hours post plating, there will be 300 million cells if 30 plates are plates, giving some room lower efficiencies in infection and for a general buffer. 24 hours post plating, media containing the library packaged into virus was used to infect ovcar8 cells (83969 was infected at 25% and 83970 was infected at 12.5% with 8 ug/mL polybrene). Media was changed 48 hours after infection with fresh media with 2 ug/mL of puromycin. Following 48 hours puromycin selection, cells were allowed to recover for 72 hours and then plated at 5 million cells per well in 5 15-cm plates per condition (i.e. cisplatin, DMF, oxaliplatin, PBS). 24 hours after plating, cells were treated with chemotherapeutics for 4 hours with cisplatin treated at 5 uM with DMF vehicle
43
control and oxaliplatin treated at 7.5 uM with PBS vehicle control. Cells were then grown out for 9 days and split as needed throughout, while maintaining the necessary cell number for 100-fold representation (at least 20 million cells at any split). At day 9 cells were harvested through trypsinization, counted, and frozen at -20ºC.
Post-screen processing
Genomic DNA was extracted from cell pellets using Promega Wizard Genomic DNA
purification (#A1120). The sgRNA region was then amplified based on the Illumina Sequencing Sample Preparation for use with CRISPRi/a-v2 protocol, with amplification starting at step 3. The number of PCRs to do was based on the following calculation. The human genome contains 3.2 billion base pairs which means that 1 ng of DNA contains 290 copies of gDNA. However, ovcar8 cells have an average of 47-57 chromosomes, indicating their genome contains 4 billion base pairs or 1 ng contains 232 genome copies. The library contains 209,070 guides. At 100-fold representation, 20 million copies of the genome are required to maintain representation. Thus, 20,907,000 required copies divided by 232 copies of the genome in ovcar8 cells means 90116 ng of gDNA need to be amplified, or 90.1 ug of DNA. Since each PCR can amplify 3 ug of DNA, 30.3 PCRs per samples are required to maintain representation (Figure 19). 32 PCRs per sample were done to provide a buffer for PCR efficiency and downstream processing.
44
Figure 19: PCR checks to determine what quantity of gDNA was appropriate to use to process samples
PCR conditions were tested with varying amounts of gDNA. The test was repeated three times and three ug of gDNA was consistently a strong PCR product at 270 bp.
Primers were ordered from Millipore Sigma, and the following samples were amplified with the respective 5’ primers listed in Table 1 and the common 3’ primer
CAAGCAGAAGACGGCATACGAGATCGACTCGGTGCCACTTTTTC.
Sample id Sample name
TruSeq ID
5’ PCR primer (bold indicates sample index for demultiplexing) 1 Day 0 12 aatgatacggcgaccaccgagatctacacgatcggaagagcacacgtctgaac tccagtcacCTTGTAgcacaaaaggaaactcaccct 2 Cisplatin 6 aatgatacggcgaccaccgagatctacacgatcggaagagcacacgtctgaac tccagtcacGCCAATgcacaaaaggaaactcaccct 3 DMF 14 aatgatacggcgaccaccgagatctacacgatcggaagagcacacgtctgaac tccagtcacAGTTCCgcacaaaaggaaactcaccct 4 Oxaliplatin 10 aatgatacggcgaccaccgagatctacacgatcggaagagcacacgtctgaac tccagtcacTAGCTTgcacaaaaggaaactcaccct 5 PBS 3 aatgatacggcgaccaccgagatctacacgatcggaagagcacacgtctgaac tccagtcacTTAGGCgcacaaaaggaaactcaccct
Table 1: 5’ amplification primers for sgRNA regions of gDNA
Table contains sample name and TruSeq ID for 5 samples submitted for sequencing. 5’ primer sequences are listed with the demultiplexing index bolded.
45
The PCR amplification was done with Phusion High Fidelity PCR Master Mix with HF buffer (NEB #M0531S) with the following PCR reaction components (Table 2).
PCR Reaction 50 ul reaction
Water Bring final volume to 50 uL
Phusion 2X 25 uL
DMSO 1.5 uL
P(common) 1000 uM 2.5 uL P(Index) 1000 uM 2.5 uL
gDNA 3 ug
Table 2: PCR reactions components
PCR conditions were followed according to the Weissman lab protocol (98 ºC 30 seconds, 23 cycles of 98 ºC, 56 ºC, 72 ºC, followed by 10 minutes at 72 ºC, and finished at a 7 ºC). Samples were then pooled for a given samples and a PCR clean-up was performed with 5X volume PB and 1/100 vol 3M NaOAc. Sample was mixed and run through a nucleic acid purification column. The column was washed twice with PE and eluted with 60 ºC warmed EB. The sample was then loaded onto a 2% TAE gel stained with syber safe. After the gel was run, the 270 bp PCR product was cut out and gel extracted using cut out using the QIAGEN gel purification kit (Cat No. # 28506). Samples were eluted in water and sent to sequencing.
Sequencing was performed on the HiSeq2000 with the sequencing primer
GTGTGTTTTGAGACTATAAGTATCCCTTGGAGAACCACCTTGTTG. Prior to sequencing samples were run on a Bioanalyzer and had qPCR performed to confirm size and purity. The sequencing parameters were single-end 50 bp run, index length of 6, first sequence read with the
46
custom provided primer, second sequence read with standard illumine index primer, and a 10% PhiX Spike-in.
Mapping guide counts
Sequenced reads were mapped back to respective guides using the python package developed by the Weissman lab (fastqgz_to_counts.py). Guide counts were then differentially ranked using the Degust analysis web tool73, which used EdgeR to normalize gene counts and compare the fold
change of treated versus untreated samples74
HITSelect
HITSelect is available for download from http://sourceforge.net/projects/hitselect/, and the source code is available at https://github.com/diazlab/HiTSelect. The downloadable HITSelect GUI was used to calculate enrichment and depletions of samples based on the rankings
calculated through EdgeR75. HITSelect rankings were then inputted into Gorilla ( http://cbl-gorilla.cs.technion.ac.il/) to search for enriched gene ontology terms76. Revigo was run on the gene ontology analysis from the website, http://revigo.irb.hr/, with the medium similarity option selected77. Replicate 1 was discarded from the analysis due to a correlation analysis showing it was an outlier compared to replicate 2 and 3, and replicated 2 and 3 were henceforth referred to as replicate 1 and 2.
Guide-set enrichment analysis
Guide-set enrichment analysis uses the same math as Riger to calculate a running enrichment score based on a previously ranked guides78. Since the library consisted of 10 guides per gene, a
47
running enrichment score for the guides could be used to calculate the enrichment of a particular gene with a ranked list, relative to a control sample. Enrichment scores were permutated 1000 times against a null distribution to determine statistical significance of each guide set and results were normalized for multiple hypothesis testing.
Gene-set enrichment analysis (GSEA) was performed on the rankings calculated from the guide-set enrichment analysis using GSEA 4.0.0 developed by the BROAD79. GSEA was run on v6.2 hallmark gene set and kegg c2 v6.2 gene set on the GSEA pre-ranked setting. The DNA damage response analysis was run on the same GSEA software with the curated lists of the various DNA damage response pathways curated from Durocher’s lab80. Since these gene lists were relatively small, the GSEA algorithm was permutated 80 thousand times to differentiate the significance values between the different pathways.
MAGeCK
The MaGECK system was implemented using the MAGeCK-Flute R package. Mageck-MLE was run on an ubuntu station as it was computationally expensive. Screen quality controls are shown in the appendix section VI. All the samples had a high percentage mapping (above 75%); however, the fold representation was lower than expected for some of the samples.
48 2.3 Results
2.3.1 Cell line selection
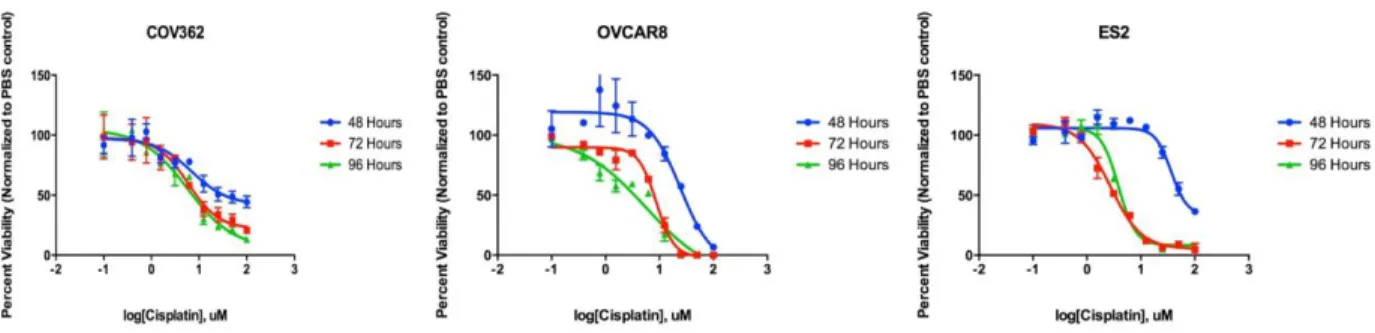
Multiple factors were considered for cell line selection including Domcke’s cell line versus primary tumor analysis, ease of cell line use, and p53 status. After a preliminary investigation of various cell lines, I selected three cells lines (ovcar8, cov362, es2) for further investigation. The primary determinants in cell lines selections were translatability to mouse work (based on approved protocols and prior use of cell lines with mouse models), availability, and ease of growth (Table 3). Initially drug sensitivity to platinum agents was assessed to make sure cells were not chosen that had an abnormally sensitivity or resistance to platinum agents before beginning (Figure 20). In a cell-titer glo viability assay, cov362 were most resistant to cisplatin; however, all of the cells responded to cisplatin in a dose-dependent manner, and we proceeded forward testing these three cell lines.
Table 3: List of cell lines tested to use for the screen
Three cell lines were tested for use in the genome-wide screen. Cells were evaluated based on Domke et al’s rating, p53 mutation, and transfection ease.
Cell Line Domke Rating P53 mutation Transfection Ease
OVCAR8 Possibly HGS 126-132 deletion Good
COV362 Likely HGS Y220C Poor