CRISPR-mediated modeling and functional validation of
candidate tumor suppressor genes in small cell lung cancer
The MIT Faculty has made this article openly available.
Please share
how this access benefits you. Your story matters.
Citation
Ng, Sheng Rong et al. "CRISPR-mediated modeling and functional
validation of candidate tumor suppressor genes in small cell lung
cancer." Proceedings of the National Academy of Sciences of the
United States of America 117, 1 (January 2020): 513-521 ©2020
National Academy of Sciences.
As Published
http://dx.doi.org/10.1073/pnas.1821893117
Publisher
Proceedings of the National Academy of Sciences
Version
Final published version
Citable link
https://hdl.handle.net/1721.1/125148
Terms of Use
Article is made available in accordance with the publisher's
policy and may be subject to US copyright law. Please refer to the
publisher's site for terms of use.
CRISPR-mediated modeling and functional validation
of candidate tumor suppressor genes in small cell
lung cancer
Sheng Rong Ng
a,b, William M. Rideout III
a, Elliot H. Akama-Garren
a, Arjun Bhutkar
a, Kim L. Mercer
a,c
,
Jason M. Schenkel
a,d, Roderick T. Bronson
e, and Tyler Jacks
a,b,c,1aDavid H. Koch Institute for Integrative Cancer Research, Massachusetts Institute of Technology, Cambridge, MA 02139;bDepartment of Biology,
Massachusetts Institute of Technology, Cambridge, MA 02139;cHoward Hughes Medical Institute, Massachusetts Institute of Technology, Cambridge, MA
02139;dDepartment of Pathology, Brigham and Women’s Hospital, Boston, MA 02115; andeDepartment of Pathology, Tufts University School of Veterinary
Medicine, North Grafton, MA 01536
Contributed by Tyler Jacks, November 19, 2019 (sent for review December 24, 2018; reviewed by Roman K. Thomas and Andrea Ventura) Small cell lung cancer (SCLC) is a highly aggressive subtype of
lung cancer that remains among the most lethal of solid tumor malignancies. Recent genomic sequencing studies have identified many recurrently mutated genes in human SCLC tumors. However, the functional roles of most of these genes remain to be validated. Here, we have adapted the CRISPR-Cas9 system to a well-established murine model of SCLC to rapidly model loss-of-function mutations in candidate genes identified from SCLC sequencing studies. We show that loss of the genep107 significantly accelerates tumor progres-sion. Notably, compared with loss of the closely related genep130, loss ofp107 results in fewer but larger tumors as well as earlier metastatic spread. In addition, we observe differences in prolifera-tion and apoptosis as well as altered distribuprolifera-tion of initiated tumors in the lung, resulting from loss ofp107 or p130. Collectively, these data demonstrate the feasibility of using the CRISPR-Cas9 system to model loss of candidate tumor suppressor genes in SCLC, and we anticipate that this approach will facilitate efforts to investigate mechanisms driving tumor progression in this deadly disease. small cell lung cancer
|
CRISPR|
GEMM|
p107S
CLC is a highly aggressive neuroendocrine lung carcinoma
that comprises around 13–15% of all diagnosed lung cancer
cases (1). The disease is characterized by rapid growth and early
widespread metastasis with the majority of patients presenting
with extensive stage disease (2). Although SCLC patients often
exhibit robust initial responses to cytotoxic chemotherapy, relapse
almost invariably occurs, and no effective second-line therapies
currently exist (3). Despite decades of research, few new therapies
have demonstrated significantly improved outcomes for SCLC
patients, in contrast to the growing number of options available for
treating non-small cell lung cancer (4).
Genetically engineered mouse models (GEMMs) of SCLC
have been used extensively to study the molecular mechanisms of
tumor progression in SCLC. Based on the fact that inactivating
mutations in the tumor suppressor genes
TP53 and RB1 are
found in almost all human SCLC tumors (5, 6), a murine model
of SCLC (mSCLC) was developed by conditionally deleting
Trp53 and Rb1 in the murine lung epithelium (7). This model
faithfully recapitulates the key features of human SCLC, including
histopathological appearance, expression of key neuroendocrine
markers, and pattern of metastatic spread (7). Subsequent studies
have utilized the
Trp53/Rb1 double knockout model of SCLC to
functionally investigate additional genes, such as
Rbl2 (also known
as
p130), Pten, Mycl1, Nfib, Myc, and Crebbp (8–17).
Large-scale cancer genome sequencing studies have generated
an extensive catalog of genes that are mutated in numerous cancer
types (18). It remains a significant challenge to distinguish
be-tween driver and passenger mutations in order to identify genes or
pathways that are truly important for tumor progression. This is
particularly relevant in cancers that have high mutation rates, such
as lung cancer (5, 19–21). One recent study involving SCLC
iden-tified multiple recurrently altered genes in these tumors, including
inactivating mutations in the Notch signaling pathway, which was
subsequently shown to functionally contribute to SCLC tumor
progression (5). However, apart from a few other notable
exam-ples, many of the most frequently mutated genes have yet to be
functionally validated in SCLC.
The development of the CRISPR-Cas9 system for genome
editing in mammalian cells (22–24) has revolutionized the field
of cancer research, enabling rapid validation of candidate oncogenes
and tumor suppressor genes both in vitro as well as in vivo. This has
been especially useful when combined with GEMMs of various
cancers (25–32). By bypassing the need to generate new germline
or conditional alleles for each gene of interest, the CRISPR-Cas9
Significance
SCLC is a deadly disease for which treatment outcomes have not improved significantly for over 30 y due to the lack of ef-fective new therapies. Large-scale sequencing studies have identified many recurrently mutated genes in human SCLC tumors, whose functions remain poorly understood. We have adapted the CRISPR-Cas9 system to rapidly model mutations in target genes in a mouse model of SCLC. Using this system, we show that the genep107 functions as a tumor suppressor gene in SCLC. Furthermore, loss of p107 confers a distinct tumor phenotype from loss of its close relative p130. Our results demonstrate the utility of our system for better understanding the genetic factors that contribute to SCLC progression.
Author contributions: S.R.N. and T.J. designed research; S.R.N., W.M.R., E.H.A.-G., and K.L.M. performed research; S.R.N., A.B., J.M.S., R.T.B., and T.J. analyzed data; and S.R.N. and T.J. wrote the paper.
Reviewers: R.K.T., University of Cologne; and A.V., Memorial Sloan Kettering Cancer Center.
Competing interest statement: T.J. is a member of the Board of Directors of Amgen and Thermo Fisher Scientific. He is also a co-founder of Dragonfly Therapeutics and T2 systems. T.J. serves on the Scientific Advisory Board of Dragonfly Therapeutics, SQZ Bio-tech, and Skyhawk Therapeutics. None of these affiliations represent a conflict of interest with respect to the design or execution of this study or interpretation of data presented in this paper. Dr. Jacks’s laboratory currently also receives funding from the Johnson & Johnson Lung Cancer Initiative and Calico, but this funding did not support the research described in this paper.
This open access article is distributed underCreative Commons Attribution-NonCommercial-NoDerivatives License 4.0 (CC BY-NC-ND).
Data deposition: The data reported in this paper have been deposited in the Gene Ex-pression Omnibus (GEO),https://www.ncbi.nlm.nih.gov/geo, accession no.GSE139444. All other data generated or analyzed during this study are included in this published article,
SI Appendix, andDatasets S1–S3.
1To whom correspondence may be addressed. Email: tjacks@mit.edu.
This article contains supporting information online athttps://www.pnas.org/lookup/suppl/ doi:10.1073/pnas.1821893117/-/DCSupplemental.
First published December 23, 2019.
GENET
system has greatly increased the speed at which candidate genes,
such as those identified from cancer genome sequencing studies or
genetic screens, can be functionally validated in relevant preclinical
models of cancer. These systems also streamline the development
of in vivo models with which to examine the biological effects of
multiple tumor-associated mutations.
In this study, we have adapted the CRISPR-Cas9 system to the
Trp53/Rb1 model of SCLC. We demonstrate the utility of this
system to rapidly model loss of function of candidate tumor
sup-pressor genes in SCLC. In particular, we show that loss of p107
(also known as Rbl1), a member of the retinoblastoma family of
proteins that is recurrently mutated in a subset of human SCLC
tumors (5), significantly accelerates tumor progression in the
Trp53/Rb1-mutant background. Notably, loss of p107 appears to
confer a distinct tumor phenotype compared with loss of p130,
another member of the retinoblastoma family.
Results
Strategy for CRISPR-Mediated Targeting of Genes in mSCLC.
We
generated a Cre-activated allele of Cas9 targeted to the
Rosa26
locus (Fig. 1A). This allele also coexpresses EGFP and Csy4 (also
known as Cas6f); the latter is a Type I CRISPR-Cas endonuclease
that recognizes and cleaves RNA at a 28-nucleotide sequence (33)
and has previously been used for multiplexed single guide RNA
(sgRNA) expression from a single RNA transcript (34). We crossed
this allele into the
Trp53
flox/flox; Rb1
flox/floxbackground to generate
Trp53/Rb1/Cas9 animals. To allow for monitoring of tumor
pro-gression in vivo, we also crossed a Cre-activated luciferase reporter
allele into these animals (9, 12).
To restrict CRISPR-Cas9 activity specifically to initiated
tu-mor cells in vivo, we generated an adenoviral vector, Ad5-USEC
(U6-sgRNA-EFS-Cre), that expresses a sgRNA targeting a gene
of interest together with Cre recombinase (Fig. 1B). We chose to
use an adenoviral vector instead of a lentiviral vector due to the
observation that lentiviral-mediated tumor initiation frequently
resulted in the broadening of the tumor spectrum in
Trp53
flox/flox;
Rb1
flox/floxanimals, including an increased rate of histiocytic
sarcoma formation. Cre activity in the Ad5-USEC vector was
validated in vitro using the Green-Go reporter cell line
pre-viously generated in our laboratory, in which GFP is activated
upon Cre expression (27) (Fig. 1C). SCLC tumors were initiated
by intratracheal administration of Ad5-USEC into the lungs of
animals (35).
Loss of p107 Accelerates Tumor Progression in SCLC.
To validate this
system, we chose to target
p107 and p130, both of which are
members of the retinoblastoma family of proteins that are
re-currently mutated in around 6% of human SCLC tumors each
(5). In particular,
p130 was chosen as a positive control because
germline p130 conditional alleles have been previously used to
accelerate tumor progression in SCLC (8). We designed sgRNAs
targeting
p107 and p130 and validated their activity in vitro in
Green-Go cells that were transduced with a Cas9-expressing
len-tivirus (36), both by deep sequencing of the respective target
ge-nomic loci to assess the efficiency of generation of mutations (
SI
Appendix, Fig. S1A
) as well as by Western blot to confirm a
de-crease in protein levels (
SI Appendix, Fig. S1 B and C
).
To test our system in vivo, we infected Trp53/Rb1/Cas9
ani-mals with Ad5-USEC vectors expressing sgRNAs targeting
p107,
p130, or a control unannotated region of the genome (sgp107,
sgp130, and control sg, respectively). At 5.5 mo posttumor
ini-tiation, we performed in vivo bioluminescence imaging to track
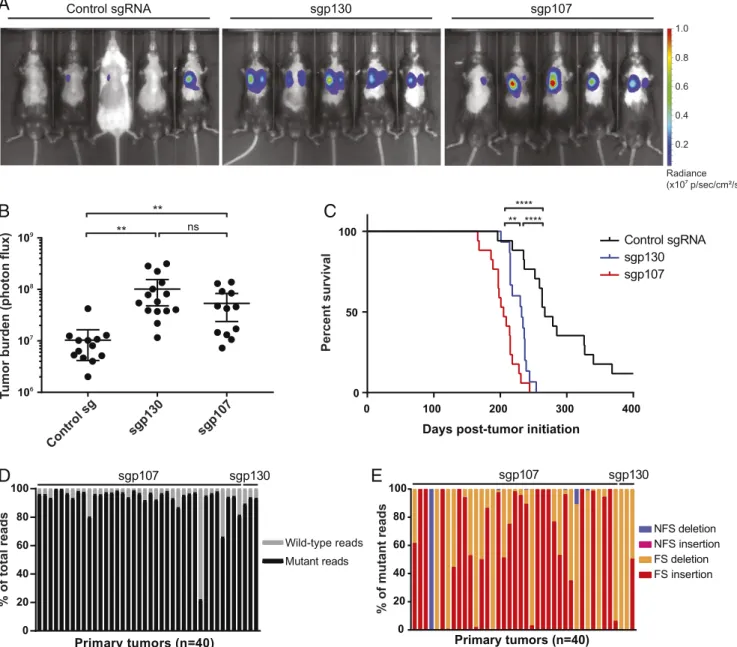
tumor progression in these animals. We observed higher luciferase
activity in both sgp130- and sgp107-infected animals compared
with control animals (Fig. 2
A and B), consistent with a significant
acceleration in tumor progression. Furthermore, both
sgp130-(232 d) and sgp107-infected animals (205 d) showed decreased
median survival compared with control animals (267 d; Fig. 2C).
The acceleration of tumor progression that we observed in
sgp130-infected animals recapitulates the results obtained in a previous
GFP 10² 0 0 50K 100K 150K 200K 250K FSC 10³ 0.00 104 105 GFP 10² 0 0 50K 100K 150K 200K 250K FSC 10³ 66.06 104 105 1 11 1 2 3 4 Trp53flox/flox Rb1flox/flox
CAGGS Cas9 2A GFP 2A Csy4
1 11 1 2 4 Rosa26
A
CreB
U6 sgRNA EFS Cre ITR
ITR ψ
Ad5-USEC
C
Ad5-USEC
CAGGS Cas9 2A GFP 2ACsy4
Trp53Δ/Δ
Rb1Δ/Δ
Fig. 1. Strategy for in vivo CRISPR-mediated targeting of genes in mSCLC. (A) Schematic of the Rosa26-CAGGS-LSL-Cas9-GFP-Csy4 allele crossed into the Trp53/Rb1 double knockout model of SCLC. (B) Schematic of the Ad5-USEC vector. (C) In vitro validation of the Ad5-USEC vector in the Green-Go reporter cell line, which harbors a Cre-activated GFP cassette. Cells were analyzed by flow cytometry 4 d posttransduction.
study using conditional
Trp53/Rb1/p130 triple knockout SCLC
mice (8).
To determine whether the observed phenotypes were a result
of loss of
p130 or p107 gene function, we isolated genomic DNA
from tumors dissected from infected animals, then performed
targeted deep sequencing of the genomic loci targeted by the
re-spective sgRNAs. We observed that the vast majority of detected
sequences contained either frameshift insertions or deletions (Fig.
2
D and E and
SI Appendix, Fig. S2
), with tumors harboring 1–4
different mutant alleles each. This result is consistent with a strong
positive selection pressure for loss-of-function alleles in these
tu-mors. Collectively, these data validate our approach for modeling
loss-of-function mutations in this model and demonstrate that
p107, like p130, is a functional tumor suppressor in SCLC.
Distinct Consequences of Loss of p107 and p130 in SCLC.
To more
closely examine changes in tumor progression upon loss of p107
or p130, we analyzed cohorts of infected Trp53/Rb1/Cas9 mice at
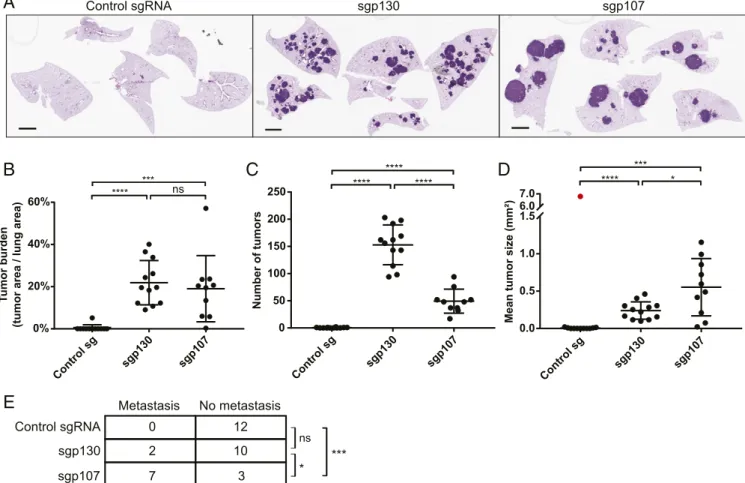
fixed time points posttumor initiation. Analysis of hematoxylin
and eosin (H&E)-stained lung sections from animals 6 mo
posttumor initiation showed that loss of either p107 or p130
increases overall lung tumor burden compared with control
an-imals (Fig. 3
A and B), consistent with our in vivo bioluminescence
imaging result. In addition, there was no significant difference in
tumor burden between sgp107- and sgp130-infected animals (Fig.
3B). However, there was a marked difference in the tumor
phe-notype observed in both groups of animals. sgp107-infected
animals developed fewer tumors but with a larger mean tumor
size, compared with sgp130-infected animals (Fig. 3
C and D).
A
C
o
n
t
r
o
l
s
g
R
N
A
s
g
p
1
3
0
s
g
p
1
0
7
B
106 107 108 109**
**
nsTumor burden (photon flux)
Control sg
sgp130
sgp107
**** ** **** 0 100 200 300 400 0 50 100Days post-tumor initiation
Control sgRNA
sgp130
sgp107
Percent survival
C
E
D
0 20 40 60 80 100Primary tumors (n=40)
FS insertion FS deletion NFS insertion NFS deletionsgp107
sgp130
% of mutant reads
0 20 40 60 80 100Primary tumors (n=40)
Mutant reads Wild-type readssgp107
sgp130
% of total reads
0.8 0.4 Radiance (x107 p/sec/cm²/sr) 1.0 0.6 0.2Fig. 2. Loss of p107 accelerates tumor progression in SCLC. (A) Representative images from in vivo bioluminescence imaging of Trp53/Rb1/Cas9 animals infected with Ad5-USEC harboring the indicated sgRNAs. Animals were imaged∼5.5 mo posttumor initiation. (B) Quantification of tumor burden in Trp53/ Rb1/Cas9 animals infected with Ad5-USEC harboring control sgRNA (n= 13), sgp130 (n = 15), or sgp107 (n = 13) by in vivo bioluminescence imaging. Data are presented as means with error bars denoting 95% CI **P< 0.005, ns: not significant, 2-tailed Student’s t test. (C) Survival analysis for Trp53/Rb1/Cas9 animals infected with control sgRNA (n= 17), sgp130 (n = 15), or sgp107 (n = 17). **P < 0.005, ****P < 0.0001, log-rank (Mantel–Cox) test. (D and E) Deep sequencing of p107 or p130 genomic loci from tumors isolated from Trp53/Rb1/Cas9 animals infected with the respective sgRNAs, showing the proportion of mutant and wild-type sequencing reads (D), as well as the proportion of each indicated type of mutation for each tumor (E). FS: frameshift, NFS: nonframeshift.
GENET
Importantly, these differences were also observed in animals
an-alyzed at an earlier time point (4 mo posttumor initiation) when
tumors were still relatively small and distinct (
SI Appendix, Fig. S3
A–D
). Because tumor numbers in both sgp130- and
sgp107-infected animals were consistent between both time points (Fig.
3C and
SI Appendix, Fig. S3C
), we concluded that quantification
of tumor number and size was not confounded by the collision of
multiple independent tumors in late-stage animals.
Notably, sgp107-infected animals also displayed a greater
in-cidence of mediastinal lymph node metastasis compared with
sgp130-infected animals at this time point (Fig. 3E). This finding
is consistent with the observation that sgp107-infected animals
showed slightly reduced median survival compared with
sgp130-infected animals despite similar lung tumor burden (Fig. 2C), as
the mediastinal lymph node metastases likely accelerated the
onset of breathing difficulties in these animals.
The differences between sgp130- and sgp107-infected animals
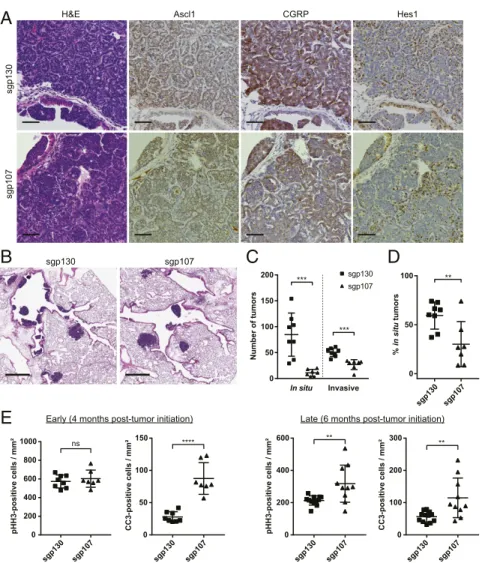
prompted us to perform additional histological analyses. As
expec-ted, tumors that developed in all animals retained the characteristic
histological features of SCLC, including positive
immunohisto-chemical staining for the neuroendocrine markers Ascl1 and CGRP
as well as heterogeneous staining for Hes1 (37) (Fig. 4A),
con-firming that the observed differences were not a result of a change
in tumor spectrum. However, sgp130-infected animals frequently
presented with numerous in situ tumors lining their major airways
at 4 mo posttumor initiation, whereas far fewer in situ tumors were
observed in sgp107-infected animals (Fig. 4
B and C). Overall, a
higher fraction of tumors in sgp130-infected animals were in situ
lesions rather than invasive tumors, compared with sgp107-infected
animals (Fig. 4D). Therefore, loss of p107 results in an altered
distribution of early tumor lesions within the lung compared with
loss of p130, suggesting that p130 loss may lead to the
trans-formation of a broader set of cells compared with p107 loss.
We also analyzed rates of proliferation and apoptosis in
tu-mors from both sets of animals. Late-stage tutu-mors from
sgp107-infected animals displayed higher proliferation rates compared
with tumors from sgp130-infected animals as measured by
in-creased phosphorylated histone H3 (pHH3) staining (Fig. 4E).
Interestingly, this difference was not observed in early-stage
tu-mors (Fig. 4E). Conversely, sgp130 tutu-mors displayed lower
ap-optosis rates compared with sgp107 tumors at both early and late
stages as measured by decreased cleaved caspase-3 (CC3) staining
(Fig. 4E). Collectively, these data demonstrate that p107 loss
re-sults in distinct consequences on SCLC development compared
with loss of p130.
To gain insight into potential mechanisms underlying the distinct
phenotypes observed between sgp107- and sgp130-infected animals,
we performed RNA sequencing (RNA-seq) on multiple independent
late-stage primary tumors isolated from infected animals (
Dataset
S1
). We employed independent component analysis (ICA) (38), an
7
0
1
p
g
s
0
3
1
p
g
s
A
N
R
g
s
l
o
r
t
n
o
C
A
B
0% 20% 40% 60% **** *** ns Tumor burden(tumor area / lung area)
Control sg sgp130 sgp107 0 50 100 150 200 250 **** **** **** Control sg sgp130 sgp107 Number of tumors 0.0 0.5 1.0 1.5 6.0 7.0 **** *** * Control sg sgp130 sgp107
Mean tumor size (mm²)
E
Control sgRNA
sgp130
sgp107
Metastasis
No metastasis
0
2
7
3
10
12
*
ns***
D
C
Fig. 3. Distinct consequences of loss of p107 and p130 on SCLC tumor progression. (A) Representative H&E-stained lung sections from Trp53/Rb1/Cas9 an-imals infected with Ad5-USEC harboring the indicated sgRNAs. Anan-imals were analyzed 6 mo posttumor initiation. (Scale bars, 2 mm.) (B–D) Quantification of tumor burden (B), number of tumors (C), and mean tumor size (D) in Trp53/Rb1/Cas9 animals infected with Ad5-USEC harboring control sgRNA (n= 12), sgp130 (n= 12), or sgp107 (n = 10), 6 mo posttumor initiation. For (D), red indicates a data point that was identified as an outlier (Grubbs’ test, α < 0.001) and excluded from subsequent analyses. Data are presented as means with error bars denoting SD. ns: not significant, *P< 0.05, ***P < 0.001, ****P < 0.0001, 2-tailed Student’s t test. (E) Quantification of the number of animals presenting with mediastinal lymph node metastasis upon necropsy at 6 mo posttumor initiation. ns: not significant, *P< 0.05, ***P < 0.001, 2-sided Fisher’s exact test.
unsupervised blind source separation technique (see
Materials and
Methods), to generate gene expression signatures characterizing
transcriptional profiles within this dataset (
SI Appendix, Fig. S4A
and
Dataset S2
). ICA was performed on autosomal genes as initial
results indicated a dominant gender-specific signature within the
dataset (reflecting a gender bias between sgp107- and
sgp130-infected animals). A statistically significant signature that
differ-entiated between sgp130 and sgp107 tumors was detected (P =
0.0104, Mann–Whitney U test) and further analyzed using gene set
enrichment analysis (GSEA) (39). We observed an enrichment for
several immune-related gene sets in sgp107 tumors (
SI Appendix,
Fig. S4B
and
Dataset S3
). To validate this observation, we
per-formed immunohistochemical staining of lung sections from
late-stage animals for several immune markers—CD45, B220, and
CD3. We observed tertiary lymphoid structure (TLS) formation in
the lungs of both sgp107- and sgp130-infected animals (Fig. 5A).
However, sgp107-infected animals harbored more TLS per tumor
compared with sgp130-infected animals (Fig. 5B), even though
there was no significant difference between the total number of
TLS in each animal (
SI Appendix, Fig. S5A
). In particular, we
observed an increase in intratumoral and peritumoral TLS, but
not extratumoral TLS, in sgp107-infected animals compared with
sgp130-infected animals (Fig. 5C and
SI Appendix, Fig. S5B
).
There-fore, these data are consistent with the RNA-seq results and indicate
an increase in immune cell infiltration in sgp107 tumors compared
with sgp130 tumors.
Discussion
Functional studies in GEMMs have long been hampered by the
need to generate new germline or conditional alleles for each
new gene of interest. Approaches such as gene targeting in
embryonic stem cells derived from GEMMs (11) have reduced
the time needed to generate new mouse models but still require
the dedication of significant time and resources. The ability
of the CRISPR-Cas9 system to generate genomic alterations in
somatic cells in vivo with high efficiency allows this process to be
bypassed (40). In this study, we have demonstrated the feasibility
of this approach in SCLC by modeling loss of p107 and p130 in
the
Trp53/Rb1 double knockout model of SCLC, showing that
loss of p107 significantly accelerates tumor progression to a similar
sgp130 sgp107 1 s e H P R G C 1 l c s A E & H sgp130 sgp107
A
B
Early (4 months post-tumor initiation) Late (6 months post-tumor initiation)
E
0 200 400 600 800 1000 ns sgp130 sgp107 pHH3-positive cells / mm² 0 50 100 150 **** sgp130 sgp107 CC3-positive cells / mm² 0 200 400 600 ** sgp130 sgp107 pHH3-positive cells / mm² 0 100 200 300 ** sgp130 sgp107 CC3-positive cells / mm²C
0 50 100 ** sgp130 sgp107 % in situ tumorsD
0 50 100 150 200 sgp130 sgp107 In situ Invasive *** *** Number of tumorsFig. 4. Histological analysis of sgp130 and sgp107 tumors. (A) Representative H&E (first column) and IHC staining of serial sections of tumors from Trp53/Rb1/ Cas9 animals infected with Ad5-USEC harboring the indicated sgRNAs. Tumors were stained for Ascl1, CGRP, or Hes1 as indicated. Animals were analyzed 4 mo posttumor initiation. (Scale bars, 50μm.) (B) Representative H&E-stained sections of major airways in the lungs from Trp53/Rb1/Cas9 animals infected with Ad5-USEC harboring the indicated sgRNAs. Animals were analyzed 4 mo posttumor initiation. (Scale bars, 500μm.) (C and D) Quantification of the number of in situ and invasive tumor lesions (C) as well as the overall percentage of in situ tumors (D) in Trp53/Rb1/Cas9 animals infected with Ad5-USEC harboring sgp130 (n= 8) or sgp107 (n = 7), 4 mo posttumor initiation. Data are presented as means with error bars denoting SD. **P < 0.005, ***P < 0.001, 2-tailed Student’s t test. (E) Quantification of pHH3-positive cells and CC3-positive cells per unit tumor area in Trp53/Rb1/Cas9 animals infected with Ad5-USEC harboring the indicated sgRNAs. Animals were analyzed 4 mo (Left) or 6 mo (Right) posttumor initiation. Data are presented as means with error bars denoting SD. ns: not significant, **P< 0.005, ****P < 0.0001, 2-tailed Student’s t test.
GENET
extent as loss of p130. However, we also observed several
differ-ences in tumor phenotype between p107-mutated and
p130-mutated tumors, indicating potential biological differences
be-tween SCLC tumors with these genotypes.
CRISPR-mediated knockout of genes has been particularly
useful for modeling loss-of-function mutations in tumor
suppres-sor genes, such as those as demonstrated here, as well as in other
models (25, 27, 30, 32). Other studies have demonstrated the
ability to generate gain-of-function alterations, such as
chromo-somal rearrangements (26), as well as homologous
recombination-mediated activation of oncogenes (25), albeit at a very low
effi-ciency in the latter case. The adaptation of CRISPR-Cas9 for
transcriptional activation or inhibition (41–46) has further
ex-tended the utility of the CRISPR-Cas9 system for modeling
ad-ditional gain-of-function mutations. In particular, the ability to
perform in vivo transcriptional activation using wild-type Cas9 has
been reported (47). We expect that similar approaches will also be
possible in SCLC using our system.
The use of autochthonous models of cancer, including SCLC,
to study metastasis has led to key insights into the molecular
determinants of metastatic spread (13, 48–50). In animals harboring
multiple independent primary tumors, the use of barcoding
tech-niques enables metastatic tumors to be matched to their respective
seeding primary tumors, so as to distinguish primary tumors based
on their metastatic potential (48, 49). By taking advantage of the
imprecise repair of CRISPR-mediated double-stranded breaks in
the cell by nonhomologous end joining, we observed that the
different combinations of mutant alleles within each tumor could
also be used as a barcode to match primary and metastatic tumors
within the same animal (
SI Appendix, Fig. S6
). Although the use of
single target sites, such as those presented in our study, may leave
some ambiguity in matching metastatic tumors to primary tumors,
the inclusion of additional sgRNAs targeting different genomic
locations can significantly reduce this ambiguity; similar
ap-proaches have been used to trace cell lineages both in vitro and
in vivo (51–53).
Due to the flexibility afforded by the CRISPR-Cas9 system, we
were able to rapidly compare the effects of loss of p107 with loss
of p130 in SCLC progression, which has not been performed
previously. Both genes are mutated in about 6% of human SCLC
tumors in a predominantly mutually exclusive fashion (5). We
found that loss of p107 in the
Trp53/Rb1-mutant background
resulted in fewer but larger tumors compared with loss of p130.
Furthermore, loss of p107 also accelerated the development of
metastatic spread in these animals. These suggest that the 2
genes may play different roles in SCLC development, with loss of
p130 appearing to promote tumor initiation and loss of p107
promoting tumor progression. p107 and p130 have been shown
A
C
B
sgp130 sgp107 0.0 0.1 0.2 0.3 0.4 Total Numb er of T LS /t umo r * sgp130 sgp107 0.0 0.1 0.2 0.3 Intratumoral + peritumoral Numb er of TLS /tumo r ** sgp130 sgp107 0.00 0.05 0.10 0.15 0.20 Extratumoral Numb er o f T LS /t umo r ns 3 D C 0 2 2 B 5 4 D C sgp130 sgp107Fig. 5. Differences in TLS formation between sgp130- and sgp107-infected animals. (A) Representative IHC staining of serial sections of tumors from Trp53/ Rb1/Cas9 animals infected with Ad5-USEC harboring the indicated sgRNAs. Tumors were stained for CD45, B220, or CD3 as indicated. Animals were analyzed 6 mo posttumor initiation. (Scale bars, 100μm.) (B) Quantification of the total number of TLS in Trp53/Rb1/Cas9 animals infected with Ad5-USEC harboring sgp130 (n= 12) or sgp107 (n = 10), normalized to tumor number per animal. Animals were analyzed 6 mo posttumor initiation. (C) Quantification of number of intratumoral and peritumoral TLS (Left) or extratumoral TLS (Right), normalized to tumor number per animal in the same cohort of animals. Data in B and C are presented as means with error bars denoting SD. ns: not significant, *P< 0.05, **P < 0.005, 2-tailed Student’s t test.
to exhibit different timings of expression and interaction with
E2F family proteins during the cell cycle (54, 55), as well as to
interact with different downstream effectors (56). p107 and p130
have also previously been reported to have distinct roles in lung
epithelial development (57). Deletion of
Rb1 in the lung
epi-thelium of
p107
−/−animals results in increased pulmonary
epi-thelial proliferation in E18.5 embryos compared with deletion of
Rb1 in p107
+/+animals, while having no effect on apoptosis.
Conversely, deletion of
Rb1 in p130
−/−animals results in
de-creased apoptosis but has no effect on proliferation. We
dem-onstrate that p107 and p130 play similar roles in the context of
SCLC development, with loss of p107 in SCLC tumors resulting
in increased proliferation and loss of p130 resulting in decreased
apoptosis. This provides a potential explanation for the observed
differences in tumor phenotypes. Loss of p130 may allow for
nascent transformed cells to escape apoptosis, resulting in an
increase in the number of initiated tumors, whereas loss of p107
results in an increase in proliferation rate of developing tumors
and, hence, larger tumor size without affecting tumor initiation.
In addition, we observed a difference in the number of
tumor-associated TLS formed in the lungs of sgp107-infected animals
compared with sgp130-infected animals. TLS represent sites of T
and B cell priming and have been associated with a positive
prognosis in many tumor types (58, 59). Previous work has
dem-onstrated that TLS can be induced by several different cytokines,
including IL-17, TNFα, and IL-6 (60). Collectively, the difference
in tumor-associated TLS suggests that there are alterations to the
inflammatory nature of the microenvironment in p130- and
p107-mutant tumors and may indicate differences in the overarching
antitumor immune response. Collectively, these alterations may
have therapeutic implications, potentially influencing the response
of these tumors to various types of immunotherapy, although more
work will be needed to establish the relevance of this observation.
To summarize, we have demonstrated the feasibility of using
the CRISPR-Cas9 system for modeling loss of tumor suppressor
genes in an autochthonous mouse model of SCLC. This opens
the door for rapid functional validation of other candidate genes
of interest that are frequently mutated in SCLC. In addition, we
anticipate that this approach, combined with ongoing advances
in CRISPR-based tools for genetic and transcriptomic
pertur-bations, as well as developments in the use of lentiviral vectors
with in vivo models of SCLC (61), will also be useful for
vali-dation of therapeutic targets for SCLC in the future.
Materials and Methods
Animal Studies. All animal studies were approved by the MIT Institutional Animal Care and Use Committee. All mice were maintained on a mixed C57BL/ 6;129/Sv background. Trp53flox/flox; Rb1flox/flox; Rosa26LSL-Luciferase/LSL-Luciferasemice
have been described previously (9, 12). Tumors were initiated by intratracheal delivery of 2 × 10⁸ plaque-forming units of adenovirus expressing Cre recombinase as previously described (35). Animals were infected at∼8–12 wk of age. Adenovirus stocks were prepared and titered as described below. For in vivo bioluminescence imaging, mice were anesthetized by isoflurane in-halation, administered with 150 mg/kg ofD-luciferin (PerkinElmer #122799) by i.p. injection, then imaged 10-min postadministration using the IVIS Spectrum In Vivo Imaging System (PerkinElmer). Visualization and quantification of the bioluminescence signal was performed using Living Image (PerkinElmer).
For all animal studies, at least 7 animals were used per condition for each experimental cohort. We estimated that this would be sufficient to detect a biologically relevant difference in survival, based on the observed variation in tumor progression from previous studies (7, 9). No animals were excluded from analyses. Animals were allocated randomly across different conditions with approximately even distribution based on sex and age.
Generation of LSL-Cas9-GFP-Csy4 Allele. The Rosa26-CAGGS-LSL-Cas9-GFP-Csy4 targeting vector was generated using constructs gener-ated for the Gibson assembly-based modular assembly platform (GMAP) as described previously (62). In brief, the 3xFLAG-NLS-hSpCas9-2A-GFP-2A-Csy4 gene C fragment was cloned into the CAG-driven R26TV LSL backbone tar-geting vector by Gibson assembly using the conditions described for GMAP.
The assembled Rosa26-CAGGS-LSL-Cas9-GFP-Csy4 targeting vector was linearized by digestion with BsmBI (New England Biolabs). Around 40μg of the linearized vector was transfected by electroporation into mixed B6;129 embryonic stem cells, followed by selection with 350-μg/mL G418 (Life Technologies) for 7 d. Clones were screened by PCR and sequencing to confirm correct targeting into the Rosa26 locus, then injected into CD1 do-nor blastocysts to generate chimeric mice. High-degree chimeric mice were crossed into the Trp53flox/flox; Rb1flox/flox; Rosa26LSL-Luciferase/LSL-Luciferasebackground
to obtain stocks of Trp53flox/flox; Rb1flox/flox; Rosa26LSL-Cas9-GFP-Csy4/LSL-Luciferasemice
for experiments.
Generation of Ad5-USEC Vectors. To generate a GMAP-compatible adenoviral vector, a filler sequence containing site #1 (GATCAGTGTGAGGGAGTG-TAAAGCTGGTTT) and site #5 (AAACGTTGTTGTTTGGGGTTGAATTACTCT) was amplified by PCR using lentiCRISPRv2 (36) as a template and the Ad5-GMAP-filler-F and Ad5-GMAP-filler-R primers, digested with XhoI and EcoRI (New England Biolabs), then ligated into XhoI/EcoRI-digested pacAd5 shuttle vec-tor (63). The resulting vecvec-tor was linearized with BspEI (New England Biolabs) for subsequent Gibson assembly. Primer sequences are listed inSI Appendix, Table S1.
sgRNAs targeting p107, p130, and a control unannotated region on mouse chromosome 4 were designed using the Broad Institute sgRNA de-signer tool (64). sgRNA sequences are listed inSI Appendix, Table S2. sgRNAs were cloned into lentiCRISPRv2 using the recommended protocol (36). GMAP-compatible U6-sgRNA cloning fragments for each sgRNA were am-plified by PCR from the corresponding lentiCRISPRv2-sgRNA vectors using the U6-pA-F and tracrRNA-gA-R primers (SI Appendix, Table S1). Ad5-USEC vectors were assembled by Gibson assembly using the BspEI-linearized ad-enoviral vector, U6-sgRNA cloning fragments, as well as pEFS promoter B and NLS-Cre gene B parts from the GMAP collection (62). All vectors were verified by sequencing before use. Adenoviral vectors were packaged at the Viral Vector Core of the Horae Gene Therapy Center, University of Mas-sachusetts Medical School.
Cell Culture. All cell lines were maintained in DMEM (Corning #10–013-CV) supplemented with 10% FBS, 2-mML-glutamine (Gibco #25030), and 50-μg/mL gentamicin (Gibco #15710). Lentiviral vectors were generated in HEK293T cells. In brief, cells were plated 1 d before transfection, then cotransfected with lentiviral constructs and packaging plasmids psPAX2 and pMD2.G (Addgenes #12260 and #12259; both plasmids were gifts from Didier Trono). Viral su-pernatant was harvested 48 and 72 h after transfection, then frozen at−80 °C. Green-Go reporter cells (27) were transduced with lentiCas9-Blast virus (Addgene #52962; plasmid was a gift from Feng Zhang), then selected with 20-μg/mL blasticidin S (Gibco #A11139) for 7 d. All cell lines were tested and found to be negative for mycoplasma contamination before experiments. Flow Cytometry. Cells were trypsinized, centrifuged at 1,000 rpm (∼200 × g) for 5 min, resuspended in FACS buffer (PBS, 0.5% FBS, 2-mM EDTA), then filtered through a 35-μm cell strainer (Corning #352235). Samples were sorted on a BD FACSAria III system (BD Biosciences).
Immunoblotting. Cells were lysed with RIPA lysis buffer (Thermo Scientific #89900) supplemented with a 1× protease and phosphatase inhibitor mix-ture (Thermo Scientific #78440), rotated at 4 °C for 30 min, then centrifuged at 13,000× g for 30 min. Protein concentration was quantified using the bicinchoninic acid assay (Thermo Scientific #23225). Around 40μg of protein was run on a 4–12% Bis-Tris gradient gel (Invitrogen #NP0335), then trans-ferred onto a nitrocellulose membrane. The following primary antibodies were used for immunoblotting: rabbit anti-p107 (Santa Cruz #sc-318, 1:500), rabbit anti-p130 (Santa Cruz #sc-317, 1:500), and rabbit anti-β-actin (Cell Sig-naling Technology #4970, 1:10,000). Primary antibodies were detected with the following fluorescent secondary antibodies: IRDye 680RD donkey anti-rabbit IgG (LI-COR #926–68073, 1:10,000), IRDye 800CW donkey anti-rabbit IgG (LI-COR # 926–32,213, 1:10,000). Immunoblots were imaged using the LI-COR Od-yssey infrared imager and quantified using Image Studio (LI-COR).
Genomic DNA Isolation and Deep Sequencing of Target Loci. Tumor tissues were dissected from lungs, lymph nodes, or liver tissue upon necropsy, snap-frozen in liquid nitrogen, then stored at−80 °C until subsequent processing. Genomic DNA was isolated from tumors using the Gentra PureGene tissue kit (QIAGEN #158667). Genomic loci were amplified by PCR using either Herculase II Fusion DNA Polymerase (Agilent #600675) for control sgRNA samples or KAPA HiFi DNA polymerase (KAPA Biosystems #KK2601) for sgp107 and sgp130 samples. Primer sequences are listed inSI Appendix, Table S3. Amplified samples were purified using the QIAquick PCR purification kit
GENET
(QIAGEN #28104), then submitted for deep sequencing using the CRISPR sequencing service at the DNA Core of the Center for Computational & In-tegrative Biology (CCIB), Massachusetts General Hospital. Sequence variant detection was performed by the CCIB DNA Core using their standard algorithm.
RNA Isolation and RNA Sequencing. Snap-frozen tumors stored at−80 °C were disrupted and homogenized using the Geno/Grinder (SPEX SamplePrep), then total RNA and genomic DNA were isolated using the AllPrep DNA/RNA mini kit (QIAGEN #80204). RNA samples were submitted for sequencing li-brary preparation by the MIT BioMicro Center using the KAPA mRNA hyperprep kit, and RNA-seq was performed on an Illumina HiSeq 2000 sys-tem (40-nt single-end reads).
Gene Expression Signature Analyses. Illumina HiSeq 2000 40-base single-end reads were mapped to the UCSC mm9 mouse genome build (http:// genome.ucsc.edu/) using Bowtie (65), and expression counts were quantified using RSEM (66). Raw estimated expression counts were upper-quartile nor-malized to a count of 1,000 (67). Genes with low nornor-malized counts (upper quartile of a gene’s expression across all samples <20) were filtered out as lowly expressed and eliminated from further analyses.
A high-resolution signature discovery approach, independent component analysis (ICA), was employed to characterize global gene expression profiles, as described previously (68–72). This unsupervised blind source separation technique was used on this discrete count-based expression dataset to elu-cidate statistically independent and biologically relevant signatures. ICA is a signal processing and multivariate data analysis technique in the category of unsupervised matrix factorization methods. Conceptually, ICA decomposes the overall expression dataset into independent signals (gene expression patterns) that represent distinct signatures. High-ranking positively and negatively correlated genes in each signature represent gene sets that drive the corresponding expression pattern (in either direction). Each signature is, thus, 2 sided, allowing for identification of up-regulated and down-regulated genes for each signature within each sample. Formally, utilizing input data consisting of a genes-samples matrix, ICA uses higher order moments to characterize the dataset as a linear combination of statistically independent latent variables. These latent variables represent independent components based on maximizing non-Gaussianity and can be interpreted as independent source signals that have been mixed together to form the dataset under consideration. Each component includes a weight assignment to each gene that quantifies its contribution to that component (signature or latent variable matrix). Additionally, ICA derives a mixing matrix that describes the contribution of each sample toward the signal embodied in each component. This mixing matrix can be used to select signatures among components with distinct gene expression profiles across the set of samples. The R implementation of the core joint approximate diagonalization of eigenmatrices (JADE) algorithm (73–75) was used along with custom R util-ities. Signatures were visualized using the Hinton diagram (R plotrix library), and statistical significance of biologically relevant signatures was assessed using the Mann–Whitney–Wilcoxon test (α = 0.05).
Initial signature analysis with all chromosomes detected a strong gender-based signature reflecting the known gender bias within the sample set. Subsequent analysis was restricted to autosomes and detected a biologically relevant (sgp107 vs. sgp130) statistically significant (P= 0.0104) signature, which was used for downstream enrichment analysis.
All RNA-seq analyses were conducted in the R Statistical Programming language (http://www.r-project.org/). GSEA was carried out using the pre-ranked mode with default settings (39).
Histology and Immunohistochemistry (IHC). Harvested tissues were fixed with zinc formalin (Polysciences #21516) overnight at room temperature, then transferred to 70% ethanol until subsequent paraffin embedding. H&E staining was performed on 4-μm tissue sections using the Varistain Gemini ES Automated Slide Stainer (Thermo Shandon).
For IHC staining, antigen retrieval was performed in sodium citrate buffer (10 mM, pH 6.0) at 125 °C for 5 min. Endogenous peroxidase activity was blocked at room temperature for 30 min using the Dako dual endogenous enzyme block (Dako #S2003). Slides were stained using the ImmPRESS HRP anti-rabbit IgG (peroxidase) polymer detection kit (Vector Laboratories #MP-7401), the ImmPRESS HRP anti-rat IgG, mouse adsorbed (peroxidase) poly-mer detection kit (Vector Laboratories #MP-7444), or the mouse on mouse ImmPRESS HRP (peroxidase) polymer kit (Vector Laboratories #MP-2400). The following primary antibodies were used: antiphosphohistone H3 (Ser10; Cell Signaling Technology #9701, 1:200), anti-CC3 (Asp175; Cell Sig-naling Technology #9661, 1:200), anti-Ascl1/Mash1 (BD Biosciences #556604, 1:200), anti-CGRP (Sigma-Aldrich #C8198, 1:2,500), anti-Hes1 (D6P2U; Cell Signaling Technology #11988, 1:200), anti-CD45 (Abcam #ab10558, 1:1,000), anti-CD3 (Cell Marque #103A-7, 1:200), and anti-CD45R/B220 (RA3-6B2; BioLegend #103201, 1:100). The staining was visualized with DAB (Vector Laboratories #SK-4100), and slides were counterstained with hematoxylin. Tumor Burden Analysis and IHC Quantification. H&E-stained and IHC-stained slides were imaged using the Aperio AT2 slide scanner (Leica Biosystems) and visualized using either Aperio ImageScope (Leica Biosystems) or QuPath (76). Tumor regions and total lung area were outlined and quantified in either ImageScope or QuPath. Tumor burden was calculated as the percentage of tumor area over the total lung area as measured from the largest cross-sectional region of the lung lobes. Quantification of pHH3 and CC3-positive cells was performed using the positive cell detection analysis tool in QuPath. All analyses were performed in a blinded fashion with the investigator being unaware of the experimental condition while outlining tumor regions for each slide.
Statistical Analyses. All statistical tests were performed using Prism software version 7.02 (GraphPad). P values for comparisons between 2 groups (in Figs. 2–5 andSI Appendix, Figs. S3 and S5) were determined by the 2-tailed Stu-dent’s t test. Outlier analysis (in Fig. 3D) was performed using the Grubbs’ test with a significance level of 0.001. P values for survival analyses (in Fig. 2C) were determined by the log-rank (Mantel–Cox) test. P values for con-tingency tables (in Fig. 3E) were determined by Fisher’s exact test. For all statistical tests, a P value of<0.05 was used to denote statistical significance. All error bars denote the SD except for Fig. 2B where error bars denote 95% CI.
ACKNOWLEDGMENTS. We thank Wen Xue (University of Massachusetts Medical School) for assistance with packaging adenoviral vectors as well as past and present members of the Jacks Laboratory, particularly Francisco Sánchez-Rivera, Rodrigo Romero, Santiago Naranjo, Tuomas Tammela, Leanne Li, and Caterina Colón for helpful discussions and technical advice. We thank the Koch Institute Swanson Biotechnology Center for technical support, specifically the Animal Imaging & Preclinical Testing Core Facility, the Flow Cytometry Core Facility, and the Hope Babette Tang (1983) Histol-ogy Facility. This work was supported by the Howard Hughes Medical In-stitute, the Ludwig Center for Molecular Oncology at MIT, and, in part, by the Koch Institute Support (core) Grant P30-CA14051 from the National Cancer Institute. S.R.N. was supported by the A*STAR (Agency for Science, Technology and Research, Singapore) National Science Scholarship and the MIT School of Science Fellowship in Cancer Research. T.J. is a Howard Hughes Medical Institute Investigator, the David H. Koch Professor of Biology, and a Daniel K. Ludwig Scholar at MIT.
1. R. Govindan et al., Changing epidemiology of small-cell lung cancer in the United States over the last 30 years: Analysis of the surveillance, epidemiologic, and end results database. J. Clin. Oncol. 24, 4539–4544 (2006).
2. R. Califano, A. Z. Abidin, R. Peck, C. Faivre-Finn, P. Lorigan, Management of small cell lung cancer: Recent developments for optimal care. Drugs 72, 471–490 (2012). 3. I. K. Demedts, K. Y. Vermaelen, J. P. van Meerbeeck, Treatment of extensive-stage small
cell lung carcinoma: Current status and future prospects. Eur. Respir. J. 35, 202–215 (2010). 4. L. A. Byers, C. M. Rudin, Small cell lung cancer: Where do we go from here? Cancer
121, 664–672 (2015).
5. J. George et al., Comprehensive genomic profiles of small cell lung cancer. Nature 524, 47–53 (2015).
6. I. I. Wistuba, A. F. Gazdar, J. D. Minna, Molecular genetics of small cell lung carcinoma. Semin. Oncol. 28 (suppl. 4), 3–13 (2001).
7. R. Meuwissen et al., Induction of small cell lung cancer by somatic inactivation of both Trp53 and Rb1 in a conditional mouse model. Cancer Cell 4, 181–189 (2003).
8. B. E. Schaffer et al., Loss of p130 accelerates tumor development in a mouse model for human small-cell lung carcinoma. Cancer Res. 70, 3877–3883 (2010).
9. D. G. McFadden et al., Genetic and clonal dissection of murine small cell lung carci-noma progression by genome sequencing. Cell 156, 1298–1311 (2014).
10. M. Cui et al., PTEN is a potent suppressor of small cell lung cancer. Mol. Cancer Res. 12, 654–659 (2014).
11. I. J. Huijbers et al., Rapid target gene validation in complex cancer mouse models using re-derived embryonic stem cells. EMBO Mol. Med. 6, 212–225 (2014). 12. A. L. Dooley et al., Nuclear factor I/B is an oncogene in small cell lung cancer. Genes
Dev. 25, 1470–1475 (2011).
13. S. K. Denny et al., Nfib promotes metastasis through a widespread increase in chro-matin accessibility. Cell 166, 328–342 (2016).
14. E. A. Semenova et al., Transcription factor NFIB is a driver of small cell lung cancer progression in mice and marks metastatic disease in patients. Cell Rep. 16, 631–643 (2016).
15. N. Wu et al., NFIB overexpression cooperates with Rb/p53 deletion to promote small cell lung cancer. Oncotarget 7, 57514–57524 (2016).
16. G. Mollaoglu et al., MYC drives progression of small cell lung cancer to a variant neuroendocrine subtype with vulnerability to aurora kinase inhibition. Cancer Cell 31, 270–285 (2017).
17. D. Jia et al., Crebbp loss drives small cell lung cancer and increases sensitivity to HDAC inhibition. Cancer Discov. 8, 1422–1437 (2018).
18. B. Vogelstein et al., Cancer genome landscapes. Science 339, 1546–1558 (2013). 19. M. S. Lawrence et al., Mutational heterogeneity in cancer and the search for new
cancer-associated genes. Nature 499, 214–218 (2013).
20. M. Peifer et al., Integrative genome analyses identify key somatic driver mutations of small-cell lung cancer. Nat. Genet. 44, 1104–1110 (2012).
21. C. M. Rudin et al., Comprehensive genomic analysis identifies SOX2 as a frequently amplified gene in small-cell lung cancer. Nat. Genet. 44, 1111–1116 (2012). 22. M. Jinek et al., RNA-programmed genome editing in human cells. eLife 2, e00471
(2013).
23. L. Cong et al., Multiplex genome engineering using CRISPR/Cas systems. Science 339, 819–823 (2013).
24. P. Mali et al., RNA-guided human genome engineering via Cas9. Science 339, 823–826 (2013).
25. W. Xue et al., CRISPR-mediated direct mutation of cancer genes in the mouse liver. Nature 514, 380–384 (2014).
26. D. Maddalo et al., In vivo engineering of oncogenic chromosomal rearrangements with the CRISPR/Cas9 system. Nature 516, 423–427 (2014).
27. F. J. Sánchez-Rivera et al., Rapid modelling of cooperating genetic events in cancer through somatic genome editing. Nature 516, 428–431 (2014).
28. R. J. Platt et al., CRISPR-Cas9 knockin mice for genome editing and cancer modeling. Cell 159, 440–455 (2014).
29. L. E. Dow et al., Inducible in vivo genome editing with CRISPR-Cas9. Nat. Biotechnol. 33, 390–394 (2015).
30. S.-H. Chiou et al., Pancreatic cancer modeling using retrograde viral vector delivery and in vivo CRISPR/Cas9-mediated somatic genome editing. Genes Dev. 29, 1576–1585 (2015).
31. J. Roper et al., In vivo genome editing and organoid transplantation models of co-lorectal cancer and metastasis. Nat. Biotechnol. 35, 569–576 (2017).
32. J. Huang et al., Generation and comparison of CRISPR-Cas9 and Cre-mediated ge-netically engineered mouse models of sarcoma. Nat. Commun. 8, 15999 (2017). 33. R. E. Haurwitz, M. Jinek, B. Wiedenheft, K. Zhou, J. A. Doudna, Sequence- and
structure-specific RNA processing by a CRISPR endonuclease. Science 329, 1355–1358 (2010).
34. L. Nissim, S. D. Perli, A. Fridkin, P. Perez-Pinera, T. K. Lu, Multiplexed and pro-grammable regulation of gene networks with an integrated RNA and CRISPR/Cas toolkit in human cells. Mol. Cell 54, 698–710 (2014).
35. M. DuPage, A. L. Dooley, T. Jacks, Conditional mouse lung cancer models using ad-enoviral or lentiviral delivery of Cre recombinase. Nat. Protoc. 4, 1064–1072 (2009). 36. N. E. Sanjana, O. Shalem, F. Zhang, Improved vectors and genome-wide libraries for
CRISPR screening. Nat. Methods 11, 783–784 (2014).
37. J. S. Lim et al., Intratumoural heterogeneity generated by Notch signalling promotes small-cell lung cancer. Nature 545, 360–364 (2017).
38. A. Hyvärinen, E. Oja, Independent component analysis: Algorithms and applications. Neural Netw. 13, 411–430 (2000).
39. A. Subramanian et al., Gene set enrichment analysis: A knowledge-based approach for interpreting genome-wide expression profiles. Proc. Natl. Acad. Sci. U.S.A. 102, 15545–15550 (2005).
40. F. J. Sánchez-Rivera, T. Jacks, Applications of the CRISPR-Cas9 system in cancer bi-ology. Nat. Rev. Cancer 15, 387–395 (2015).
41. L. A. Gilbert et al., CRISPR-mediated modular RNA-guided regulation of transcription in eukaryotes. Cell 154, 442–451 (2013).
42. A. Chavez et al., Highly efficient Cas9-mediated transcriptional programming. Nat. Methods 12, 326–328 (2015).
43. M. E. Tanenbaum, L. A. Gilbert, L. S. Qi, J. S. Weissman, R. D. Vale, A protein-tagging system for signal amplification in gene expression and fluorescence imaging. Cell 159, 635–646 (2014).
44. S. Konermann et al., Genome-scale transcriptional activation by an engineered CRISPR-Cas9 complex. Nature 517, 583–588 (2015).
45. J. E. Dahlman et al., Orthogonal gene knockout and activation with a catalytically active Cas9 nuclease. Nat. Biotechnol. 33, 1159–1161 (2015).
46. P. Perez-Pinera et al., RNA-guided gene activation by CRISPR-Cas9-based transcription factors. Nat. Methods 10, 973–976 (2013).
47. H.-K. Liao et al., In vivo target gene activation via CRISPR/Cas9-mediated trans-epigenetic modulation. Cell 171, 1495–1507.e15 (2017).
48. M. M. Winslow et al., Suppression of lung adenocarcinoma progression by Nkx2-1. Nature 473, 101–104 (2011).
49. C. H. Chuang et al., Molecular definition of a metastatic lung cancer state reveals a targetable CD109-Janus kinase-Stat axis. Nat. Med. 23, 291–300 (2017).
50. S. H. Chiou et al., BLIMP1 induces transient metastatic heterogeneity in pancreatic cancer. Cancer Discov. 7, 1184–1199 (2017).
51. A. McKenna et al., Whole-organism lineage tracing by combinatorial and cumulative genome editing. Science 353, aaf7907 (2016).
52. R. Kalhor, P. Mali, G. M. Church, Rapidly evolving homing CRISPR barcodes. Nat. Methods 14, 195–200 (2017).
53. K. L. Frieda et al., Synthetic recording and in situ readout of lineage information in single cells. Nature 541, 107–111 (2017).
54. J. R. Nevins, Toward an understanding of the functional complexity of the E2F and retinoblastoma families. Cell Growth Differ. 9, 585–593 (1998).
55. E. J. Smith, G. Leone, J. DeGregori, L. Jakoi, J. R. Nevins, The accumulation of an E2F-p130 transcriptional repressor distinguishes a G0 cell state from a G1 cell state. Mol. Cell. Biol. 16, 6965–6976 (1996).
56. S. E. Wirt, J. Sage, p107 in the public eye: An Rb understudy and more. Cell Div. 5, 9 (2010).
57. D. S. Simpson, N. A. Mason-Richie, C. A. Gettler, K. A. Wikenheiser-Brokamp, Reti-noblastoma family proteins have distinct functions in pulmonary epithelial cells in vivo critical for suppressing cell growth and tumorigenesis. Cancer Res. 69, 8733– 8741 (2009).
58. N. Hiraoka, Y. Ino, R. Yamazaki-Itoh, Tertiary lymphoid organs in cancer tissues. Front. Immunol. 7, 244 (2016).
59. C. Sautès-Fridman et al., Tertiary lymphoid structures in cancers: Prognostic value, regulation, and manipulation for therapeutic intervention. Front. Immunol. 7, 407 (2016).
60. C. D. Buckley, F. Barone, S. Nayar, C. Bénézech, J. Caamaño, Stromal cells in chronic inflammation and tertiary lymphoid organ formation. Annu. Rev. Immunol. 33, 715– 745 (2015).
61. Y. Xia et al., Targeting CREB pathway suppresses small cell lung cancer. Mol. Cancer Res. 16, 825–832 (2018).
62. E. H. Akama-Garren et al., A modular assembly platform for rapid generation of DNA constructs. Sci. Rep. 6, 16836 (2016).
63. R. D. Anderson, R. E. Haskell, H. Xia, B. J. Roessler, B. L. Davidson, A simple method for the rapid generation of recombinant adenovirus vectors. Gene Ther. 7, 1034–1038 (2000).
64. J. G. Doench et al., Optimized sgRNA design to maximize activity and minimize off-target effects of CRISPR-Cas9. Nat. Biotechnol. 34, 184–191 (2016).
65. B. Langmead, C. Trapnell, M. Pop, S. L. Salzberg, Ultrafast and memory-efficient alignment of short DNA sequences to the human genome. Genome Biol. 10, R25 (2009).
66. B. Li, C. N. Dewey, RSEM: Accurate transcript quantification from RNA-seq data with or without a reference genome. BMC Bioinf. 12, 323 (2011).
67. J. H. Bullard, E. Purdom, K. D. Hansen, S. Dudoit, Evaluation of statistical methods for normalization and differential expression in mRNA-Seq experiments. BMC Bioinf. 11, 94 (2010).
68. C. M. C. Li et al., Foxa2 and Cdx2 cooperate with Nkx2-1 to inhibit lung adenocarci-noma metastasis. Genes Dev. 29, 1850–1862 (2015).
69. N. Dimitrova et al., Stromal expression of miR-143/145 promotes neoangiogenesis in lung cancer development. Cancer Discov. 6, 188–201 (2016).
70. T. Papagiannakopoulos et al., Circadian rhythm disruption promotes lung tumori-genesis. Cell Metab. 24, 324–331 (2016).
71. R. Romero et al., Keap1 loss promotes Kras-driven lung cancer and results in de-pendence on glutaminolysis. Nat. Med. 23, 1362–1368 (2017).
72. G. Mollaoglu et al., The lineage-defining transcription factors SOX2 and NKX2-1 determine lung cancer cell fate and shape the tumor immune microenvironment. Immunity 49, 764–779.e9 (2018).
73. J. Miettinen, K. Nordhausen, S. Taskinen, Blind source separation based on joint di-agonalization in R : The packages JADE and BSSasymp. J. Stat. Softw., 10.18637/ jss.v076.i02 (2017).
74. D. N. Rutledge, D. Jouan-Rimbaud Bouveresse, Independent components analysis with the JADE algorithm. TrAC Trends Analyt. Chem. 50, 22–32 (2013).
75. A. Biton et al., Independent component analysis uncovers the landscape of the bladder tumor transcriptome and reveals insights into luminal and basal subtypes. Cell Rep. 9, 1235–1245 (2014).
76. P. Bankhead et al., QuPath: Open source software for digital pathology image analysis. Sci. Rep. 7, 16878 (2017).
GENET