HAL Id: hal-01957100
https://hal.inria.fr/hal-01957100
Submitted on 17 Dec 2018HAL is a multi-disciplinary open access archive for the deposit and dissemination of sci-entific research documents, whether they are pub-lished or not. The documents may come from teaching and research institutions in France or abroad, or from public or private research centers.
L’archive ouverte pluridisciplinaire HAL, est destinée au dépôt et à la diffusion de documents scientifiques de niveau recherche, publiés ou non, émanant des établissements d’enseignement et de recherche français ou étrangers, des laboratoires publics ou privés.
Its all about connections: hubs and invasion in habitat
networks
Thibaut Morel-Journel, Claire Rais Assa, Ludovic Mailleret, Elodie Vercken
To cite this version:
Thibaut Morel-Journel, Claire Rais Assa, Ludovic Mailleret, Elodie Vercken. Its all about connec-tions: hubs and invasion in habitat networks. Ecology Letters, Wiley, 2019, 22 (2), pp.313-321. �10.1111/ele.13192�. �hal-01957100�
Title: It’s all about connections: hubs and invasion in habitat networks
1
Authors: Thibaut Morel-Journel1, Claire Rais Assa2, Ludovic Mailleret2,3, Elodie Vercken2 2
Affiliations:
3
1 Earth and Life Institute, Biodiversity Research Centre, Université Catholique de Louvain,
4
Louvain-la-Neuve, Belgium 5
2 Université Côte d'Azur, INRA, CNRS, ISA, 06900 Sophia Antipolis, France
6
3 Université Côte d'Azur, Inria, INRA, CNRS, UPMC Univ. Paris 06, 06900 Sophia Antipolis,
7
France 8
Running title: Hubs and invasion in habitat networks
9
Keywords: Allee effect; connectivity; establishment; hub; individual-based model; invasion;
10
microcosm; network; simulation; spread 11
Type of article: Letters
12
Number of words: 148 (abstract), 4970 (main text)
13 Number of references: 66 14 Number of figures: 2 15 Number of tables: 1 16
Corresponding author: Thibaut Morel-Journel (tel: +3210472759; e-mail: 17
thibaut.morel@uclouvain.be) 18
Statement of authorship: TMJ, LM and EV designed the model and experiments; TMJ and
19
CRA carried out the simulations, experiments and data analyses; all authors participated in the 20
writing of the manuscript and gave their final approval for publication. 21
Data accessibility statement: Should the manuscript be accepted, the data supporting the
22
results and the simulation code will be archived in Dryad and the data DOI will be included at 23
the end of the article. 24
Abstract
1
During the early stages of invasion, the interaction between the features of the invaded 2
landscape, notably its spatial structure, and the internal dynamics of an introduced population, 3
has a crucial impact on establishment and spread. By approximating introduction areas as 4
networks of patches linked by dispersal, we characterized their spatial structure with specific 5
metrics and tested their impact on two essential steps of the invasion process: establishment and 6
spread. By combining simulations with experimental introductions of Trichogramma chilonis 7
(Hymenoptera: Trichogrammatidae) in artificial laboratory microcosms, we demonstrated that 8
spread was hindered by clusters and accelerated by hubs but was also affected by small-9
population mechanisms prevalent for invasions, such as Allee effects. Establishment was also 10
affected by demographic mechanisms, in interaction with network metrics. These results 11
highlight the importance of considering the demography of invaders as well as the structure of 12
the invaded area to predict the outcome of invasions. 13
Introduction
1
Managing invasions becomes increasingly costly and decreasingly efficient with the expansion 2
of the invaded area (Simberloff et al. 2013). In invasion biology, focus is placed on the 3
processes occurring during the first generations after the introduction of an exotic species, 4
before its proliferation and spread besides the introduction site. The dispersal abilities of 5
individuals during invasions and the way they evolve over the course of the range expansion 6
have been documented theoretically (Travis et al. 2009; Burton et al. 2010) and experimentally, 7
notably among protists (Fronhofer & Altermatt 2015) and arthropods (Ochocki & Miller 2017; 8
Weiss-Lehman et al. 2017). Although the role of individual characteristics on the spread 9
patterns is well known, the way individuals disperse across a landscape also depends on the 10
interaction between individuals and the features of the environment (Calabrese & Fagan 2004), 11
which can themselves affect the evolution of dispersal (Baguette & Van Dyck 2007). Therefore, 12
understanding the structure of the invaded landscape is also essential to understand the patterns 13
of colonization observed during the first stages of an invasion. 14
Networks have gained popularity in the last decades as a method to represent the spatial 15
structure of such landscapes (Urban & Keitt 2001; Minor & Urban 2007). They are used to 16
represent habitat patches suitable for the species considered (the vertices of the network) and 17
the way dispersal connects them (the edges of the network). Networks are a powerful tool 18
associated with various metrics and used across a variety of scientific fields, but they are still 19
seldom used in invasion biology. In this field, they are classically used to describe food webs, 20
to study how they are impacted by non-native species or to assess the invasibility of a 21
community based on its trophic structure (Romanuk et al. 2009; Lurgi et al. 2014). A few 22
studies also represent the spatial structure of riverine systems as networks, to study the impact 23
of the network structure on the composition of a community invading a new environment 24
(Seymour & Altermatt 2014; Alther & Altermatt 2018). This study aims at using networks in 25
another way: to investigate the establishment and spread of the invader, with a special focus on 26
small-population demographic processes. 27
Although few usages of networks are recorded in invasion biology, other fields provide 28
insight about the impact of the spatial structure of the introduction area on the first stages of an 29
invasion. Notably, several epidemiology studies correlate specific metrics with patterns of 30
spread. A prime example is the combination of networks with models derived from classical 31
Susceptible-Infected (SI) models (Kermack & McKendrick 1927), e.g. to study the spread of 32
nosocomial infections in hospitals (Ueno & Masuda 2008) or the transmission of pathogens 33
through grooming among macaques (Romano et al. 2016). These studies usually consider 34
networks made up of hosts (the vertices) connected by social interactions (the edges). Other 35
studies consider larger-scale networks, in which vertices are populations of hosts and edges are 36
host movements between populations (Arino & Van den Driessche 2006). Such a framework 37
has for example been used to explain the extent of plague during the fourteenth century (Gómez 38
& Verdú 2017) or to assess epidemic risks in the Japanese airline network (Tanaka et al. 2014). 39
The conceptual similarities between the spread of disease outbreaks and the spread of invading 40
organisms have led studies in invasion biology to use models originating from epidemiological 41
modelling. They notably have been used to study the impact of landscape structure on the risks 42
of invasive spread through forests (Ferrari & Lookingbill 2009) or across marinas via ballast 43
waters (Floerl et al. 2009). However, these studies fail to consider the internal dynamics of each 44
patch. Moreover, this impact of network structure on invasion remains to be experimentally 45
tested. 46
Networks are also often used in conservation biology, notably to map the structure of 47
existing metapopulations, in terrestrial (Bunn et al. 2000; Urban & Keitt 2001), marine (Treml 48
et al. 2008; Almany et al. 2009) and riverine contexts (Schick & Lindley 2007). Network
49
metrics are notably used to describe the connectivity between sub-populations, to study the 50
mean lifetime of metapopulations (e.g. Bode et al. 2008; Drechsler 2009; Kininmonth et al. 51
2010; Shtilerman & Stone 2015) or the extinction risks of sub-populations (e.g. Gilarranz & 52
Bascompte 2012; Peck 2012; Webb & Padgham 2013). They are also used to identify essential 53
populations to maintain connectivity in a landscape (Bodin & Saura 2010; Baranyi et al. 2011; 54
Watson et al. 2011). Yet, those studies often focus on the dispersal capabilities of individuals 55
(Bodin & Saura 2010; Baranyi et al. 2011) or consider local population dynamics only through 56
global colonization and extinction probabilities, without considering explicitly the internal 57
dynamics of the sub-populations (Bode et al. 2008; Gilarranz & Bascompte 2012; Shtilerman 58
& Stone 2015). The studies considering the internal dynamics of populations more precisely 59
and its interaction with network features usually concern large, already established populations, 60
and their susceptibility to disturbances, biotic (Mari et al. 2014) or abiotic (Gilarranz et al. 61
2017). Conversely, the present study focuses on small populations during their growth phase, 62
and on specific associated mechanisms that can interact with the network structure of the 63
landscape. 64
Invaders usually experience multiple demographic bottlenecks, firstly at the initial 65
introduction and subsequently at each colonization event, which can strongly impact the success 66
of an invasion. Mechanisms associated with small population sizes are known to decrease 67
establishment rates if the number of individuals introduced is too low (Simberloff 2009) and to 68
block the spread of invaders to unoccupied patches (Keitt et al. 2001; Johnson et al. 2006). 69
Because of their easily tractable effect on population dynamics, Allee effects are classically 70
considered to account for small population dynamics (Courchamp et al. 2008). However, other 71
mechanisms affect small introduced populations. For instance, they have high risks of going 72
extinct at random, a phenomenon known as demographic stochasticity (Lande et al. 2003). 73
Their probability of not producing any individual able to successfully colonize other patches is 74
also greater, a phenomenon referred to as dispersal stochasticity (Morel-Journel et al. 2016a). 75
These demographic mechanisms have been shown to interact with dispersal and impact 76
establishment. Strong emigration notably tends to decrease the establishment rate of introduced 77
populations by decreasing individual density in the introduction site (Kean & Barlow 2000; 78
Robinet et al. 2008; Morel-Journel et al. 2016b). This study adresses the interplay between the 79
local dynamics of introduced populations and the network structure, during the first stages of 80
an invasion. 81
Network structure will be characterized using two metrics related to the distribution of 82
edges, i.e. the way patches are connected to one another: clustering and centralization. 83
Clustering indicates the presence of clusters, i.e. groups of vertices well connected to one 84
another (Watts & Strogatz 1998; Jordán et al. 2003). Clusters have notably been shown to 85
hinder the spread of pathogens (Badham & Stocker 2010), reduce the extinction risks of already 86
colonized patches (Kininmonth et al. 2010), and buffer the propagation of disturbances across 87
metapopulations (Gilarranz et al. 2017). In the context of invasion biology, they are expected 88
to slow down the spread by “trapping” invaders. Invasions in highly clustered landscape are 89
therefore expected to create fewer, larger populations, which could therefore also be less 90
vulnerable to extinction because of small population mechanisms. Centralization indicates the 91
presence of hubs, i.e. patches concentrating many dispersal flows across the landscape. Hubs 92
are usually central elements in metapopulations, increasing connectivity and the persistence of 93
remote populations otherwise isolated in fragmented landscapes (Watson et al. 2011). They 94
have been shown to increase the speed of infection spread (Ueno & Masuda 2008; Romano et 95
al. 2016) and to be more likely to generate epidemic outbreaks (Da Silva et al. 2012). In
96
invasion biology, hubs are expected to facilitate the rapid spread of invaders across the 97
landscape. Therefore, they may also increase extinction risks of small introduced populations 98
by decreasing the population density locally, especially if the hub is the introduction site itself. 99
We developed an individual-based model to simulate the first generations following 100
introduction, in landscapes whose structure was based on networks with known centralization 101
and clustering levels. In addition, we performed introductions of the parasitoid Trichogramma 102
chilonis, in artificial landscapes, and followed the invasion dynamics during ten generations.
103
We chose the spatial structures of these artificial landscapes among networks used in the 104
simulations to specifically test the impacts of centralization. We performed simulations in the 105
presence of Allee effects or with demographic stochasticity alone, to investigate the interaction 106
between landscape structure and small population mechanisms. T. chilonis does not suffer from 107
Allee effects (Morel-Journel et al. 2016a) but exhibits a strong stochasticity in reproduction and 108
in dispersal. Therefore, it provided a “null biological model” of an introduced population for 109
the experiment. The combination of simulations and experiment is a powerful tool to test 110
hypotheses, and this approach has been at the root of landmark results that have become classics 111
in ecology, e.g. the competitive exclusion principle (Gause 1934), chaotic population dynamics 112
(Cushing et al. 2002), stochasticity in spread rates (Melbourne & Hastings 2009) or population 113
extinction risks (Drake et al. 2011). Nevertheless, invasion biology – as well as epidemiology 114
and conservation biology, two other fields using spatial network – is heavily dominated by 115
theoretical development and lack experimental validations of classical theoretical predictions, 116
which are essential for the emergence of new hypotheses and the building of a comprehensive 117
ecological theory. 118
Our results provide the first experimental pieces of evidence of the impacts of landscape 119
structure on the spread of invasive species. The consistency between these results and others in 120
different fields demonstrates that the impacts of centralization and clustering on spreading 121
speed are robust to the ecological context. In addition, our simulations highlight the impact of 122
Allee effects, not only on the persistence of invasive populations, but also on the colonization 123
speed itself. Another interesting result is that high-density mechanisms, such as over-124
competition, can operate even at an early stage and underpin invasion failures depending on the 125
network structure of the landscape. Besides highlighting the importance of landscape structure 126
to predict the outcome of invasions, our study demonstrates its interplay with internal 127
population dynamics. 128
Methods
1
The network structure of the landscapes
2
Using the igraph package (Csardi & Nepusz 2006) of the R software (R CoreTeam 2018), we 3
generated 112618 networks with a number of vertices Nv = 10 and a number of edges Ne = 15
4
(see Supporting information 1 about the generation and selection of these networks). This set 5
of networks represented all the possible different structure of connected, undirected and 6
unlabeled networks. We computed two metrics to characterize each network: their clustering 7
coefficient T indicating the presence of clusters, and their centralization level C indicating the 8
presence of hubs (see Supporting information 1 about the co mputation of these indices). The 9
value of C is based on two measures of centrality, which encompasses several, conceptually 10
distinct measures, such as the degree, the eigenvector centrality, the betweenness and the 11
closeness. Although all these measures were highly correlated in the set of networks considered 12
(see Supporting information 1), we chose to consider here the closeness and the betweenness. 13
Both were chosen because they carry information about the structure of the paths linking 14
vertices, the closeness accounting for the length of these paths, and the betweenness for their 15
tendency to lie on these paths (Freeman 1978). Because of the correlation between these 16
metrics, we based our measure of centralization on the product between betweenness and 17
closeness, rather than considering them separately. We also identified the most central vertex 18
of a network (called the hub thereafter) based on the product between its betweenness and its 19
closeness. If several vertices shared the highest centrality value, the hub was selected at random 20 among them. 21 22 Simulations 23
We developed an individual-based model to simulate invasions in landscape whose spatial 24
structure was described in the previous section (see Supporting information 2 about the 25
description of the model). This model was in discrete time, with two successive phases dispersal 26
between patches and local population growth. In this model, individuals had no intrinsic 27
dispersal propensity, and dispersal probability only depends on di (the degree of the vertex the
28
individual is in) and pe (the dispersal rate of individuals in a vertex with di = 1). Local
29
population growth was itself divided in two phases. The first concerns mating, affected by m, a 30
density-independent mating probability, and a, a parameter describing potential mating Allee 31
effects. The second is a reproduction phase, affected by α, the intra-specific competition, β the 32
fecundity rate of individuals and s, the survival rate of juveniles. 33
Using this model, we simulated 20 time steps after a single initial introduction of 15 34
individuals in one patch of the landscape, for pe = 0.03, m = 0.8, α = 0.008, β = 15 and s = 0.1
35
(see Supporting information 4 for sensitivity analyses of these parameters). The initial 36
population size was chosen so that extinction because of low numbers was possible but not 37
systematic. We simulated 2x2 invasions for each network in our set, with either a = 0 (without 38
Allee effects) or a = 2.5 (with Allee effects), and with an introduction site which was either the 39
hub (the patch corresponding to the most central vertex) or another patch selected at random. 40
41
Experiment
42
To complement the simulations, we monitored artificial invasions of the egg parasitoid 43
Trichogramma chilonis (Hymenoptera: Trichogrammatidae) in laboratory microcosm
44
landscapes, for ten non-overlapping generations following an initial introduction of 15 45
individuals (see Supporting information 3 for details about the experimental setup). This model 46
species is especially suited for our experiment, because of its small size (approx. 1mm), its short 47
and regular developmental cycle (consistently 9 days to reach the adult stage), and its ability to 48
parasitize its laboratory host Ephestia kuehniella (Lepidoptera: Pyralidae). The latter allowed 49
us to focus on T.chilonis by suppressing the host’s dynamic, and estimate population sizes 50
throughout the experiment by counting the parasitized at each generation (see Supporting 51
information 3). Moreover, we could control for impacts of the genetic makeup of the introduced 52
populations by introducing individuals from the same inbred line, founded by a single female 53
and maintained in the laboratory for over 100 generations. 54
All the microcosm landscapes were made up of 10 patches connected by 15 corridors, 55
and their spatial structure were selected at random in two subsets of the set of networks 56
previously established (see Supporting information 1): the “high-C” and “low-C” landscapes, 57
whose centralization values were respectively in the 10% highest and 10% lowest of all the 58
centralization values in the network set. We performed 63 artificial introductions equally 59
distributed across three treatments: (i) in a patch selected at random in a low-C landscape, (ii) 60
in a hub in a high-C landscape, (iii) in another patch than the hub in a high-C landscape. The 61
63 artificial landscapes were distributed equally across 7 experimental blocks, i.e. 3 replicates 62
of each treatment in each block. 63
64
Analysis of the results
65
We considered three response variables: the global extinction rate, the introduction site’s 66
extinction rate and the colonization speed. The global extinction rate was computed as the 67
proportion of invasions during which all the patches went extinct. The introduction site’s 68
extinction rate was computed as the proportion of invasions during which the introduction site 69
went extinct at least once. Both extinction rates followed binomial distributions and were 70
analyzed with logistic regressions. The colonization speed was computed as the ratio between 71
the maximal number of patches colonized and the number of generations to reach this maximal 72
extent. Considering the maximum extent allowed us to differentiate failed establishments from 73
the start from “boom-and-bust” invasions. The colonization speed had a continuous and positive 74
distribution clustered towards low values and was therefore analyzed with a gamma regression. 75
we considered a fourth response variable for the experiment: the size reached by a local 76
population at the generation preceding its extinction. These values were distributed as an 77
overdispersed Poisson distribution, that were analyzed using a negative binomial regression. 78
We used AIC comparisons to assess the respective importance of C and T as explanatory 79
variables in the simulations. We considered a model including both variables (CT model), one 80
with only C (C model) and one with only T (T model). We computed ΔC as the difference
81
between the AIC of the CT model and the T model, and ΔT as the difference between the AIC
82
of the CT model and the C model. We considered that values of ΔT or ΔC greater than 10
83
indicated that the support for the CT model was unequivocally higher than for the other model 84
(Burnham & Anderson 2003). To analyze the experimental results, we used generalized linear 85
mixed models, to account for potential differences created by the experimental blocks. The 86
experimental block was treated as a crossed random effect, as the treatments were distributed 87
equally across all blocks. 88
Results
1
Simulations
2
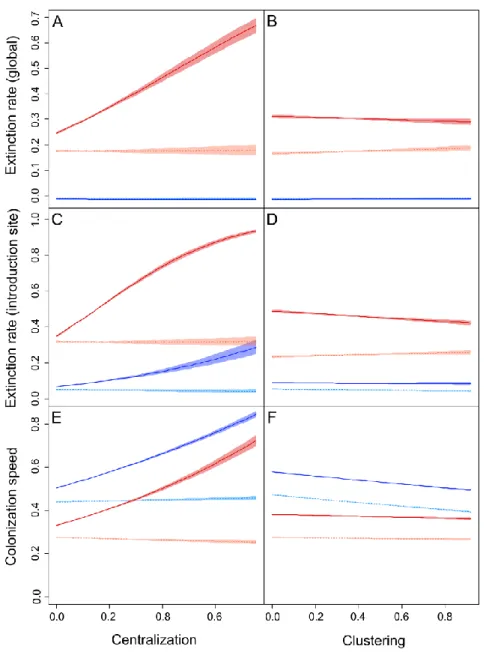
The global extinction rate was always negligible in the simulations when a = 0 (no Allee effect), 3
regardless of the introduction site or the landscape characteristics (Figure 1A, B). It was on 4
average higher when a = 2.5 but was independent from clustering whether the introduction was 5
performed in the hub (ΔT = - 1.02) or elsewhere in the landscape (ΔT = - 1.87). The
6
centralization level had an impact, but only when a = 2.5 and for an introduction in the hub 7
(ΔC = 602.37). In this case, the global extinction rate increased with C (Figure 1A).
8
The introduction site’s extinction rate was also overall higher when a = 2.5 than when 9
a = 0 but was impacted by centralization regardless of Allee effects when individuals were
10
introduced in the hub (Table 1). In this case, centralization increased the extinction rate, with a 11
large majority of introduction sites going extinct at high C levels (Figure 1C). The impact of 12
clustering appeared only for introductions in the hub and a = 2.5 (ΔT = 9.70). In this case, it
13
decreased slightly the extinction rate of the introduction site (Figure 1D). 14
Centralization had a substantial positive impact on colonization speeds when individuals 15
were introduced in the hub itself (Figure 1E), whether a = 0 (ΔC = 1578.84) or a = 2.5
16
(ΔC = 3250.45). Its positive impact was weaker for introductions outside of the hub, although it
17
was still significant when a = 0 (ΔC = 130.50, Figure 1E). Clustering markedly decreased the
18
colonization speeds when a = 0, when introductions were performed in the hub (ΔT = 865.15)
19
or elsewhere (ΔT = 648.80). Its impact was however limited when a = 2.5 for introductions in
20
the hub (ΔT = 29.20) and negligible for introductions outside of the hub (ΔT = -0.58). Overall,
21
the colonization speeds were higher when a = 0 compared to a = 2.5. 22
The sensitivity analyses performed on the parameters of the model (see Supporting 23
information 4) showed that, although the parameters could have an impact on the values of the 24
response variables (the global extinction rate, the introduction site’s extinction rate or the 25
colonization speed), they did not affect qualitatively the relationships between centralization or 26
clustering, and these response variables. 27
28
Experiment
29
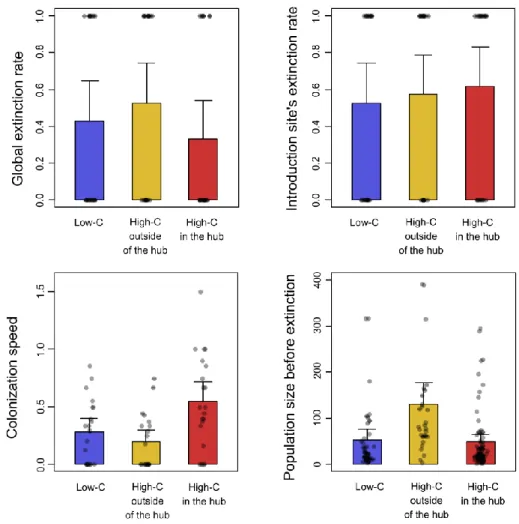
We were not able to evidence differences between the three experimental treatments concerning 30
the extinction rates (Figure 2), neither at the level of the whole landscape (Likelihood Ratio 31
Test, df = 2; p = 0.344) nor at the level of the introduction site (Likelihood Ratio Test, df = 2; 32
p = 0.747). However, the sizes of the local populations going extinct during the invasions of 33
high-C landscapes after an introduction outside of the hub were significantly higher than those 34
in low-C landscapes (Wald test; z = 2.325, p = 0.021) and those in high-C landscapes with 35
introductions in the hub (Wald test; z = 2.951, p = 0.004). 36
The colonization speeds recorded during the experiment were overall low (way less than 37
one patch per generation on average) but they were significantly higher in the high-C landscapes 38
compared to the low-C landscapes (Wald test; z = 2.980, p = 0.0014), but only when the hub 39
was the introduction site. Otherwise, there were no discernable differences in the colonization 40
speeds between high-C and low-C landscapes (Wald test z = 0.594; p = 0.552). 41
Discussion
1
Impacts of landscape structure on spread
2
Both the simulations and the experiments evidenced an impact of landscape structure on spread. 3
The colonization of new patches by invaders was slowed down by the presence of clusters and 4
accelerated by the presence of hubs. The effect of centralization was dominant when individuals 5
were initially introduced in the hub itself, although it was still significant when the introduction 6
site was chosen at random in the simulations. Our results are consistent with other studies in 7
other fields, and thus confirm the effect of the network structure itself on spread, regardless of 8
context. 9
Centrality was repeatedly shown to facilitate the transmission of infections (e.g. 10
Christley et al. 2005; Ueno & Masuda 2008; Da Silva et al. 2012; Romano et al. 2016). 11
Epidemics starting in hubs were shown to reach greater sizes, thus underlining the influence of 12
the hub at the start of spread (Da Silva et al. 2012), which we confirm in the context of invasions 13
simulations and experiments. Other studies showed that the most central agents also have higher 14
chances of being infected (Christley et al. 2005; Romano et al. 2016). In studies in 15
epidemiology considering networks of populations, the most central vertices are susceptible to 16
re-infections, even after the initial epidemic outbreak. This phenomenon, likely behind some of 17
the greatest epidemics (e.g. Gómez & Verdú 2017), also underpins major challenges for the 18
control of invasive populations: the most central patches do not only increase the speed of 19
invasive spread but are also more likely to be invaded. 20
Our simulation results concerning clustering are also consistent with epidemiological 21
studies showing its role in limiting the speed and extent of infections (Keeling 2005; Miller 22
2009; Badham & Stocker 2010). Moreover, Gilarranz et al. (2017) provide experimental 23
evidence that modularity also prevents spread in a similar context: the propagation of 24
disturbances. Modularity, which is particularly used in trophic (Dormann & Strauss 2014; 25
Beckett 2016) and genetic networks (Fletcher Jr et al. 2013; Peterman et al. 2016), describes 26
the belonging of vertices to modules, i.e. subparts of the network highly connected (Newman 27
& Girvan 2004). In a metapopulation context, Gilarranz et al. (2017) show that disturbances 28
occurring in one module mostly affect other populations in this module, similarly to the way 29
clusters “trap” introduced individuals in our simulation results. 30
Although they did not dramatically change the impacts of centralization or clustering, 31
Allee effects reduced the colonization speed in the simulations. This result is consistent with 32
the theoretical predictions of Keitt et al. (2001), which suggest that Allee effects can act as a 33
supplementary hurdle to colonization, preventing the small populations at the margin of the 34
invaded area to produce enough dispersing individuals to successfully colonizing new patches. 35
This impact of population dynamics on colonization speed echoes theoretical results on the 36
variation of speed rates with density-dependent growth (Sullivan et al. 2017) and on pushed 37
invasion (Lewis & Kareiva 1993; Roques et al. 2012). The low colonization speeds observed 38
during our microcosm invasions indicated that colonization failures also occurred during the 39
experiment, creating a “pushed-like” invasion pattern likely caused by dispersal stochasticity, 40
as evidenced in Morel-Journel et al. (2016a) in the same experimental system. 41
42
Impacts of landscape structure on establishment
43
In addition to affecting the spread of invaders, the network structure of the introduction area 44
also impacted the dynamics of the introduced populations. While the results concerning spread 45
suggest that the same mechanisms were at play in the experiment and the simulations, 46
extinction appears to be underpinned by different causes. In the simulations, the centralization 47
of the landscape increased the introduction site’s extinction rate when individuals were 48
introduced in the hub. This result highlights a tradeoff between colonization and local 49
persistence at the beginning of invasions, which is consistent with previous works in invasion 50
biology. Theoretical (Lewis & Kareiva 1993; Kanarek et al. 2013) and empirical (Robinet et 51
al. 2008; Vercken et al. 2011) studies underline the negative impact of dispersal soon after the
52
introduction on the persistence of introduced populations. However, the mechanism invoked 53
by these studies to explain these extinctions is the Allee effect, while our simulation results 54
show that the extinction of the introduction site can occur because of demographic stochasticity 55
alone. 56
We also observed local extinctions during the experiment, although they occurred 57
regardless of the treatment considered. If some extinctions occurring at small population sizes 58
can be attributed to demographic stochasticity, other populations went extinct while they were 59
close to the carrying capacity, which would rather suggest that they suffered from over-60
competition. This would be consistent with the biology of T. chilonis, which can be subject to 61
strong over-competition through superparasitism (Suzuki et al. 1984). This phenomenon 62
occurred most often for introductions outside of the hub in high-C landscapes, i.e. in poorly 63
connected patches. Because of their low dispersal rate, individuals mostly remained in the 64
isolated introduction site, where they rapidly suffered from superparasitism and eventually went 65
extinct. 66
Complete establishment failures did not only require the extinction of the introduction 67
site, but also that individuals fail to colonize other patches in the landscape. While we recorded 68
extinctions of the introduction site regardless of Allee effects in the simulations, most of them 69
did no lead to global extinctions for a = 0. Interestingly, the most important impact of Allee 70
effects on establishment was to prevent the colonization of new patches in the landscape. 71
During the experiment, colonization failures resulted from an extinction of the introduction site, 72
either because of demographic stochasticity or over-competition, combined with colonization 73
failures because of low dispersal rate and dispersal stochasticity. 74
75
Impact of the size of the landscape
76
The number of vertices of the landscapes used in this study (Nv = 10) was not only smaller than
77
the values used for epidemiology studies, but also smaller than the sizes used for network 78
describing entire landscapes. As we aimed at describing invasions dynamics just after the 79
introduction, we created landscapes corresponding to the direct surroundings of the introduction 80
site only. To test the validity of the results presented in larger landscapes, we performed 81
additional simulations, with networks with a larger number of edges (Ne varying between 20
82
and 40) and with a larger number of vertices (Nv varying between 20 and 100) (see Supporting
83
information 5). The results indicate that the effects of clustering were robust to variations in the 84
number of vertices, while the effects of centralization became weaker, although they remained 85
qualitatively the same. The effects of these metrics were also robust to variations in the number 86
of edges, up to a point. For high values of Ne, such network-level metrics become irrelevant, as
87
almost every patch can be considered a hub and belonging to a cluster. 88
89
Impact of dispersal behavior of the individuals
90
In our model, the dispersal of individuals was treated as a diffusion process. Hence, individuals 91
had no intrinsic dispersal propensity, and dispersed only depending on the way the introduction 92
site was connected to the rest of the landscape. Previous results by Morel-Journel et al. (2016b) 93
demonstrated that this approximation is valid to describe the dispersal of T. chilonis across our 94
experimental system. Yet, we completed our results by considering emigration rates dependent 95
on the choice of individuals, rather than the structure of the landscape (see Supporting 96
information 6). Dispersal choice based on environmental quality would not have been relevant 97
to our study, as the sameness of habitat quality across all patches of the landscape is a central 98
aspect of the study. We rather focused on the impact of the presence of conspecifics, i.e. density-99
dependent dispersal. The results we obtained were qualitatively similar to those previously 100
obtained on spread and on the extinction rate of the introduction site, with little impact of the 101
strength of the density-dependence of dispersal. These additional simulations therefore suggest 102
that the patterns observed in our simulations are robust to variations in the dispersal propensity 103
of individuals. However, we did not test the potential role of the patch quality on this propensity, 104
as all the patches in all our landscapes were considered having the same quality. 105
Besides these external factors, the dispersal behavior of individuals can also depend on 106
intrinsic differences between individuals. During spread, dispersal is not only impacted by the 107
genetic background of the introduced individuals, but also affects the spatial distribution of 108
genotypes across space. This feedback loop was not considered in our model because all the 109
individuals were considered identical, but such evolution during range expansion has been 110
documented experimentally (Fronhofer & Altermatt 2015; Ochocki & Miller 2017; Weiss-111
Lehman et al. 2017). Yet, we expected the impact of the genetic background of individuals or 112
potential variations between populations to be minimal during our experiment, because of the 113
very low genetic variability in the populations initially introduced (15 individuals from the same 114 inbred line). 115 116 Conclusion 117
Predicting the fate of introduced species remains a central objective of invasion biology. This 118
study is a first demonstration of the use of network theory in this context to characterize the 119
structure of landscapes and predict their invasibility. We built upon previous results in 120
epidemiology or conservation to investigate the robustness of the influence of network structure 121
on spread patterns. In addition, our study highlights interactions between the two network 122
metrics studied – centralization and clustering – and small population dynamics characteristic 123
of early stages of invasion. Among the involved small population mechanisms, Allee effects 124
often provide a simple and elegant way to describe the positive density dependence occurring 125
in small introduced populations, but they lack generality and empirical support (Kramer et al. 126
2009; Gregory et al. 2010). Our results demonstrate that demographic and dispersal 127
stochasticities can create similar patterns, by bringing small, well connected populations to 128
extinction, or by preventing colonization. Moreover, negative density-dependence and 129
competitive interactions can also interact with landscape structure and affect the outcome of 130
potential invasions. 131
Acknowledgements
1
We gratefully acknowledge the support of the Department Santé des Plantes et Environnement 2
from the INRA. This research was supported in part by the European Commission through the 3
7th Framework Program (PURE project, contract number 265865). This work is a part of the 4
thesis of TMJ, financed by the University Nice Sophia Antipolis. The funders had no role in 5
study design, data collection and analysis, decision to publish, or preparation of the manuscript. 6
References
1
Alther, R. & Altermatt, F. (2018). Fluvial network topology shapes communities of native and 2
non‐native amphipods. Ecosphere, 9. 3
Arino, J. & Van den Driessche, P. (2006). Disease spread in metapopulations. Nonlinear 4
dynamics and evolution equations, 48, 1–13.
5
Badham, J. & Stocker, R. (2010). The impact of network clustering and assortativity on 6
epidemic behaviour. Theoretical population biology, 77, 71–75. 7
Baguette, M. & Van Dyck, H. (2007). Landscape connectivity and animal behavior: functional 8
grain as a key determinant for dispersal. Landscape ecology, 22, 1117–1129. 9
Baranyi, G., Saura, S., Podani, J. & Jordán, F. (2011). Contribution of habitat patches to 10
network connectivity: redundancy and uniqueness of topological indices. Ecological 11
Indicators, 11, 1301–1310.
12
Beckett, S.J. (2016). Improved community detection in weighted bipartite networks. Royal 13
Society open science, 3, 140536.
14
Bode, M., Burrage, K. & Possingham, H.P. (2008). Using complex network metrics to predict 15
the persistence of metapopulations with asymmetric connectivity patterns. ecological 16
modelling, 214, 201–209.
17
Bodin, Ö. & Saura, S. (2010). Ranking individual habitat patches as connectivity providers: 18
integrating network analysis and patch removal experiments. Ecological Modelling, 19
221, 2393–2405. 20
Burnham, K.P. & Anderson, D.R. (2003). Model selection and multimodel inference: a 21
practical information-theoretic approach. Springer Science & Business Media.
22
Christley, R., Pinchbeck, G., Bowers, R., Clancy, D., French, N., Bennett, R., et al. (2005). 23
Infection in Social Networks: Using Network Analysis to Identify High-Risk 24
Individuals. Am J Epidemiol, 162, 1024–1031. 25
Courchamp, F., Berec, L. & Gascoigne, J. (2008). Allee effects in ecology and conservation. 26
Oxford University Press. 27
Csardi, G. & Nepusz, T. (2006). The igraph software package for complex network research. 28
InterJournal, Complex Systems, 1695, 1–9.
29
Cushing, J.M., Costantino, R.F., Dennis, B., Desharnais, R. & Henson, S.M. (2002). Chaos in 30
ecology: experimental nonlinear dynamics. Elsevier.
31
Da Silva, R.A.P., Viana, M.P. & da Fontoura Costa, L. (2012). Predicting epidemic outbreak 32
from individual features of the spreaders. Journal of Statistical Mechanics: Theory and 33
Experiment, 2012, P07005.
34
Dormann, C.F. & Strauss, R. (2014). A method for detecting modules in quantitative bipartite 35
networks. Methods in Ecology and Evolution, 5, 90–98. 36
Drake, J.M., Shapiro, J. & Griffen, B.D. (2011). Experimental demonstration of a two-phase 37
population extinction hazard. Journal of the Royal Society Interface, 8, 1472–1479. 38
Drechsler, M. (2009). Predicting metapopulation lifetime from macroscopic network 39
properties. Mathematical biosciences, 218, 59–71. 40
Ferrari, J.R. & Lookingbill, T.R. (2009). Initial conditions and their effect on invasion velocity 41
across heterogeneous landscapes. Biological Invasions, 11, 1247–1258. 42
Fletcher Jr, R.J., Revell, A., Reichert, B.E., Kitchens, W.M., Dixon, J.D. & Austin, J.D. (2013). 43
Network modularity reveals critical scales for connectivity in ecology and evolution. 44
Nature communications, 4, 2572.
45
Floerl, O., Inglis, G., Dey, K. & Smith, A. (2009). The importance of transport hubs in stepping-46
stone invasions. Journal of Applied Ecology, 46, 37–45. 47
Freeman, L.C. (1978). Centrality in social networks conceptual clarification. Social networks, 48
1, 215–239. 49
Fronhofer, E.A. & Altermatt, F. (2015). Eco-evolutionary feedbacks during experimental range 50
expansions. Nature communications, 6, 6844. 51
Gause, G.F. (1934). The Struggle for Existence. Wiliams & Wilkins, Baltimore. 52
Gilarranz, L.J. & Bascompte, J. (2012). Spatial network structure and metapopulation 53
persistence. Journal of Theoretical Biology, 297, 11–16. 54
Gilarranz, L.J., Rayfield, B., Liñán-Cembrano, G., Bascompte, J. & Gonzalez, A. (2017). 55
Effects of network modularity on the spread of perturbation impact in experimental 56
metapopulations. Science, 357, 199–201. 57
Gómez, J.M. & Verdú, M. (2017). Network theory may explain the vulnerability of medieval 58
human settlements to the Black Death pandemic. Scientific reports, 7, 43467. 59
Gregory, S.D., Bradshaw, C.J., Brook, B.W. & Courchamp, F. (2010). Limited evidence for the 60
demographic Allee effect from numerous species across taxa. Ecology, 91, 2151–2161. 61
Johnson, D.M., Liebhold, A.M., Tobin, P.C. & Bjørnstad, O.N. (2006). Allee effects and pulsed 62
invasion by the gypsy moth. Nature, 444, 361. 63
Jordán, F., Báldi, A., Orci, K.-M., Racz, I. & Varga, Z. (2003). Characterizing the importance 64
of habitat patches and corridors in maintaining the landscape connectivity of a 65
Pholidoptera transsylvanica (Orthoptera) metapopulation. Landscape Ecology, 18, 83– 66
92. 67
Kanarek, A.R., Webb, C.T., Barfield, M. & Holt, R.D. (2013). Allee effects, aggregation, and 68
invasion success. Theoretical ecology, 6, 153–164. 69
Kean, J. & Barlow, N. (2000). Effects of dispersal on local population increase. Ecology letters, 70
3, 479–482. 71
Keeling, M. (2005). The implications of network structure for epidemic dynamics. Theoretical 72
population biology, 67, 1–8.
73
Keitt, T.H., Lewis, M.A. & Holt, R.D. (2001). Allee effects, invasion pinning, and species’ 74
borders. The American Naturalist, 157, 203–216. 75
Kermack, W.O. & McKendrick, A.G. (1927). A Contribution to the Mathematical Theory of 76
Epidemics. Proceedings of the Royal Society of London A: Mathematical, Physical and 77
Engineering Sciences, 115, 700–721.
78
Kininmonth, S., Drechsler, M., Johst, K. & Possingham, H. (2010). Metapopulation mean life 79
time within complex networks. Marine Ecology Progress Series, 417, 139–149. 80
Kramer, A.M., Dennis, B., Liebhold, A.M. & Drake, J.M. (2009). The evidence for Allee 81
effects. Population Ecology, 51, 341. 82
Lande, R., Engen, S. & Saether, B. (2003). Stochastic population models in ecology and 83
conservation. Oxford University Press, Oxford.
84
Lewis, M. & Kareiva, P. (1993). Allee dynamics and the spread of invading organisms. 85
Theoretical Population Biology, 43, 141–158.
86
Lurgi, M., Galiana, N., López, B.C., Joppa, L.N. & Montoya, J.M. (2014). Network complexity 87
and species traits mediate the effects of biological invasions on dynamic food webs. 88
Frontiers in Ecology and Evolution, 2, 36.
89
Melbourne, B.A. & Hastings, A. (2009). Highly variable spread rates in replicated biological 90
invasions: fundamental limits to predictability. Science, 325, 1536–1539. 91
Miller, J.C. (2009). Spread of infectious disease through clustered populations. Journal of the 92
Royal Society Interface, rsif-2008.
93
Morel-Journel, T., Girod, P., Mailleret, L., Auguste, A., Blin, A. & Vercken, E. (2016a). The 94
highs and lows of dispersal: how connectivity and initial population size jointly shape 95
establishment dynamics in discrete landscapes. Oikos, 125, 769–777. 96
Morel-Journel, T., Piponiot, C., Vercken, E. & Mailleret, L. (2016b). Evidence for an optimal 97
level of connectivity for establishment and colonization. Biol Lett, 12. 98
Newman, M.E. & Girvan, M. (2004). Finding and evaluating community structure in networks. 99
Physical review E, 69, 026113.
100
Ochocki, B.M. & Miller, T.E. (2017). Rapid evolution of dispersal ability makes biological 101
invasions faster and more variable. Nature communications, 8, 14315. 102
Peck, S.L. (2012). Networks of habitat patches in tsetse fly control: Implications of 103
metapopulation structure on assessing local extinction probabilities. Ecological 104
modelling, 246, 99–102.
105
Peterman, W.E., Ousterhout, B.H., Anderson, T.L., Drake, D.L., Semlitsch, R.D. & Eggert, 106
L.S. (2016). Assessing modularity in genetic networks to manage spatially structured 107
metapopulations. Ecosphere, 7, e01231. 108
R CoreTeam. (2018). R: A language and environment for statistical computing. R Foundation 109
for Statistical Computing, Vienna, Austria. 2018.
110
Robinet, C., Lance, D.R., Thorpe, K.W., Onufrieva, K.S., Tobin, P.C. & Liebhold, A.M. (2008). 111
Dispersion in time and space affect mating success and Allee effects in invading gypsy 112
moth populations. Journal of Animal Ecology, 77, 966–973. 113
Romano, V., Duboscq, J., Sarabian, C., Thomas, E., Sueur, C. & MacIntosh, A.J. (2016). 114
Modeling infection transmission in primate networks to predict centrality-based risk. 115
American journal of primatology, 78, 767–779.
116
Romanuk, T.N., Zhou, Y., Brose, U., Berlow, E.L., Williams, R.J. & Martinez, N.D. (2009). 117
Predicting invasion success in complex ecological networks. Philosophical 118
Transactions of the Royal Society B: Biological Sciences, 364, 1743–1754.
119
Roques, L., Garnier, J., Hamel, F. & Klein, E.K. (2012). Allee effect promotes diversity in 120
traveling waves of colonization. Proceedings of the National Academy of Sciences, 109, 121
8828–8833. 122
Schick, R.S. & Lindley, S.T. (2007). Directed connectivity among fish populations in a riverine 123
network. Journal of applied ecology, 44, 1116–1126. 124
Seymour, M. & Altermatt, F. (2014). Active colonization dynamics and diversity patterns are 125
influenced by dendritic network connectivity and species interactions. Ecology and 126
evolution, 4, 1243–1254.
127
Shtilerman, E. & Stone, L. (2015). The effects of connectivity on metapopulation persistence: 128
network symmetry and degree correlations. Proc. R. Soc. B, 282, 20150203. 129
Simberloff, D. (2009). The role of propagule pressure in biological invasions. Annual Review 130
of Ecology, Evolution, and Systematics, 40, 81–102.
131
Simberloff, D., Martin, J.-L., Genovesi, P., Maris, V., Wardle, D.A., Aronson, J., et al. (2013). 132
Impacts of biological invasions: what’s what and the way forward. Trends in ecology & 133
evolution, 28, 58–66.
134
Sullivan, L.L., Li, B., Miller, T.E., Neubert, M.G. & Shaw, A.K. (2017). Density dependence 135
in demography and dispersal generates fluctuating invasion speeds. Proceedings of the 136
National Academy of Sciences, 114, 5053–5058.
137
Suzuki, Y., Tsuji, H. & Sasakawa, M. (1984). Sex allocation and effects of superparasitism on 138
secondary sex ratios in the gregarious parasitoid, Trichogramma chilonis 139
(Hymenoptera: Trichogrammatidae). Animal Behaviour, 32, 478–484. 140
Tanaka, G., Urabe, C. & Aihara, K. (2014). Random and targeted interventions for epidemic 141
control in metapopulation models. Scientific reports, 4, 5522. 142
Ueno, T. & Masuda, N. (2008). Controlling nosocomial infection based on structure of hospital 143
social networks. Journal of Theoretical Biology, 254, 655–666. 144
Vercken, E., Kramer, A., Tobin, P. & Drake, J. (2011). Critical patch size generated by Allee 145
effect in gypsy moth, Lymantria dispar (L.). Ecology letters, 14, 179–186. 146
Watson, J.R., Siegel, D.A., Kendall, B.E., Mitarai, S., Rassweiller, A. & Gaines, S.D. (2011). 147
Identifying critical regions in small-world marine metapopulations. Proceedings of the 148
National Academy of Sciences, 108, E907–E913.
149
Watts, D.J. & Strogatz, S.H. (1998). Collective dynamics of “small-world”networks. nature, 150
393, 440. 151
Webb, J.A. & Padgham, M. (2013). How does network structure and complexity in river 152
systems affect population abundance and persistence? Limnologica-Ecology and 153
Management of Inland Waters, 43, 399–403.
154
Weiss-Lehman, C., Hufbauer, R.A. & Melbourne, B.A. (2017). Rapid trait evolution drives 155
increased speed and variance in experimental range expansions. Nature 156
communications, 8, 14303.
Figures
1
2
Figure 1: Estimated impacts of centralization (A, C, E) and modularity (B, D, F) on the global
3
extinction rate (A, B), introduction site’s extinction rate (D, E) and colonization speeds (E, F), 4
with their 95% confidence intervals), for a = 0 (blue) and a = 2.5 (red) and for an introduction 5
in the hub (full lines, dark) and outside the hub (dashed lines, light). 6
1
Figure 2: Mean experimental values for global extinction rates (A), the introduction site’s
2
extinction rates (B), colonization speeds (C) and populations size before their extinction (D), 3
for the experimental introductions in low-C landscapes (blue), high-C landscapes outside of the 4
hub (yellow), and high-C landscapes in the hub (red). The error bars represent 2 times the 5
standard deviation from the mean value and the dots represent the raw values 6
Tables
1
Table 1: Differences in AIC between the M-model (ΔC) or the C-model (ΔM) and the CM-model
2
for the simulation results. All the values greater than 10 (indicating unequivocal higher support 3
for the CM- model compared to the other one) are in bold. 4
5
Response variable Allee effect Intro. site ΔC ΔM
Global extinction rate a = 0 In the hub 2.02 -1.49
a = 0 Outside -1.99 0.79
a = 2.5 In the hub 602.37 -0.66
a = 2.5 Outside -1.82 -0.95
Introduction site extinction rate a = 0 In the hub 173.45 -0.11
a = 0 Outside -1.31 0.38
a = 2.5 In the hub 1806.50 9.70
a = 2.5 Outside -0.77 -1.95
Colonization speed a = 0 In the hub 3250.45 865.15
a = 0 Outside 130.50 648.80
a = 2.5 In the hub 1578.84 29.20
a = 2.5 Outside -1.97 -0.58