Deregulation of Letter Markets and its Impact on Process and Product Innovation
HELMUT DIETL *
Institute of Strategy and Business Economics, University of Zurich ANDREAS GRÜTTER
Institute of Strategy and Business Economics, University of Zurich MARTIN LUTZENBERGER
Institute of Strategy and Business Economics, University of Zurich
Abstract
Does the European model of end-to-end competition or the US model of worksharing provide stronger innovation incentives for incumbent postal operators? We answer this question based on a two stage model with price competition and product differentiation. We find that incentives for process innovation in the upstream activities are stronger under end-to-end competition. Incentives for process innovation in delivery are stronger under worksharing, assuming that the entrant’s demand under worksharing is higher than the decline in the incumbent’s demand. Regarding product innovation, incentives depend on the access price.
1 Introduction
While reporting to the Council and the European Parliament on the application of the postal directive on March 23, 2005, the commission stated that it intends to
(…) remove barriers to competition in the postal sector so as to boost innovation and efficiency which in turn should benefit consumers. 1
The OECD report from October 1, 1999 on Promoting Competition in Postal Services argues in a similar way:
Introducing competition in postal services (…) has the potential to lead to important improvements in efficiency, productivity and innovation within the postal sector with consequences for overall welfare and growth.2
* Contact author. Institute of Strategy and Business Economics, Services- and Operations Management, University of Zurich, Winterthurerstrasse 92, CH-8006 Zurich. E-mail: [email protected].
1
Report from the Commission to the Council and the European Parliament on the application of the Postal Directive (Directive 97/67/EC as amended by Directive 2002/39/EC). http://europa.eu.int/eur-lex/lex/LexUriServ/site/en/com/2005/com2005_0102en01.pdf
2
Report from the Committee on Competition Law and Policy, Directorate for Financial, Fiscal and Enterprise Affairs, Organisation for Economic Co-operation and Development.
If innovation is the major objective of letter market liberalization, alternative forms of deregulation have to be compared with regard to their effect on product and process innovation. Does the European model of end-to-end competition or the US model of work-sharing provide stronger innovation incentives for incumbent postal operators? The existing literature does not provide answers to this question. The sector specific literature provides various models of liberalized letter markets with important welfare comparisons (for example, Crew and Kleindorfer (1998), Cremer et al (2001), Panzar (2002), De Donder et al (2005), and Dietl et al (2005)). However, these models do not account for the effect of deregulation on innovation. On the other hand, there is a sizeable amount of general literature on deregulation and innovation. Earlier models such as developed by Arrow (1962) and Demsetz (1969) suggest that there is a negative effect of deregulation on innovation. More recent models such as described by Boone (2000) and Aghion (2002) however, show that the answer is not that simple, and that market and governance specific considerations must be taken into account.
We try to fill the existing gap by developing a model that allows us to analyze the main regulatory scenarios of letter markets concerning innovation incentives. In particular, we compare the scenario of a full liberalization of the value chain (end-to-end competition) with the scenario of a partial liberalization of the value chain (worksharing).
Throughout the analysis, we restrict our attention solely to the incumbent, which requires some explanation. Unlike the entrant, the incumbent is assumed to be in the market from the beginning, that is, it can plan ahead. The incumbent, thus anticipates a change in the regulatory environment and prepares for competition, that is, it invests in process and product innovation. This reflects the situation of most universal service providers in the postal market at the present time. Although letter markets have been partially liberalized (such as the markets for express mail and for letters above 50 grams within the European Union), the bulk of the letter mail volume still results from the reserved area. However, there is little doubt that letter markets will eventually be deregulated to a large extent.
In order to describe this process in the simplest way possible, we begin our analysis with a two-stage model. In the first stage, before deregulation, the incumbent decides on how much to invest into improving efficiency, and on how much to invest into the development of new products. In the second stage, after deregulation has taken place, firms compete in prices. Our model is based on the duopoly model with quantity competition and product differentiation by Rosenkranz (2003). However, unlike Rosenkranz, who analyzes a Cournot model, we develop a Bertrand model with differentiated products, which allows for a more natural application to letter markets.
In the next section, we introduce the basic structure of our model. In subsections 2.1 and 2.2, we solve our model for the regulatory scenarios of end-to-end competition and worksharing. In Section 3, we compare the incumbent’s incentives for process and product innovation under end-to-end competition with those under worksharing. We solve the related first-order conditions separately and study their properties. This allows us to get some intuition on what is going on in our model. However, the first order conditions mutually depend on each other. Therefore, we use calibration results in Section 4 to get an overall view on innovation incentives under different regulatory regimes, before concluding in Section 5.
2 The model
How do we model innovations? Philosophically speaking, innovations are unknown future developments that cannot be transformed into current knowledge. In short, innovations cannot be modeled. What can be modeled, however, are innovation incentives. Therefore, we model the effect of deregulation on the incumbent’s incentives to invest in product and process innovation.
There are two different approaches in the literature to model product innovation in differentiated industries. The first approach, as applied in Bonanno and Haworth (1998), builds on the assumption of heterogeneity in tastes across consumers. Product innovation is modeled as vertical improvements in a product itself. In this type of model only the higher quality product enjoys positive demand if prices are equal. The second approach developed by Bester and Petrakis (1993) builds on the assumption, that consumers prefer product variety. Thus, as mentioned in Rosenkranz (2003, p.185), “the innovation (…) is simply different and increases consumers’ valuation of the product because of preferences for distinct varieties.” This definition of product innovation allows for a better application to the letter market. Given the high quality services offered by most of the incumbents in the
European Union,3 it is more natural to consider not only qualitative improvements but also
new products that have a lower quality as product innovation. The assumption of preferences for product variety influences demand in the following way: If two differentiated products are offered at the same price, both products enjoy positive demand. In contrast to the earlier work of Bester and Petrakis (1993), which concentrates on process innovation, Rosenkranz (2003) used this approach and developed a model, which includes process as well as product innovation. However, unlike Rosenkranz, who analyzes a Cournot model, we develop a Bertrand model with differentiated products.
On the supply side, we model an incumbent i and an entrant e. The entrant represents
a set of entrants behaving like a competitive fringe. The incumbent and the entrant produce quantitiesx andi x , respectively. Production consists of the upstream activities collection, e
sorting and transportation denoted by u and the downstream activity delivery denoted by
d.
Our model consists of two stages. At stage 1, the incumbent invests in product and process innovation. At stage 2, after deregulation, the incumbent and entrant compete in prices.
Let us turn to stage 1. Process innovation decreases the incumbent’s marginal costs for either upstream or downstream activities. An example of a major process innovation is the introduction of optical character recognition technology, which allows postal operators to sort the majority of all mail automatically. A current example of a process innovation is the use of radio frequency identification technology instead of barcodes, allowing for the identification of individual letters without having to separate them first. Several incumbent postal operators have recently undertaken major reorganization programs with the prime goal of cost savings. Examples are USPS’ large scale upgrade project, DPWN’s STAR project, and Swiss Post’s REMA project. Returning to our model, the larger the difference
between the incumbent’s initial and final marginal costs, c and 0 c , respectively, the i
higher are the innovation costs, that is, there are decreasing returns to scale from investment into innovation. We define the cost reduction through innovation as
3
s i s s
i c c
z ≡ 0 − . Following D’Aspremont and Jacquemin (1988), we assume that there are
increasing marginal costs of innovation. The incumbent’s cost function for process innovation is , ) ( 2 1 ) ( =
∑
2 s s i s i z z K (1)where s∈{ du, }. It makes no sense for the incumbent to invest in order to increase its
marginal cost. Therefore, we restrict z to be non-negative that is i zi >0.
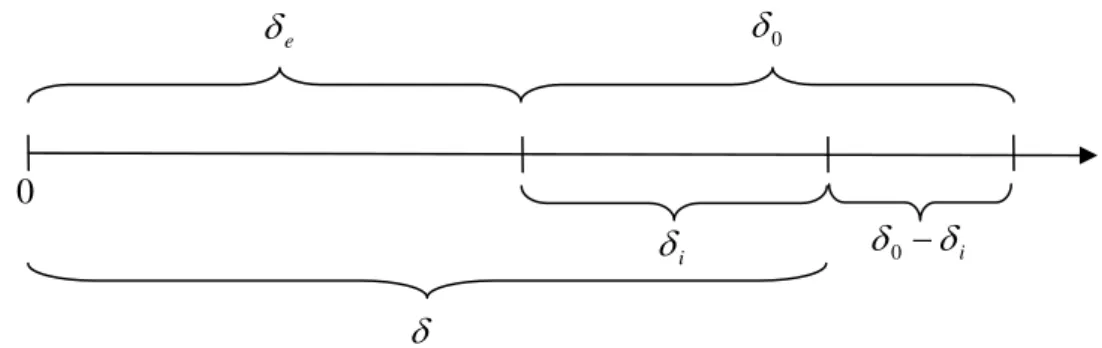
The incumbent can decrease its degree of product substitutabilityδi, that is, increase
the degree of product differentiation through product innovation. Figure 1 illustrates the
degree of product substitutability. δe∈[0,0.5) is the entrant’s degree of product
substitutability, which is exogenously given. δ0∈[0,0.5] is the incumbent’s initial degree
of product substitutability, andδi∈[0,δ0] is the incumbent’s degree of product
substitutability after product innovation. δ =δe+δi, the overall degree of product
substitutability, is simply the sum of the incumbent’s and the entrant’s degree of substitutability. If δ tends to zero, then both firms effectively become monopolists. If δ tends to one, then the goods of both firms are perfect substitutes.
Figure 1: Degree of product substitutability
Examples of product innovations in the postal sector are quality improvements such as track and trace. In addition, our model also covers investments into brand image as currently observed for example in liberalized power markets. The incumbent’s cost function for product innovation is
, ) ( 2 1 ) ( i i 2 G γ = γ (2) where γi ≡δ0 −δi.
On the demand side, we assume that a sender’s utility depends on the quantity of letters sent, and that consumers prefer product variety. The utility function of a representative sender is given by δ 0 0 δ i δ δ0 −δi e δ
, ) 1 ( 2 ) 2 ( ) ( ) , , ( 2 2 2 y x x x x x x a y x x U i e i e i e i e + − + + − + = δ δ (3)
where the parametera>max[ci,ce] influences market size, y is the amount of money
spent on other goods. In contrast to Rosenkranz (2003), we assume that∂2U/∂δ2 <0,
which indicates decreasing marginal utility of product differentiation.
From the utility function (3) we derive the following demand functions:
e i i a p p x = (1−δ) − +δ , (4) i e e a p p x =(1−δ) − +δ . (5)
The demand structure shows the main difference between the approach developed by Rosenkranz (2003), and classical models of horizontal and vertical product differentiation. Consumers demand a bit of every available good instead of consuming only their most preferred product. Therefore, each product introduced to the market enjoys positive demand.
We solve our model through backward induction. At stage 2, the entrant’s equilibrium
price is equal to its exogenous marginal costsc . In the following subsections, we derive e
the solutions for end-to-end competition and worksharing.
2.1 End-to-end competition
Given the incumbent’s profit function
) , , ( ) ( ) , ( δ πi pi pe = pi −ci xi pi pe , (6)
we obtain the incumbent’s profit maximizing price:
[
e i]
i a c c p∗ = (1−δ) +δ + 2 1 . (7)The incumbent’s corresponding demand is
[
( )]
2 1 e i i a c a c x∗ = − −δ − . (8)Using (6) and (7), and substituting (8), we can write the incumbent’s reduced form profit function for the first stage of the incumbent’s decision process:
2 ) ( ) , , , ( ∗ ∗ = i e i e i i c c δ δ x π . (9)
We use our definitions of is
s s
i c c
z ≡ 0 − and γi ≡δ0 −δito rewrite the right hand side of
equation (8), which allows us to rewrite the incumbent’s maximization problem in the first stage as a function of z and is γi:
)} ( ) ( ) , , , ( { max , i s i e i e s i i i zs i z c K z G i γ δ γ π γ Π = − − ∗ , (10)
where the incumbent’s strategy set for the first stage is given by (ziu,zid,γi)∈R3,
with [0, 0] u u i c z ∈ , [0, 0 ] d d i c z ∈ , andγi ∈[0,δ0].
Differentiating (10) with respect to the cost reduction through innovationzis, solving
forK′, and substituting the incumbent’s equilibrium demand leads to:
∗ ′ =
i
s x
K . (11)
Thus, the incumbent’s marginal revenue from investing in process innovation is proportional to the incumbent’s profit maximizing demand.
Differentiating (10) with respect to γi, solving forG´, and substituting the incumbent’s equilibrium demand leads to:
)
( e
i a c
x
G′= ∗ − . (12)
The incumbent’s marginal revenue of product innovation is influenced by the incumbent’s demand and, in addition, by a factor including the entrant’s marginal cost. For technical
reasons notice that a−ce < 2 is a necessary condition in order to observe a profit
maximum.
2.2 Worksharing
In case of worksharing, the entrant’s marginal cost depends on the access price. The access price is the price that the entrant must pay to the incumbent in order to deliver one piece of the entrant’s mail. The access price either can be the result of negotiations between the incumbent and the entrant, or is directly determined by the regulatory authority. For our analysis, we do not focus on the determination of the welfare maximizing access price. Instead, we are interested in the effect of the access price on the incumbent’s innovation incentives. Therefore, we treat the access price as an exogenous variable. The incumbent’s profit function for the second stage changes to
, ) , , ( ) ( ) , , ( ) ( ) , ( δ α δ π e i e d i e i i i i e i i p p = p −c x p p + −c x p p (13)
where parameterα is the access price.
Due to the assumption that there is a set of entrants behaving like a competitive fringe, the entrant’s equilibrium price equals the entrant’s marginal cost, which is equal to the sum of the entrant’s marginal upstream cost and the access price:
α + = ∗ u e e c p . (14)
Maximizing the incumbent’s profit function while taking into account the entrant’s equilibrium price, we obtain the incumbent’s profit maximizing price:
[
i]
d i u e i a c c c p∗ = (1− ) + ( +2 − )+ 2 1 δ δ α . (15)The incumbent’s corresponding demand is
[
( )]
2 1 u e d i i i a c a c c x∗ = − −δ − − . (16)Note that the incumbent’s equilibrium demand does not depend on the access price. This
result is caused by two offsetting effects. If the access price increases by Δα and therefore
the price of the entrant will increase by Δα, equation (4) implies an increase in the
incumbent’s demand by δΔα. However, as prices are strategic complements, the
incumbent will raise its price in accordance with equation (15) by δΔα. As a result, the
incumbent’s demand will decrease by δΔα , which offsets the effect of the increase in the
entrant’s price.
Given equations (14) and (15), the corresponding demand for the entrant is
[
( 2 )]
2 1δ δ α α − − − + + − − − − = ∗ u e d i u i d i u e e a c a c c a c c x . (17)Using the incumbent’s profit function and the profit maximizing prices, rearranging and substituting (17), we can write the incumbent’s reduced form profit function for the first stage: . ) )( )( 1 ( ) ( ) , , , , ( i e i e i 2 2 id eu i c c = x + − −c −a+c ∗ ∗ δ δ α δ α α π (18)
Again, we use the definitions zis ≡c0s −cis and γi ≡δ0 −δi to rewrite the reduced form profit function as a function of zisand γi:
. ) )( )( 1 ) (( ) ( ) , , , , , , ( is i0 e i 0 e i 2 0 e i 2 0d id eu i z c c = x + + − − −c +z −a+c ∗ ∗ γ δ δ α δ δ γ α α π (19)
Differentiating the reduced form profit function with respect to zu, solving forKu′, and substituting the incumbent’s equilibrium demand leads to:
∗ ′ =
i
u x
K , (20)
By differentiating the reduced form profit function with respect to the cost reduction in downstream activities, we find the following first order condition for downstream process innovation: ∗ ∗ ′ = + e i d x x K , (21)
The incumbent’s marginal revenue of downstream process innovation is proportional to the incumbent’s and the entrant’s demand, since the incumbent delivers the entrant’s mail.
Differentiating the reduced form profit function with respect to the incumbent’s degree of product substitutability and solving for G′ leads to:
) )( ( 2 ) ( ' xi* a cid cue cid a ceu G = − − + δ α − −α − . (22)
In the case that the access price equals the incumbent’s profit maximizing downstream cost, the incumbent’s marginal revenue of product innovation under worksharing equals the incumbent’s marginal revenue of product innovation under end-to-end competition:
) ( |c xi a cid ceu G d i − − = ′ ∗ =α . (23)
3 Comparing end-to-end competition and worksharing
For process innovation, as well as for product innovation, we first analyze the simpler case of end-to-end competition to get some intuition of what is going on in our model. Afterwards, we compare the corresponding marginal revenues of process and product innovation in order to analyze the effect of different regulatory regimes on innovation incentives.
3.1 Process innovation
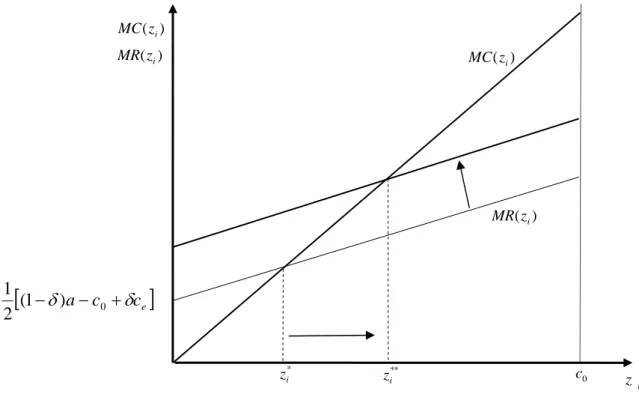
Figure 2 shows the incumbent’s marginal cost and revenue functions for process innovation under end-to-end competition. Furthermore, Figure 2 shows that an outward shift of the marginal revenue function leads to an increase of innovation incentives.
We have three reasons that lead to such an outward shift of the marginal revenue
function. First an increase in the market size a, second an increase of the entrant’s
marginal cost, and third a decrease in the degree of product substitutability. All of these factors results in a higher demand for the incumbent. As shown in equation (11) for the whole value chain, the marginal revenues of cost reduction depend directly on the demand of the incumbent. Such an increase in marginal revenues will lead to higher innovation incentives. On the other hand, if the degree of product substitutability increases or the marginal cost of the entrant decreases, the incumbent’s incentives for process innovation will decrease. From equations (16) and (20), it becomes clear that the effect described for end-to-end competition, is also observable for process innovation in the upstream activities.
In order to analyze the innovation incentives for the upstream activities between to-end competition and worksharing, we can compare the incumbent’s demand under end-to-end competition (8) and under worksharing (16). If the incumbent’s downstream cost under worksharing is the same as the cost of the entrant under end-to-end competition, the incumbent’s demand is the same in both cases. However, there is empirical evidence that delivery, that is the downstream activity, exhibits strong economies of scale (see Rogerson and Takis (1993) and Cazals et al (1997)). Moreover, due to consumer switching costs, the incumbent usually retains a larger share of the market than any entrant does even after markets are fully deregulated. It follows from these considerations that the incumbent’s
downstream cost under worksharing is lower than the entrant’s downstream cost under end-to-end competition, that isc (ws) ced(e2e)
d
i < .
Figure 2: MC(zi) and MR(zi) under end-to-end competition
As mentioned above, innovation incentives depend on the incumbent’s equilibrium demand. If we compare (8) and (16) and use the assumption that downstream activity exhibits strong economies of scale, it is easy to see that the incumbent’s demand is larger under end-to-end competition than under worksharing. Therefore, we conclude that the incumbent’s incentives for process innovation in the upstream activities are stronger under end-to-end competition than under worksharing.
The reason for the lower demand under worksharing is the price setting behaviour of the incumbent. We rewrite the profit-maximizing price of the incumbent under end-to-end competition as
[
e i]
i a p c p∗ = (1−δ) +δ + 2 1 (24)and the optimal price under worksharing as
[
i]
d i e i a p c c p∗ = (1− ) + ( + − )+ 2 1 δ δ α . (25)Let us assume that the price of the entrant remains unchanged and that we observe economics of scale in the downstream activities, that is α =ced(e2e)>cid(ws). Then, it becomes clear by equations (24) and (25) that the incumbent will charge a higher price under worksharing. This follows as the incumbent can generate additional profit through additional demand of the entrant.
0 c i z * i z ** i z ) (zi MR ) (zi MC
[
(1−δ)a−c0 +δce]
2 1 ) (zi MC ) (zi MRIn order to analyze the innovation incentives for the downstream activities between end-to-end competition and worksharing, we cannot only compare the incumbents demand under the different regulatory regimes. As shown by equation (21), marginal revenues for innovation in downstream activities are given by total demand. As mentioned above for innovation in upstream activities, the incumbent’s demand under worksharing is lower than under end-to-end competition. This reduces the incumbent’s incentives for downstream process innovation. However, the incumbent’s incentives for downstream process innovation are higher under worksharing, as long as the entrant’s demand under worksharing is higher than the decline in the incumbent’s demand.
If total demand under worksharing is higher or lower compared with the demand of the incumbent under end-to-end competition depends on the access price. However, it is obvious that total demand and the access price are negatively related. If the access price increases, we have a direct effect on the price of the entrant and, because prices are
strategic complements, an indirect effect on the price of the incumbent. If p and i∗ p e
increase, total demand will decrease. Therefore we have higher incentives for process innovation under worksharing if the access price is sufficiently low.
3.2 Product innovation
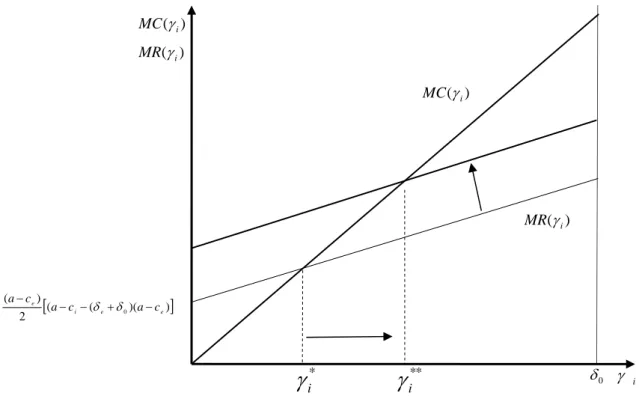
Figure 3 shows the incumbent’s marginal cost and revenue functions for product innovation under end-to-end competition. Furthermore, it shows what happens if the incumbent’s demand increases under end-to-end competition.
As mentioned above, we need a−ce < 2 to observe a profit maximum. We use this
fact to conclude that the slope of the incumbent’s marginal revenue function is smaller than the slope of the marginal cost function, that is0.5(a−ce)2 <1.
As shown in Figure (3), an outward shift of the incumbent’s marginal revenue function
results in a larger reduction of δi, that is, the incumbent’s incentives for product
innovation will increase. Notice that the exogenous variables c and e δeinfluence the
slope, as well as the intercept of the marginal revenue function. If we observe a shift in the marginal revenue function, the size of the change in innovation incentives depends on the
marginal cost of the entrant c . As the slope of the marginal revenue function is e
2
) ( 5 .
0 a−ce , we observe a flatter marginal revenue function if we observe a higher value of
e
c . Therefore, the effect of a shift in the marginal revenue function becomes smaller if the
entrant has high marginal cost.
As in the case of process innovation, we start with an analysis of different effects that cause a shift in the marginal revenue function under end-to-end competition.
Figure 3: MC(γi)and MR(γi) under end-to-end competition
First, we consider the effect of the entrants marginal cost on the innovation incentives of the incumbent. The sign of this effect depends on marginal cost, as well as on the degree of product substitutability. If
(
)
(
(
)
)
e i e c a c a − − > + 2 1 0 δ δ (26)higher marginal cost of the entrant leads to an outward shift of the marginal revenue function and vice versa.
For simplicity, we consider just two simple market entry strategies for the entrant to get some intuition for this result. Let us assume that the entrant chooses a low level of product differentiation (high value of δe) and has a low marginal cost ce, that is, inequality (26) is
satisfied. Then, an increase in the marginal cost of the entrant will cause higher incentives for product innovation. The intuition for this result is the same as in the case of process innovation. Due to the fact that an increase in the marginal cost of the entrant will increase the price of the entrant, the demand for the incumbent will also increase. Higher incentives for product innovation follow from this result, as demand is the main stimulus of innovation.
In contrast, if we assume that the entrant chooses a high level of product differentiation
(low value of δe) and high marginal cost c , a further increase in e c will reduce the e
innovation incentives of the incumbent. Intuitively, if the entrant’s costs are relatively high, a further increase in the entrant’s marginal cost will only lead to a small increase in the incumbent’s demand, because consumers prefer product variety. Therefore, if the
entrant has high marginal costs a further increase in c yields lower innovation incentives e
0 δ γ i ) ( i MR γ * * i
γ
) ( i MC γ ) ( i MC γ ) ( i MRγ * iγ
[( ( )( )] 2 ) ( 0 e e i e c a c a c a − + − − − δ δfor the incumbent. The incumbent chooses a lower degree of product substitutability to exploit the competitive advantage of the lower marginal cost.
Another parameter that can cause an outward shift of the marginal revenue graph is the
degree of product substitutability. An increase in the value of δe will also lead to higher
innovation incentives. The reason for this is that lower values of δ will increase the demand of the incumbent, because consumers prefer product variety. It can be seen by equation (8) that the demand of the incumbent is strictly decreasing in δ . Furthermore, marginal revenue of the incumbent is increasing in its own demand. For these two reasons, marginal revenue will increase if we observe an increase in the degree of product differentiation, or equivalent a decrease in δ .
However, as mentioned above, the size of this effect depends on the marginal cost of
the entrant c . As the slope of the marginal revenue function is e
2 ) ( 5 . 0 a−ce , we observe a
flatter marginal revenue function if we observe a higher value of c . This means that the e
reaction on an outward shift of the marginal revenue function becomes smaller. This result is quite intuitive. A higher marginal cost of the entrant and therefore a higher price of the entrant have a positive effect on the demand of the incumbent. But this effect becomes smaller if the degree of product differentiation increases. Therefore, it is optimal to increase the degree of product differentiation by a smaller amount if the entrant has high marginal cost than in the case of a low cost entrant.
Comparing the incumbent’s marginal revenue functions for product innovation under end-to-end competition (12) and under worksharing (equations (22) and (23)), we can see that incentives for product innovation are unaffected by entry regulation as long as
d WS i c, = α and edE E d WS i c c, = , 2 .
If we consider the more realistic case, using the assumption of economics of scale in delivery, that is c (e2e) cid(ws)
d
e > , we observe different effects. We can use our analysis
of process innovation to conclude that the demand of the incumbent is lower under worksharing than under end-to-end competition, which reduces the incentives for product innovation. However, if we assume that ced(e2e)>cid(ws), it is not clear if marginal revenues under end-end-competition (equation (12)) are higher or lower than the first term in equation (22). Furthermore, the second term in equation (22) is strictly positive as long as the access price is larger than the marginal downstream costs of the incumbent after innovation, that is, α >cid.
Therefore, we have two opposite effects on the incentives for product innovation. Whether the incentives for process innovation are higher or lower under worksharing depends on the size of these effects. However, the size of the effect on the demand of the incumbent and the second term in equation (22) depend not only on the degree of product substitutability but also on the cost differences after innovation. As the incentives for product and process innovation are not independent, we cannot use our analytical results to get a clear result regarding the incentives for product innovation. We try to solve these interdependencies by calibrating the model in the next section.
4 Calibration
By calibrating our model, we can obtain an estimate on the extent of innovation under end-to-end competition and worksharing. Our goal is to obtain a relative comparison between end-to-end competition and worksharing. Calibration is based on Swiss data: We make use of the average costs and market size information quoted in Dietl, Trinkner and Bleisch (2005). Fixed costs do not enter the calculation of obtaining the relative levels of innovation. However, as a result of ignoring fixed costs, the overall level of the incumbent’s profit has no meaning. Nevertheless, this is not a problem since we are only interested in the relative comparison between scenarios. Note also that we can compare profit and consumer surplus on a relative basis. However, we cannot add total profits and consumer surplus to obtain a meaningful value for the economy’s overall surplus.
Calibration has been undertaken for a very wide range of possible parameters. The results below only show one reference point for end-to-end competition and three for worksharing. Additional reference points do not yield additional qualitative results. The access price must be lower than the incumbent’s initial marginal downstream cost; otherwise the model’s output cannot be interpreted. Furthermore, we assume that the access price is higher then the downstream cost of the incumbent after innovation, that is,
d i
c
>
α . Results are summarized in Table 1 and Figure 4.
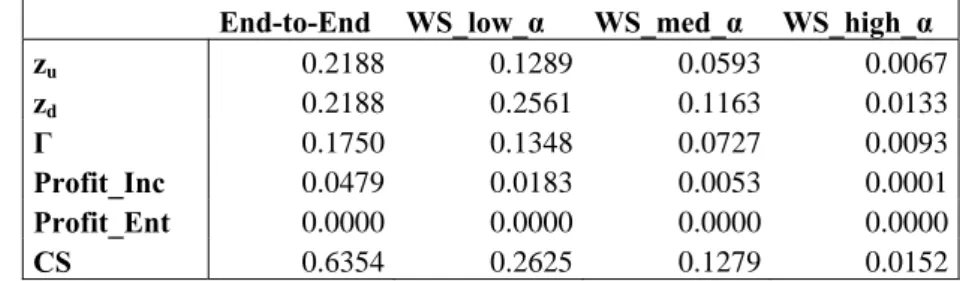
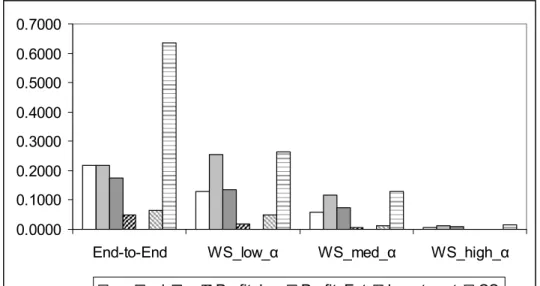
End-to-End WS_low_α WS_med_α WS_high_α
zu 0.2188 0.1289 0.0593 0.0067 zd 0.2188 0.2561 0.1163 0.0133 Γ 0.1750 0.1348 0.0727 0.0093 Profit_Inc 0.0479 0.0183 0.0053 0.0001 Profit_Ent 0.0000 0.0000 0.0000 0.0000 CS 0.6354 0.2625 0.1279 0.0152
Table 1: Calibration results
An increasing access price leads to lower investments into process innovation and lower investments into product innovation. Investments into upstream process innovation are higher under end-to-end competition regardless of the access price. For a sufficiently high access price, investments into downstream process innovation are higher under end-to-end competition as well. The calibration results are in line with our findings in Section 3.2.
We could not answer the question whether incentives for product innovation are higher under end-to-end competition or worksharing in the theoretical part. Given the results of the calibration, we get a clear picture on the incentives for product innovation. Incentives for product innovation are higher under end-to-end competition. This result is independent of the access price. However, we find a similar result as for process innovation. An increase in the access price will reduce the incentives for product innovation under worksharing.
The reason for the negative effect of the access price on innovation incentives is the assumption of marginal cost pricing for the entrant and the price setting behavior of the incumbent. As mentioned in Section 2.2, an increase in the access price will result in higher prices for both the entrant and the incumbent. Therefore, an increase in the access price will reduce the demand of the incumbent, as well as the demand of the entrant.
Because innovation incentives are proportional to demand, it becomes clear that a higher access price will reduce innovation incentives.
Consumer surplus (CS) decreases with a higher access price. Higher investments into innovation increases consumer surplus. Consumer surplus is higher under end-to-end competition regardless of the access price.
Since both the incumbent’s profit as well as consumer surplus is larger under end-to-end competition, the economy’s overall surplus is larger under end-to-end-to-end-to-end competition. By the same logic, the economy’s overall surplus is larger under a low access price than under a high access price.
0.0000 0.1000 0.2000 0.3000 0.4000 0.5000 0.6000 0.7000
End-to-End WS_low_α WS_med_α WS_high_α
zu zd γ Profit_Inc Profit_Ent Investment CS
Figure 4: Calibration results
5 Conclusion
Our results can be summarized as follows: The incumbent’s incentives for process innovation in the upstream activities are stronger under end-to-end competition than under worksharing. Incentives for process innovation in delivery are stronger under worksharing, assuming that the entrant’s demand under worksharing is higher than the decline in the incumbent’s demand. Regarding product innovation, incentives depend on the whole set of exogenous parameters. Furthermore, we observe interdependency between product and process innovation.
In addition, we analyze whether, under worksharing, an increase in the access price will increase or decrease innovation incentives. We find that for process innovation, the effect of the access price is negative. For product innovation, we observe two opposite effects of the access price. The size of these effects depends also on the market entry strategy of the entrant and the cost advantages of the incumbent in downstream activities.
What advice can be given to the regulatory authorities? In a nutshell, if the incumbent postal operator under consideration possesses an efficient delivery network, but still has a low level of automation in sorting, then a full liberalization sets the right incentives for innovation. On the other hand, if the incumbent features advanced sorting technology, but
there is still room for cost savings in delivery, then a partial liberalization of the value chain can set the right incentives.
If a partial liberalization is chosen, it should be taken into account that a lower access price is more conducive to innovation. However, if the access price is too low, the incumbent postal operator loses incentives to develop new products.
As we have shown, innovation incentives are negative related to the access price under worksharing. However, regarding the access price further research is necessary. One possible extension of this paper can include the question of an optimal access policy. Such an analysis could address the question of welfare and innovation maximizing determination of the access price.
6 References
Aghion, P., Bloom, N., Griffith, R., Howitt, P. and Blundell, R. (2002) “Competition and Innovation: An Inverted U Relationship,” NBER Working Paper No. W9269, Available at
SSRN: http://ssrn.com/abstract=339500
Arrow, K. (1962) “Economic Welfare and the Allocation of Resources for Invention,” in R. Nelson (ed.), The Rate and Direction of Inventive Activity, Princeton University Press, Princeton.
Bester, H. and E. Petrakis (1993) “The Incentives for Cost Reduction in a Differentiated Industry.” International Journal of Industrial Organization, 11: 519-534
Bonanno, G. and B. Haworth (1998) “Intensity of Competition and the Choice between Product and Process Innovation,” International Journal of Industrial Organization, 16: 495-510
Boone, J. (2000) “Competitive Pressure: The Effects on Investment in Product and Process Innovation,” RAND Journal of Economics, 31: 549-569.
Cazals, C., M. De Rycke, J.P. Florens and S. Rouzard (1997) “Scale Economies and Natural Monopoly in the Postal Delivery: Comparison between Parametric and non Parametric Specifications,” in M.A. Crew and P.R. Kleindorfer (ed.), Managing Change in
the Postal and Delivery Industries, Kluwer Academic Publishers, Boston.
Cremer, H., A. Grimaud, J.P. Florens, S. Marcy, B. Roy and J. Toledano (2001) “Entry and Competition in the Postal Market: Foundations for the Construction of Entry Scenarios,”
Journal of Regulatory Economics, 19: 107-121.
Crew, M.A. and P.R. Kleindorfer (1998) “Efficient Entry, Monopoly and the Universal Service Obligation in the Postal Sector,” Journal of Regulatory Economics, 14: 103-126. D’Aspremont, C. and A. Jacquemin (1988) “Cooperative and Noncooperative R&D in Duopoly with Spillovers,” American Economic Review, 78: 1133-1137.
De Donder, P., H. Cremer and F. Rodriguez (2005) “Access Pricing in the Postal Sector: Results from a Model with Bypass and Customer Direct Access,” in M.A. Crew and P.R. Kleindorfer (ed.), Regulatory and Economic Challenges in the Postal and Delivery Sector, Kluwer Academic Publishers, Boston.
Demsetz, H. (1969) “Information and Efficiency: Another Viewpoint,” Journal of Law and
Economics, 12: 1-22.
Dietl, H., U. Trinkner and R. Bleisch (2005) “Liberalization and Regulation of the Swiss Letter Market,” in M.A. Crew and P.R. Kleindorfer (ed.), Regulatory and Economic
Challenges in the Postal and Delivery Sector, Kluwer Academic Publishers, Boston.
Panzar, J. (2002) “Reconciling Competition, Downstream Access, and Universal Service in Postal Markets,” in M.A. Crew and P.R. Kleindorfer (ed.), Postal and Delivery
Services: Delivering on Competition, Kluwer Academic Publishers, Boston.
Rogerson, C.M. and W.M. Takis (1993) “Economies of Scale and Scope and Competition in the Postal Services,” in M.A. Crew and P.R. Kleindorfer (ed.), Regulation and the
Nature of Postal and Delivery Services, Kluwer Academic Publishers, Boston.
Rosenkranz, S. (2003) “Simultaneous Choice of Process and Product Innovation when Consumers have a Preference for Product Variety,” Journal of Economic Behavior and
Organization, 50: 183-201.
WIK (2006) “Main Developments in the Postal Sector 2004-2006,” Study for the European
Commission. http://ec.europa.eu/internal_market/post/doc/studies/2006-wik-final_en.pdf