Food consumption of adults in Germany: results of the German National
Nutrition Survey II based on diet history interviews
Thorsten Heuer
1*†, Carolin Krems
1†, Kilson Moon
1, Christine Brombach
2and Ingrid Hoffmann
11Department of Nutritional Behaviour, Max Rubner-Institut, Federal Research Institute of Nutrition and Food,
Haid-und-Neu-Straße 9, 76131 Karlsruhe, Germany
2Institute for Food and Beverage Innovation, Centre for Nutrition, Zurich University of Applied Sciences,
Einsiedlerstrasse 34, 8820 Wa¨denswil, Switzerland
(Submitted 24 September 2014 – Final revision received 7 January 2015 – Accepted 16 February 2015 – First published online 13 April 2015)
Abstract
The second German National Nutrition Survey (NVS II) aimed to evaluate food consumption and other aspects of nutritional behaviour of a representative sample of the German population, using a modular design with three different dietary assessment methods. To assess usual food consumption, 15 371 German speaking subjects 14 – 80 years of age completed a diet history interview between November 2005 and November 2006. With reference to the guidelines of the German Nutrition Society (DGE), NVS II observed that the German population did not eat enough foods of plant origin, especially vegetables and consumed too much of meat and meat products. While generally similar food consumption is observed in other European countries, consumption of bread, fruit juices/nectars and beer is higher in Germany. On average, men consumed two times more meat and soft drinks as well as six times more beer than women did, whereas the consumption of vegetables, fruit as well as herbal/fruit tea was higher in women. Older participants showed a lower consumption of meat, fruit juice/nectars, soft drinks and spirits as well as a higher consumption of fish, vegetables, fruit, and herbal/fruit tea than ado-lescents and younger adults did. There are also differences in food consumption with regard to socio-economic status (SES). Persons with higher SES consumed more vegetables, fruit, fish, water, coffee/tea and wine, while persons with lower SES consumed more meat and meat products, soft drinks and beer. In general, the food consumption of women, the elderly and the higher SES group tends to be closer to the official dietary guidelines in Germany.
Key words:Food consumption: Adults: Socio-economic status: Diet history interviews: German National Nutrition Survey II
National nutrition surveys provide information on food consumption and nutritional behaviour of the general popu-lation and specific popupopu-lation groups, such as age groups and socio-economic status (SES) groups. These data serve amongst others as a basis for national and international dietary guidelines, for scientific issues as well as for decision- and policy-making.
Since the first German National Nutrition Survey, carried out from 1985 till 1988(1), living conditions and life style of many people in Germany have changed as the political situation (reunion) and food supply. Against this background, the Federal Ministry of Food, Agriculture and Consumer Protection commissioned the Max Rubner-Institut to conduct the German National Nutrition Survey II (NVS II) to provide current, reliable and representative data on food consumption
and further aspects of nutritional behaviour of the German population. The NVS II shows a modular design by applying three dietary assessment methods to meet different demands of a dietary survey, e.g. nutritional behaviour research or risk assessment. The present article provides results on food consumption of adults and adolescents living in Germany and of specific subgroups (sex, age and SES) of the NVS II based on diet history interviews. For a comprehensive overview of food consumption behaviour of the German popu-lation the most important sociodemographic parameters were considered. By using the diet history approach, usual food consumption patterns are described and compared with the dietary guidelines of the German Nutrition Society (DGE)(2). Furthermore, the results are compared with those of food consumption surveys in other European countries.
† Both authors contributed equally to this work.
* Corresponding author: Dr T. Heuer, fax þ 49 721 6625 552, email [email protected]
Abbreviations: DGE, German Nutrition Society; DISHES, Diet Interview Software for Health Examination Studies; NVS II, German National Nutrition Survey II; SES, socio-economic status.
British Journal of Nutrition (2015), 113, 1603–1614 doi:10.1017/S0007114515000744
qThe Authors 2015. The online version of this article is published within an Open Access environment subject to the conditions of the
Creative Commons Attribution license http://creativecommons.org/licenses/by/3.0/
British
Journal
of
Nutrition
https:/www.cambridge.org/core/terms. https://doi.org/10.1017/S0007114515000744
Methods Study design
The NVS II is a nationwide representative study conducted in Germany between November 2005 and January 2007. The participants were 14 – 80 years of age, German speaking and living in private households.
In the NVS II a two-stage sampling procedure was used. In the first stage all municipalities in Germany were stratified by administrative district and type (e.g. rural and urban). With reference to this stratification matrix, 500 nationwide sample points were randomly identified from the total number of municipalities in Germany, considering the proportion of the population living in each federal state and administrative district. At each of the selected sample points, the required number of addresses was randomly drawn from the respective local population registries, stratified by sex and age. The complete pool of addresses was drawn at the same time before the beginning of the interviews. Subjects who refused to participate in the study were not replaced. The pool of drawn addresses was found adequate to achieve the target number of 20 000 participants. The NVS II was approved by the German Federal Data Protection Office. Respondents were informed in detail about the study objectives, interview and examination procedures as well as the handling of data records and analyses under pseudonymous conditions. It was made clear that participation was on a voluntary basis and could be terminated at any time. In total, 46 587 individuals were contacted by an invitation letter and invited to a study centre. Across Germany 19 329 subjects agreed to participate. The response rate was 42 %.
Figure 1 provides an overview of the dietary assessment methods applied in the NVS II and of the corresponding number of participants. A computer-assisted personal inter-view (n 19 329) and a complementary self-administered questionnaire (n 14 288) were the instruments used to obtain information on sociodemographics, such as education, occu-pation, household structure and income as well as nutritional behaviour, health aspects (e.g. smoking), use of dietary sup-plements, food purchase, leisure time activities and sleeping behaviour. Anthropometric measurements (body height and body weight, n 14 331) were determined according to the technique described by Lohman and colleagues(3). Height was
measured with portable Harpenden Stadiometers (Holtain Limited) and body weight with the calibrated scale seca 862 (seca Vogel & Halke) after shoes, coats and sweaters had been taken off. BMI was calculated using the following formula:
BMI ðkg=m2Þ ¼ weight ðkgÞ=height ðm2Þ:
The usual food consumption of 15 371 participants of the study was assessed from November 2005 to November 2006 through a personal diet history interview using the programme DISHES (Diet Interview Software for Health Examination Studies). DISHES 98 was developed and validated by the Robert Koch-Institute in Germany and applied in the Nutrition Module of the German National Health Interview and Examination Survey of 1998(4,5). DISHES 2005 was used for NVS II after it was adapted to the requirements of the present study(6).
During the DISHES interview at the study centres participants were asked to give details of the foods and beverages they consumed during the preceding 4 weeks. First, information on usual meal patterns was obtained. Using this information, frequency and consumed amounts of individual food items or beverages of each meal occasion were assessed next in a standardised manner. For quantification of consumed amounts, tableware models (cups, glasses, spoons, plates and bowls) and an excerpt of the EPIC-SOFT picture book with different portion sizes of food items were used(7,8). Food items in the DISHES programme are directly linked with the German nutri-ent database (BLS) which allows calculation of energy and nutrient intake and splitting up of recipes into ingredients(9). In order to enhance data quality, high attention was paid to quality assurance procedures. Therefore, data controls for plausibility were performed to identify and correct data input errors (e.g. for quantities, extremes in energy and nutrient intake) and about 3400 interviewer’s comments were checked and integrated into the interview data.
To quantify ingredients of composite dishes (e.g. meat in a lasagne), recipes which were named by the participants in the diet history interviews were disaggregated into their ingredients except for bread, pastries, soups, sauces and confectionery. The disaggregation is based on the recipes of the German Nutrient Database (BLS version 3.01)(9). Thereafter all foods were categorised into food groups (Table 1).
Statistical analysis
Regarding demographical characteristics, the sample of the NVS II participants who completed the diet history interviews differs only slightly from the total population of Germany assessed by the ‘Microcensus 2006’ which provides official representative statistics of the population in Germany(10,11). To ensure repre-sentativeness of the German population, existing differences were compensated by weighting the data according to ‘Microcensus 2006’ for gender, age, federal state, administrative district, school education, employment and household size. Furthermore, data were weighted on an equal distribution of the interview month over the study period.
To describe the social status of participants, a social class-index was created based on net monthly income of the
All participants completed a computer-assisted personal interview 24-h recalls (n 13 926) Diet history interview (n 15 371) Weighing records (n 975)
Fig. 1. Dietary assessment methods applied in the second German National Nutrition Survey. T. Heuer et al. 1604
British
Journal
of
Nutrition
https:/www.cambridge.org/core/terms. https://doi.org/10.1017/S0007114515000744household, school education level of the participant and employment status of the principal earner of the household. Based on this index participants were assigned to five social classes: upper, higher middle, middle, lower middle and lower class(12). For reasons of clarity and readability, the social classes were aggregated to three classes: upper (¼ upper and higher middle), middle as well as lower (¼ lower middle and lower) class.
Underreporting of participants was calculated via ratio of energy intake and resting energy expenditure. Energy intake was calculated using the BLS version 3.01(9). Resting energy expenditure was calculated by the use of the formula of Mu¨ller et al.(13), considering body height and body weight. Under-reporting was defined as ratio of energy intake and resting energy expenditure ,1·09 which was calculated using equations derived by Goldberg et al.(14), and adopted by Black(15).
Food consumption is shown as arithmetic mean and 95 % CI. Comparisons are made with the CI of the mean. Differences between groups are considered to be significant if CIs do not overlap. Arithmetic mean for food consumption was chosen because foods eaten rarely (e.g. nuts and seeds) were consumed by less than 50 % of the participants, leading to medians with the value ‘0’. This is of restricted use when
comparing food consumption. All statistical analyses were performed using the statistical software package SAS version 9.2 (SAS Institute, Inc.).
Results
Of the 15 371 participants of the NVS II who completed the diet history interview, 7093 were men (46·1 %) and 8278 women (53·9 %). Mean age was 46·3 years for men and 46·1 years for women with an age range from 14 to 80 years. The study population of adult men and women was on average overweight (BMI . 25 kg/m2) and nearly 30 % of the parti-cipants were smokers (Table 2). Approximately a quarter of the participants had completed higher education (12 or 13 years of school education), and more than half were employed.
High-carbohydrate foods
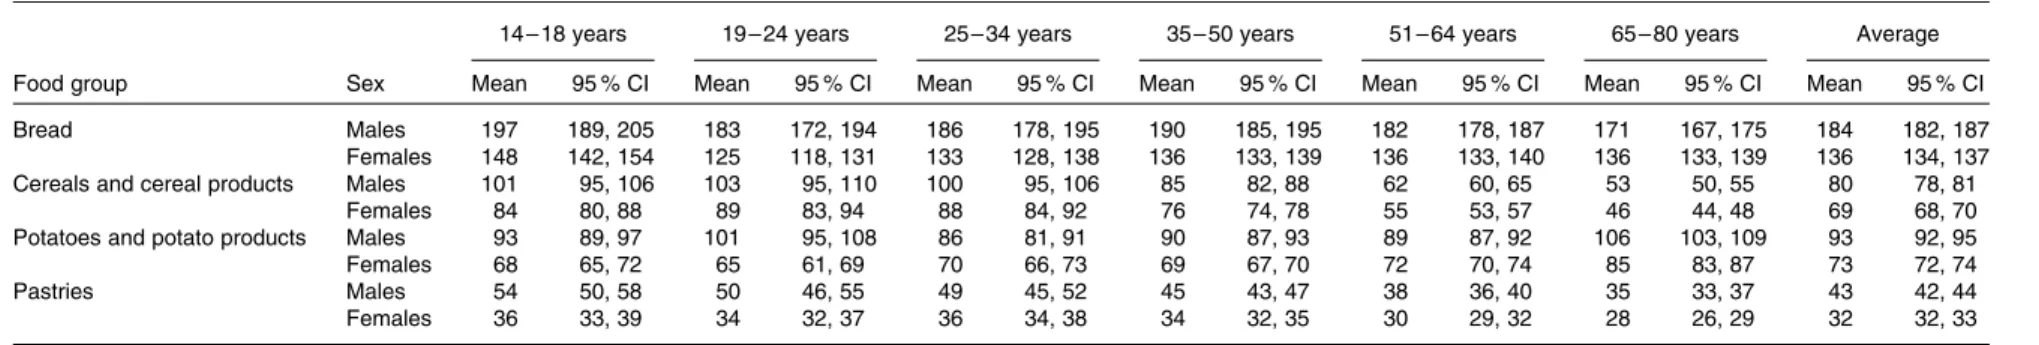
Concerning the mean daily consumption of high-carbohydrate foods by age and sex, men of all age groups generally con-sumed more bread, cereals and cereal products, potatoes and potato products and pastries than women (Table 3). Table 1. Description of the food groups
Food group Foods included
Bread Including rolls, baguette, toast, rusk
Cereals and cereal products Cereals, flours, rice and processed products like breakfast cereals, pasta, popcorn Potatoes and potato products Fresh potatoes, heated and processed products like chips, potato pancakes, potato crisps Pastries Cake, pies, piquant pastries like filled puff paste, cheese straw,
snacks, peanut flips, cracker, tortilla chips Vegetables, vegetable products, mushrooms and pulses
Raw Including frozen vegetables
Heated Including vegetable products
Fruit and fruit products (without juice)
Fruit Including unsweetened frozen fruit
Fruit products Including fruit sauces and processed products like sweetened or heated fruit, canned fruit, dried fruit
Nuts and seeds Hazelnuts, peanuts, almonds etc. or processed products like peanut butter, salted or roasted nuts
Milk, dairy products and cheese
Milk and mixed milk drinks Including cacao drinks, milkshakes
Dairy products Yoghurt, (sour) cream, buttermilk, kefir, whey Cheese and curd cheese Including soft cheese, cream cheese, acid curd cheese Meat, meat products and sausages Meat products: including meat sauces and
processed meat products like cured pork, meatballs Fish, fish products and seafood Salt- and freshwater fish, shrimps, mussels, snails,
processed products like caviar, tinned fish Eggs
Fats and oils
Vegetable fats and oils Including margarine and other spreadable fats
Animal fats Including butter
Soups
Sauces and spicy ingredients Warm and cold sauces (e.g. ketchup, fruit sauces), mustard, vinegar etc. Confectionery, total
Sweets, ice cream and desserts Sweets, ice cream, cream, desserts, powdered drinks, - granulate
Sweet spreads Jam, jellies, honey and chocolate spreads
Sweetener Sweeteners, sugar substitutes
Non-alcoholic beverages Water, coffee and tea (black/green), herbal/fruit tea, fruit juices/nectars, soft drinks, other non-alcoholic beverages: malt coffee, malt beer, non-alcoholic beer/sparkling wine
Alcoholic beverages Beer (including mixed beer drinks), wine and sparkling wine, spirits and other alcoholic beverages: schnapps, liqueurs, cocktails, alcopops
Food consumption in Germany 1605
British
Journal
of
Nutrition
https:/www.cambridge.org/core/terms. https://doi.org/10.1017/S0007114515000744
While the consumption of bread was similar between young and older subjects, the younger subjects (14 – 50 years) ate more cereals and cereal products and pastries than the older ones. Older subjects (65 – 80 years) consumed more potatoes and potato products than younger subjects. The DGE recommends overall 400 – 550 g of bread, cereals and cereal products and potatoes and potato products per d. Men’s con-sumption was slightly below these dietary guideline values. Women, however, recorded a little less than three-fourth of the recommended amount.
Vegetables, fruit, nuts and seeds
Consumption of vegetables, vegetable products, mushrooms and pulses was on average slightly higher for women than for men (Table 4). Women consumed more raw vegetables, whereas men ate more heated products. Across the age groups an increasing consumption of total vegetables was observed for the age group of 51 – 64 years of both sexes. Of the different age groups, only the middle-aged women (35 – 64 years) showed a higher consumption of total veg-etables compared to men of the same age group. Compared to the dietary guidelines of the DGE (400 g/d vegetables), men and women consumed about half of the recommended amount of vegetables.
Women in general consumed more fruit and fruit products than men. The consumption was higher in older age groups (51 – 80 years) for both sexes. Women aged 25 – 80 years and men aged 51 – 80 years met the dietary guidelines of the DGE (at least 250 g/d fruits). Among all age groups, a small number of men and women consumed nuts and seeds result-ing in small average amounts of consumption.
Milk, dairy products and cheese
The consumption of milk, dairy products and cheese in general was higher in men than in women in the age groups 14 – 50 years (Table 5). However, there is no difference between both sexes in older age groups (51 – 80 years). Men consumed more milk and mixed milk drinks than women, except for the age group of 65 and older. Women aged 35 – 80 years ate more dairy products than men of the same age, but the consumption of boys aged 14 – 18 years was higher than that of girls. In general, both men and women consumed similar amounts of cheese and curd cheese; however, in the age group 19 – 34 years, the consump-tion was higher in men than in women. The mean overall consumption of milk, dairy products and cheese of men, except for the age groups 51 – 80 years, conformed to the dietary guidelines of the DGE (250 – 310 g/d milk and dairy products); the consumption of women in general was found to be slightly below these guideline values.
Meat, fish and eggs
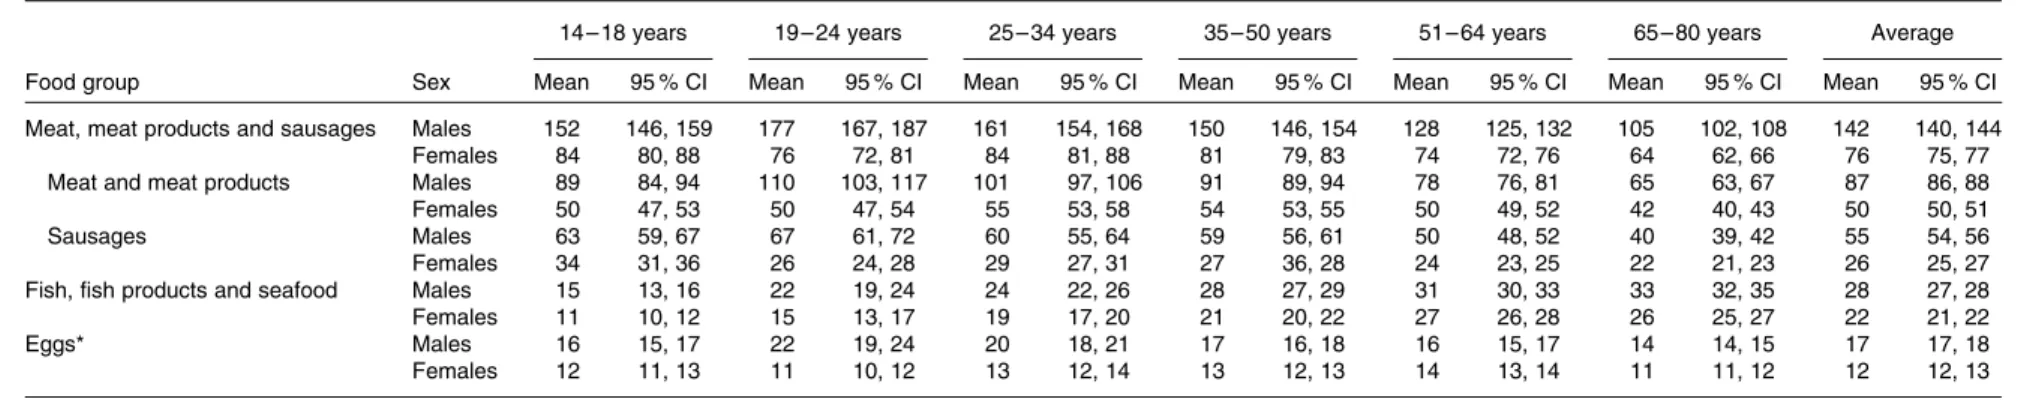
Men ate almost twice as much meat, meat products and sausages than women (Table 6). Male and female seniors (65 – 80 years) consumed less meat, meat products and sausages than the other age groups. About 2·5 % of all participants did not eat meat, meat products and sausages during the preceding 4 weeks. Men in all age groups exceeded the dietary guidelines of the DGE (300 – 600 g/week ¼ 43 – 86 g/d meat, meat products and sausages), whereas women were in the upper range of the guidelines.
The consumption of fish was higher in men than in women. Older people (51 – 80 years) ate more fish than the younger ones. About 16 % of the participants declared that they did not eat fish, fish products and seafood in the preceding 4 weeks. The DGE recommends 150 – 220 g fish/week (¼ 21 – 31 g/d). Men aged 14 – 18 years and women aged 14 – 34 years recorded values below the guidelines, while the other age groups met the guidelines.
With regard to the consumption of eggs men on average consumed more than women. The DGE recommends less than three eggs a week (including processed eggs). Assuming that an egg is about 60 g, the consumption of 180 g/week (26 g/d) should not be exceeded. The consumption of eggs among all age and sex groups was found short of these dietary guidelines, when eggs in pastries, soups and sauces are not included.
Fats and oils
The daily consumption of fats and oils in total as well as of those of vegetable and animal origin viewed separately was Table 2. Description of the NVS II (German National Nutrition
Survey II) participants who completed the diet history interview (n 15 371)*
(Mean values with their standard errors; percentages)
Men (n 7093) Women (n 8278) Age group (%) 14 – 18 years 7·2 6·6 19 – 24 years 8·8 7·9 25 – 34 years 14·5 14·2 35 – 50 years 31·6 30·1 51 – 64 years 20·6 20·6 65 – 80 years 17·4 20·6 BMI† (kg/m2) 14 – 18 years Mean 22·5 22·1 SE 0·2 0·2 19-64 years Mean 26·7 25·6 SE 0·1 0·1 65 – 80 years Mean 28·4 28·3 SE 0·1 0·1 Smoker (%) 33·8 24·4 School education (%) Pupils 5·8 5·9 9 years 41·0 39·1 10 years 25·5 29·8 12 or 13 years 24·9 22·2 Other 2·9 3·0 Employees (%) 60·0 48·6 SES (%) Low 23·8 28·2 Medium 33·2 33·5 High 43·0 38·3
SES, socio-economic status. * Data are weighted.
† 6 % of the participants (376 men and 566 women) did not take part in the anthropometric measurements.
T. Heuer et al. 1606
British
Journal
of
Nutrition
https:/www.cambridge.org/core/terms. https://doi.org/10.1017/S0007114515000744Table 4. Mean daily consumption of vegetables, fruit, nuts and seeds (g) by sex and age groups (Mean values and 95 % confidence intervals)
Food group Sex
14 – 18 years 19 – 24 years 25 – 34 years 35 – 50 years 51 – 64 years 65 – 80 years Average
Mean 95 % CI Mean 95 % CI Mean 95 % CI Mean 95 % CI Mean 95 % CI Mean 95 % CI Mean 95 % CI
Vegetables, vegetable products, mushrooms and pulses
Males 187 177, 196 212 198, 225 222 211, 232 237 231, 244 245 238, 252 237 231, 244 231 227, 234 Females 196 187, 206 206 195, 218 232 223, 241 257 252, 263 260 253, 268 231 225, 238 241 238, 244 Raw Males 97 90, 105 111 100, 122 113 106, 121 126 122, 131 135 129, 141 116 110, 121 121 118, 124 Females 122 115, 129 113 104, 121 132 125, 139 151 146, 156 149 143, 155 120 115, 125 136 134, 139 Heated Males 89 84, 94 101 94, 108 108 102, 114 111 108, 114 110 107, 113 122 118, 125 110 108, 112 Females 74 70, 78 94 87, 100 100 95, 104 107 104, 109 112 108, 115 112 108, 115 105 103, 106
Fruit and fruit products (without juice)
Males 175 161, 190 161 146, 176 181 168, 193 218 209, 227 275 264, 287 299 287, 310 230 225, 235
Females 226 209, 242 212 196, 227 250 234, 265 260 252, 268 331 319, 343 318 307, 328 279 274, 284
Fruit Males 172 157, 186 157 142, 172 176 164, 189 212 203, 221 267 256, 278 279 268, 291 222 217, 227
Females 219 203, 235 209 193, 224 245 229, 260 253 246, 261 322 310, 334 299 289, 309 270 265, 275
Fruit products Males 4 3, 5 4 3, 5 5 3, 6 6 5, 7 9 8, 10 19 17, 22 8 8, 9
Females 7 5, 9 3 2, 4 5 4, 6 7 6, 8 9 8, 10 19 17, 20 9 9, 10
Nuts and seeds Males 3 2, 4 3 3, 4 4 3, 5 6 5, 7 5 5, 6 3 3, 4 5 4, 5
Females 2 1, 3 3 2, 3 3 2, 4 4 3, 4 5 5, 6 3 2, 3 4 3, 4
Table 3. Mean daily consumption of high carbohydrate foods (g) by sex and age groups (Mean values and 95 % confidence intervals)
Food group Sex
14 – 18 years 19 – 24 years 25 – 34 years 35 – 50 years 51 – 64 years 65 – 80 years Average
Mean 95 % CI Mean 95 % CI Mean 95 % CI Mean 95 % CI Mean 95 % CI Mean 95 % CI Mean 95 % CI
Bread Males 197 189, 205 183 172, 194 186 178, 195 190 185, 195 182 178, 187 171 167, 175 184 182, 187
Females 148 142, 154 125 118, 131 133 128, 138 136 133, 139 136 133, 140 136 133, 139 136 134, 137
Cereals and cereal products Males 101 95, 106 103 95, 110 100 95, 106 85 82, 88 62 60, 65 53 50, 55 80 78, 81
Females 84 80, 88 89 83, 94 88 84, 92 76 74, 78 55 53, 57 46 44, 48 69 68, 70
Potatoes and potato products Males 93 89, 97 101 95, 108 86 81, 91 90 87, 93 89 87, 92 106 103, 109 93 92, 95
Females 68 65, 72 65 61, 69 70 66, 73 69 67, 70 72 70, 74 85 83, 87 73 72, 74 Pastries Males 54 50, 58 50 46, 55 49 45, 52 45 43, 47 38 36, 40 35 33, 37 43 42, 44 Females 36 33, 39 34 32, 37 36 34, 38 34 32, 35 30 29, 32 28 26, 29 32 32, 33 Food consumption in Ger many 1607
British Journal of Nutrition
https:/www.cambridge.org/core/terms
.
https://doi.org/10.1017/S0007114515000744
Downloaded from
https:/www.cambridge.org/core
. University of Basel Library
, on
30 May 2017 at 18:18:30
Table 6. Mean daily consumption of meat, fish and eggs (g) by sex and age groups (Mean values and 95 % confidence intervals)
Food group Sex
14 – 18 years 19 – 24 years 25 – 34 years 35 – 50 years 51 – 64 years 65 – 80 years Average
Mean 95 % CI Mean 95 % CI Mean 95 % CI Mean 95 % CI Mean 95 % CI Mean 95 % CI Mean 95 % CI
Meat, meat products and sausages Males 152 146, 159 177 167, 187 161 154, 168 150 146, 154 128 125, 132 105 102, 108 142 140, 144
Females 84 80, 88 76 72, 81 84 81, 88 81 79, 83 74 72, 76 64 62, 66 76 75, 77
Meat and meat products Males 89 84, 94 110 103, 117 101 97, 106 91 89, 94 78 76, 81 65 63, 67 87 86, 88
Females 50 47, 53 50 47, 54 55 53, 58 54 53, 55 50 49, 52 42 40, 43 50 50, 51
Sausages Males 63 59, 67 67 61, 72 60 55, 64 59 56, 61 50 48, 52 40 39, 42 55 54, 56
Females 34 31, 36 26 24, 28 29 27, 31 27 36, 28 24 23, 25 22 21, 23 26 25, 27
Fish, fish products and seafood Males 15 13, 16 22 19, 24 24 22, 26 28 27, 29 31 30, 33 33 32, 35 28 27, 28
Females 11 10, 12 15 13, 17 19 17, 20 21 20, 22 27 26, 28 26 25, 27 22 21, 22
Eggs* Males 16 15, 17 22 19, 24 20 18, 21 17 16, 18 16 15, 17 14 14, 15 17 17, 18
Females 12 11, 13 11 10, 12 13 12, 14 13 12, 13 14 13, 14 11 11, 12 12 12, 13
* Without eggs in pastries, soups and sauces.
Table 5. Mean daily consumption of milk, dairy products and cheese (g) by sex and age groups (Mean values and 95 % confidence intervals)
Food group Sex
14 – 18 years 19 – 24 years 25 – 34 years 35 – 50 years 51 – 64 years 65 – 80 years Average
Mean 95 % CI Mean 95 % CI Mean 95 % CI Mean 95 % CI Mean 95 % CI Mean 95 % CI Mean 95 % CI
Milk, dairy products and cheese Males 345 325, 365 305 275, 335 291 266, 316 256 244, 267 227 216, 239 219 207, 230 259 253, 266
Females 250 234, 267 251 227, 275 243 231, 255 231 223, 239 237 227, 246 231 221, 240 237 232, 241
Milk and mixed milk drinks Males 233 214, 252 191 163, 219 165 142, 188 128 118, 139 96 87, 106 87 78, 96 133 127, 139
Females 156 140, 171 136 114, 159 119 110, 128 95 89, 101 79 72, 86 86 78, 94 100 97, 104
Dairy products Males 75 67, 82 69 61, 78 80 72, 87 82 78, 87 81 75, 87 81 76, 87 80 77, 82
Females 61 56, 66 80 72, 87 86 80, 92 92 88, 96 108 103, 113 96 90, 101 92 90, 95
Cheese and curd cheese Males 37 35, 40 45 41, 50 46 42, 50 45 43, 47 50 47, 53 50 48, 53 46 45, 48
Females 34 32, 37 34 32, 37 38 36, 40 44 43, 46 49 47, 51 49 47, 52 44 43, 45 T . Heuer et al. 1608
British Journal of Nutrition
https:/www.cambridge.org/core/terms
.
https://doi.org/10.1017/S0007114515000744
Downloaded from
https:/www.cambridge.org/core
. University of Basel Library
, on
30 May 2017 at 18:18:30
generally higher in men than in women (Table 7). Men and women of all age groups showed no or only minor differences regarding the consumption of vegetable fats and oils v. animal fats. The consumption of both sexes is within the dietary guidelines of the DGE (25 – 45 g/d fats and oils).
Soups, sauces and confectionery
Of the remaining food groups, men on average consumed more soups than women, and seniors showed the highest consumption of soups (Table 8). In total and in all age groups, men consumed more sauces and spicy ingredients than women. The consumption of sweets, ice cream and des-serts was slightly higher in men than in women and was higher in young and middle-aged participants (14 – 50 years) than in older ones. In general, the consumption of sweet spreads was slightly higher in men with the highest consump-tion in the older participants (65 – 80 years) of both sexes. The consumption of sweeteners was higher in men than in women.
Non-alcoholic beverages
For both sexes, the largest proportion of non-alcoholic beverages was water which accounts for approximately half of the consumption (Table 9). A quarter of the non-alcoholic beverages are coffee and green/black tea. The consumption of water is similar between both sexes. Women drank twice as much herbal/fruit tea per d than men. Consumption of soft drinks showed the opposite: the consumption in men was more than 2·5 times higher per d than women. The highest consumption of herbal/fruit tea was found in older age groups, whereas the consumption of fruit juice/nectars and soft drinks was lower in older participants. Both sexes met the dietary guidelines of the DGE (at least 1·5 l/d non-alcoholic beverage) very well.
Alcoholic beverages
Men generally drank more alcoholic beverages than women (Table 10). Especially with regard to beer, men drank six times more than women. Additionally, concerning alcohol consumption differences were found between the age groups. Men aged 51 – 80 years and women aged 35 – 64 years drank more wine and sparkling wine compared to the other age groups.
Among the different age groups, spirits and other alcoholic beverages like alcopops were consumed to the highest amount by young people (14 – 24 years).
Socio-economic status
Concerning the SES there were no differences regarding the consumption of bread (Table 11). Participants with higher SES showed higher consumption of cereals and cereal pro-ducts, but lower consumption of potatoes and potato products than those of lower SES. Men and women of higher SES ate
more vegetables, fruit and fish, and consumed less meat and Table
7 . Mean daily consumption of fats and o ils (g) b y s ex and age groups (Mean values and 9 5 % confidence intervals) Food group Sex 14 – 1 8 y ears 19 – 2 4 years 25 – 3 4 y ears 35 – 5 0 y ears 51 – 6 4 y ears 65 – 8 0 y ears Average Mean 95 % C I M ean 9 5 % CI Mean 9 5 % CI Mean 9 5 % CI Mean 95 % C I M ean 9 5 % CI Mean 9 5 % CI Fats and oils* Males 34 32, 3 6 3 4 3 1, 36 38 36, 41 39 38, 4 1 4 0 3 9, 41 39 37, 4 0 3 8 38, 39 Females 23 22, 2 4 2 3 2 1, 25 25 24, 26 28 27, 2 8 2 8 2 7, 29 30 29, 3 1 2 7 27, 28 Vegetable fats and oils Males 16 15, 1 7 1 7 1 6, 19 21 19, 22 20 19, 2 1 2 1 2 0, 22 19 18, 2 0 2 0 19, 20 Females 12 11, 1 3 1 3 1 1, 14 14 13, 15 14 14, 1 5 1 5 1 4, 15 14 14, 1 5 1 4 14, 14 Animal fats Males 18 16, 2 0 1 6 1 4, 18 17 16, 19 19 18, 2 1 1 9 1 8, 20 20 19, 2 1 1 9 18, 19 Females 11 10, 1 2 1 0 9 , 1 2 1 1 10, 12 14 13, 1 4 1 4 1 3, 14 16 15, 1 6 1 3 13, 14 * W ithout fats and o ils in pastrie s, soups and sauces.
Food consumption in Germany 1609
British
Journal
of
Nutrition
https:/www.cambridge.org/core/terms. https://doi.org/10.1017/S0007114515000744
Table 9. Mean daily consumption of non-alcoholic beverages (g) by sex and age groups (Mean values and 95 % confidence intervals)
Food group Sex
14 – 18 years 19 – 24 years 25 – 34 years 35 – 50 years 51 – 64 years 65 – 80 years Average
Mean 95 % CI Mean 95 % CI Mean 95 % CI Mean 95 % CI Mean 95 % CI Mean 95 % CI Mean 95 % CI
Water Males 1086 1013, 1158 1294 1193, 1394 1169 1100, 1239 1187 1147, 1226 1111 1071, 1151 991 954, 1028 1137 1116, 1158
Females 975 914, 1037 1106 1033, 1178 1153 1102, 1205 1201 1169, 1232 1193 1155, 1230 1057 1023, 1092 1140 1123, 1158 Coffee and tea
(black/green)
Males 116 99, 132 295 257, 333 565 524, 606 708 682, 733 648 623, 674 534 515, 553 566 553, 578
Females 118 100, 136 272 240, 305 437 410, 464 610 591, 629 594 575, 613 488 472, 505 498 488, 507
Herbal/fruit tea Males 82 66, 98 78 58, 99 105 87, 124 139 125, 154 180 163, 198 232 211, 253 149 142, 157
Females 161 137, 184 228 196, 260 330 296, 364 333 313, 353 346 324, 368 346 324, 368 318 308, 329
Fruit juices/ nectars
Males 488 441, 534 382 331, 432 379 334, 424 288 269, 308 221 202, 240 145 130, 159 285 274, 296
Females 403 368, 438 357 311, 403 321 291, 352 234 218, 249 181 166, 196 179 164, 193 245 236, 254
Soft drinks Males 505 454, 556 471 441, 531 353 301, 405 206 187, 226 111 95, 127 41 33, 50 224 212, 236
Females 260 225, 295 191 157, 225 118 101, 136 89 78, 100 37 29, 45 24 18, 30 88 82, 94 Other non-alcoholic beverages Males 4 1, 6 11 3, 18 13 7, 18 17 12, 22 22 17, 27 24 19, 29 17 15, 19 Females 5 1, 10 3 0, 5 10 6, 13 17 14, 21 21 17, 26 24 19, 29 17 15, 19
Table 8. Mean daily consumption of soups, sauces and confectionery (g) by sex and age groups (Mean values and 95 % confidence intervals)
Food group Sex
14 – 18 years 19 – 24 years 25 – 34 years 35 – 50 years 51 – 64 years 65 – 80 years Average
Mean 95 % CI Mean 95 % CI Mean 95 % CI Mean 95 % CI Mean 95 % CI Mean 95 % CI Mean 95 % CI
Soups* Males 50 44, 55 46 40, 53 55 49, 60 52 48, 55 54 50, 58 63 58, 68 54 52, 56
Females 38 34, 42 48 41, 55 49 45, 54 45 42, 47 46 43, 49 55 51, 59 47 46, 49
Sauces and spicy ingredients Males 45 42, 49 51 48, 55 47 44, 51 47 45, 48 43 42, 45 40 39, 42 45 44, 46
Females 36 34, 39 36 34, 39 36 34, 38 35 34, 36 32 31, 33 31 30, 32 34 33, 35
Sweets, ice cream and desserts Males 68 63, 73 54 49, 59 56 51, 61 49 47, 51 38 35, 40 32 30, 34 46 45, 48
Females 61 57, 66 63 54, 72 55 51, 58 46 43, 48 32 30, 34 30 28, 32 43 42, 45
Sweet spreads Males 20 18, 22 12 10, 14 16 14, 19 17 16, 18 19 18, 20 26 25, 28 19 18, 19
Females 14 12, 15 13 11, 15 14 13, 15 15 14, 15 18 17, 19 24 22, 25 17 16, 17 Sweeteners Males 3 2, 3 7 5, 8 8 7, 9 8 7, 9 5 5, 6 4 3, 4 6 6, 6 Females 3 3, 4 4 4, 5 5 4, 5 4 3, 4 3 2, 3 2 2, 3 3 3, 4 * Without stews. T . Heuer et al. 1610
British Journal of Nutrition
https:/www.cambridge.org/core/terms
.
https://doi.org/10.1017/S0007114515000744
Downloaded from
https:/www.cambridge.org/core
. University of Basel Library
, on
30 May 2017 at 18:18:30
meat products, confectionery as well as fats and oils than participants with lower SES. Regarding the consumption of non-alcoholic and alcoholic beverages, there were different drinking habits between subjects with different SESs. Partici-pants with higher SES drank more water as well as coffee and tea, but less soft drinks than those with lower SES. Furthermore, men with high SES consumed less beer but men and woman with high SES consumed twice the amount of wine than subjects with low SES.
Discussion
The NVS II as a representative sample of the German popu-lation shows that the consumption of foods of plant origin is considerably below the dietary guideline values of the DGE(2), while the consumption of foods of animal origin exceed these. For example, the consumption of vegetables was slightly more than half of the recommended amount; only one-seventh of the participants met these guidelines. The total consumption of meat, meat products and sausages among men was two-thirds higher than the upper range of the guidelines. The dietary guidelines of at least 1·5 litre of non-alcoholic beverages a day were met, the largest proportion of which was water (approximately half of the consumption of total non-alcoholic beverages).
As different dietary assessment methods were applied in other European national food consumption surveys conducted about the same time period, only a rough comparison of the food consumption is possible. For most of the food groups, a striking common pattern regarding the consumed amount could be observed. However, in Germany the consumption of vegetables was more than one-third higher than that in: the Belgian Food Consumption Survey 2004 of 3249 subjects aged 15 years or over (assessed by two 24-h recalls)(16); the French Individual and National Food Consumption Surveys (2006 – 7) of 1922 sub-jects aged 18 – 79 years (assessed by a 7-d dietary record)(17); the Finnish FINDIET Survey 2007 of 2039 subjects aged 25 – 74 years (assessed by one 48-h recall)(18); and the Dutch National Food Consumption Survey (2007 – 10) of 2106 subjects aged 19 – 69 years (assessed by two 24-h recalls)(19). The data of the Italian National Food Consumption Survey (2005 – 6) of 2831 subjects aged 18 – 97·7 years (assessed by a 3-d dietary record)(20)and of the UK National Diet and Nutrition Survey (2008 – 9) of 431 subjects aged 19 – 64 years (assessed by a 4-d dietary record)(21)showed a comparable consumption of vegetables for the adult population. Furthermore, in the UK and in Finland the mean consumption of meat and meat products was more than 1·5 times higher than in Germany, whereas in the other above-mentioned European countries similar amounts of meat were consumed. Additionally, for some food groups the European comparison revealed the highest consumption for Germany. The consumption of bread was nearly twice that of the UK and one-fifth more than that in the Netherlands. Compared to other European countries(16 – 21), the consumption of fruit juices/nectars and beer was higher in Germany(16 – 21).
For the NVS II participants, differences were found in food consumption between the sexes. Men showed a higher con-sumption of most of the food groups than women. On average
Table 1 0. Mean daily consumption of alcoholic beverages (g) by sex and age groups (Mean values and 9 5 % confidence intervals) Food group Sex 14 – 1 8 y ears 19 – 2 4 years 25 – 3 4 y ears 35 – 5 0 years 51 – 6 4 years 65 – 8 0 years Average Mean 95 % C I M ean 9 5 % CI Mean 95 % C I M ean 9 5 % CI Mean 95 % C I M ean 9 5 % CI Mean 9 5 % CI Beer Males 162 140, 185 3 13 276, 349 227 202, 252 2 66 248, 284 2 79 258, 300 228 2 08, 247 253 2 44, 262 Females 3 5 2 8, 43 50 40, 6 0 3 4 2 9, 39 37 34, 4 1 4 4 39, 50 36 31, 4 2 3 9 3 7, 41 Wine and sparkling wine Males 5 4 , 7 14 11, 1 7 3 5 3 0, 41 45 42, 4 9 6 5 59, 72 75 68, 8 3 4 8 4 5, 50 Females 8 6, 9 2 8 2 2, 33 29 26, 3 2 4 7 4 3, 51 56 51, 60 33 29, 3 6 3 9 3 7, 41 Spirits and other alcoholic beverages Males 19 13, 2 4 2 5 2 0, 31 8 6 , 1 0 4 3, 4 4 3, 5 4 2, 6 7 7, 8 Females 1 4 1 0, 18 12 9, 14 3 2 , 4 2 1 , 2 2 1 , 2 1 1 , 2 3 3 , 4
Food consumption in Germany 1611
British
Journal
of
Nutrition
https:/www.cambridge.org/core/terms. https://doi.org/10.1017/S0007114515000744
they consumed two times more meat and soft drinks as well as six times more beer. In women, consumption of vegetables, fruit, and herbal/fruit tea was higher. Women in general showed a more favourable food choice in regard to the dietary guidelines of the DGE(2). Other European food consumption surveys showed similar sex-specific food consumption, especially regarding consumption of meat and vegetables(16 – 21). The higher absolute food consumption of men corresponds to their higher energy requirements compared to women. For most of the food groups food consumption calculated per 1000 kcal (4184 kJ) of total energy intake revealed no or only small sex differences (data not presented). After this adjustment for energy intake the con-sumption of vegetables and fruit was even higher and the consumption of meat was still less in women than in men.
Food consumption also differs between age groups. The amount of consumed foods and beverages per day was lower in elderly people: older men and women consumed less meat and meat products, fruit juice/nectars, soft drinks and spirits, whereas their consumption of fish, vegetables and fruit as well as herbal/fruit tea was higher than that of
younger people. This means that women and elderly people make healthier food choices than men and younger adults. Similar trends were observed in other European national food consumption surveys(16 – 18,20), in which the consumption of fish, vegetables and fruit was generally higher in elderly participants. Furthermore, the consumption of soft drinks, meat and meat products was higher in men and younger people.
In the present study, differences are found in food con-sumption regarding SES. The NVS II participants with higher SES consumed more vegetables and fruit, fish, water, coffee/ tea and wine. Participants with lower SES ate more meat and meat products and drank more soft drinks and beer. Therefore, people with higher SES exhibit healthier food choices. Comparable dietary patterns regarding SES were found in other European studies. Results from a meta-analysis of European national food consumption surveys (including eleven studies from seven countries during the period 1985–99, participants in the individual surveys aged 18 – 85 years)(22) revealed substantial differences between SES groups with respect to the consumption of vegetables and fruit. Subjects Table 11. Mean daily food consumption (g) by sex and socio-economic status (SES)
(Mean values and 95 % confidence intervals)
Food group Sex
SES
Low (n 3235) Medium (n 4767) High (n 7369)
Mean 95 % CI Mean 95 % CI Mean 95 % CI
Bread Males 180 175, 186 186 182, 191 186 182, 189
Females 134 130, 137 135 132, 137 138 135, 140
Cereals and cereal products Males 73 69, 77 77 74, 80 86 84, 88
Females 61 59, 64 66 64, 68 77 76, 79
Potatoes and potato products Males 98 94, 101 99 96, 101 87 85, 88
Females 80 78, 82 74 73, 76 66 65, 67
Vegetables, mushrooms and pulses and products thereof
Males 219 210, 227 226 220, 232 241 237, 246
Females 224 218, 231 233 227, 238 260 255, 265
Fruit and fruit products (without juice) Males 215 205, 226 229 220, 238 240 233, 247
Females 269 259, 279 275 267, 284 290 282, 297
Milk, dairy products and cheese Males 249 233, 265 273 260, 285 254 246, 262
Females 239 228, 249 234 226, 241 238 232, 244
Meat, meat products and sausages Males 152 147, 157 145 141, 150 133 131, 136
Females 80 77, 82 76 74, 78 74 72, 75
Fish, fish products and seafood Males 25 23, 27 27 26, 28 30 29, 31
Females 21 20, 22 21 20, 22 23 23, 24
Eggs Males 19 18, 20 17 16, 18 16 15, 17
Females 13 12, 14 12 12, 13 12 12, 13
Fats and oils Males 40 38, 41 39 38, 40 37 36, 38
Females 29 28, 30 27 26, 28 26 26, 27
Soups Males 64 59, 69 54 51, 57 48 46, 51
Females 54 51, 58 45 42, 47 45 43, 47
Sauces and spicy ingredients Males 47 44, 49 46 44, 48 44 43, 45
Females 35 34, 37 34 33, 35 33 32, 34
Confectionery, total Males 76 72, 80 73 71, 76 67 65, 69
Females 69 66, 73 65 62, 68 59 57, 60
Water Males 1054 1005, 1103 1133 1095, 1171 1185 1156, 1214
Females 1081 1045, 1118 1095 1064, 1125 1224 1198, 1250
Coffee and tea (black/green) Males 543 514, 573 521 499, 543 613 595, 630
Females 477 458, 497 485 468, 502 524 511, 538
Soft drinks Males 320 287, 354 250 227, 273 151 138, 163
Females 123 107, 139 84 74, 95 66 59, 73
Beer Males 284 258, 310 251 234, 267 238 227, 249
Females 39 34, 44 37 33, 41 40 37, 43
Wine and sparkling wine Males 32 27, 38 38 35, 42 63 60, 67
Females 25 22, 29 32 29, 35 56 52, 59 T. Heuer et al. 1612
British
Journal
of
Nutrition
https:/www.cambridge.org/core/terms. https://doi.org/10.1017/S0007114515000744with higher SES consumed more vegetables and fruit. Further-more, the data of three Dutch National Food Consumption Surveys (1987 – 8; 1992 and 1997 – 8) among a total of 6008 men and 6957 women aged 19 years and older showed that dietary intake among subjects with higher SES tended to be closer to the guidelines of the Netherlands Food and Nutrition Council. This finding was found quite stable throughout the decade of the study(23).
The strength of the present study is the large population sample of 15 371 participants which is representative of the German population. Limitations of the present study should also be taken into account. Every dietary assessment method has different strengths and weaknesses regarding measurement of food consumption. A frequently mentioned limitation of the diet history method is the difficult cognitive task for study partici-pants asked to recall food consumption of the previous 4 weeks(24 – 26). This becomes more relevant as subjective influ-ences like social desirability can affect responses. Surveys on intake of inhomogeneous food groups such as vegetables are especially affected by such subjective influences(27).
A more general limitation of dietary assessment methods is underreporting. In the present study, 22 % of the NVS II par-ticipants were considered to be underreporters for whom the ratio of energy intake and resting energy expenditure was lower than the cut-off based on equations derived by Goldberg et al.(14) and adopted by Black(15). Several national food consumption studies from other European countries show a similar level of underreporting(16,17,20). A limitation of the comparison of the results of the present study with those of other European food consumption surveys is that different dietary assessment methods were used in the surveys which are very likely to affect the findings. This should be kept in mind when comparing food consumption surveys across Europe, and it underscores the need for synchroni-sation and standardisynchroni-sation of dietary survey methodologies. Implementation of the already existing guidelines on harmo-nised methods and protocols for national food consumption surveys(28,29)would be the first step in this direction.
In conclusion, the results of the NVS II show that the German population in general consumes lower amounts of foods of plant origin and higher amounts of foods of animal origin than recommended. Substantial differences in food consumption exist between the different population groups (sex, age and socio-economic). Generally, women, elderly and people with higher SES tend to make healthier food choices and their food consumption is closer to the dietary guidelines. The consump-tion of most food groups in Germany is comparable to that in other European countries, whereas the consumption of bread, fruit juices/nectars and beer is highest in Germany.
Acknowledgements
The authors thank Anna Lehner for her support in the data preparation and Melanie Apel for her support in manuscript preparation.
The NVS II was funded by the German Federal Ministry of Food, Agriculture and Consumer Protection. The Ministry had no role in the design, analysis or writing of this article.
The authors’ contributions are as follows: T. H. and C. K. were responsible for data handling, statistical analyses and manuscript preparation, and were also involved in the study design and data interpretation; K. M. was involved in data analysis, data interpretation and manuscript preparation; C. B. was responsible for the study design and the realisation of the NVS II; I. H. contributed to data interpretation, critically reviewed the manuscript and had primary responsibility for the final content. All authors read and approved the final version of the manuscript.
None of the authors has any conflicts of interest to declare.
References
1. Heseker H, Hartmann S, Kubler W, et al. (1995) An
epi-demiologic study of food consumption habits in Germany. Metabolism 44, 10 – 13.
2. Deutsche Gesellschaft fu¨r Erna¨hrung (DGE) (2011) Die
Na¨hrstoffe – Bausteine fu¨ r Ihre Gesundheit (The Nutrients
– Elements for Your Health), 3rd revised ed. Bonn: DGE.
3. Lohman AF, Roche TG and Martorell R (editors) (1988)
ASRM. Champaign, IL: Human Kinetics Books.
4. Mensink GB, Hermann-Kunz E & Thamm M (1998) Der
Erna¨hrungssurvey (The Nutrition Survey). Gesundheitswesen 60, S83 – S86.
5. Mensink GB, Haftenberger M & Thamm M (2001) Validity
of DISHES 98, a computerised dietary history interview: energy and macronutrient intake. Eur J Clin Nutr 55, 409 – 417.
6. Krems C, Bauch A, Go¨tz A, et al. (2006) Methoden der
Natio-nalen Verzehrsstudie II (Methods of the National Nutrition Survey II). Ernaehrungs-Umsch 53, 44 – 50.
7. Slimani N, Deharveng G, Charrondiere RU, et al. (1999)
Structure of the standardized computerized 24-h diet recall interview used as reference method in the 22 centers partici-pating in the EPIC project. Comput Meth Programs Biomed 58, 251 – 266.
8. Slimani N, Ferrari P, Ocke M, et al. (2000) Standardization
of the 24-hour diet recall calibration method used in the european prospective investigation into cancer and nutrition (EPIC): general concepts and preliminary results. Eur J Clin Nutr 54, 900 – 917.
9. Max Rubner-Institut (2010) Bundeslebensmittelschlu¨ssel
(BLS): version 3.01 (German Nutrient Database: version 3.01). http://www.blsdb.de (accessed September 2014).
10. Max Rubner-Institut (2008) Nationale Verzehrsstudie II.
Ergebnisbericht, Teil 2 (National Nutrition Survey II. Second report). http://www.mri.bund.de/fileadmin/Institute/EV/ NVSII_Abschlussbericht_Teil_2.pdf (accessed September 2014).
11. Statistisches Bundesamt (2008) Qualita¨tsbericht Mikrozensus
2006 (Quality Report Microsensus 2006). Wiesbaden: Statis-tisches Bundesamt.
12. Max Rubner-Institut (2008) Nationale Verzehrsstudie II.
Ergebnisbericht, Teil 1 (National Nutrition Survey II. First
report). http://www.mri.bund.de/fileadmin/Institute/EV/
NVS_II_Abschlussbericht_Teil_1_mit_Ergaenzungsbericht.pdf (accessed September 2014).
13. Mu¨ller MJ, Bosy-Westphal A, Klaus S, et al. (2004) World
Health Organization equations have shortcomings for pre-dicting resting energy expenditure in persons from a modern, affluent population: generation of a new reference standard from a retrospective analysis of a German data-base of resting energy expenditure. Am J Clin Nutr 80, 1379 – 1390.
Food consumption in Germany 1613
British
Journal
of
Nutrition
https:/www.cambridge.org/core/terms. https://doi.org/10.1017/S0007114515000744
14. Goldberg GR, Black AE, Jebb SA, et al. (1991) Critical evalu-ation of energy intake data using fundamental principles of energy physiology: 1. derivation of cut-off limits to identify under-recording. Eur J Clin Nutr 45, 569 – 581.
15. Black AE (2000) Critical evaluation of energy intake using
the Goldberg cut-off for energy intake:basal metabolic rate. Int J Obes Relat Metab Disord 24, 1119 – 1130.
16. Vandevijvere S, De Vriese S, Huybrechts I, et al. (2009) The gap
between food-based dietary guidelines and usual food con-sumption in Belgium, 2004. Public Health Nutr 12, 423–431.
17. Dubuisson C, Lioret S, Touvier M, et al. (2010) Trends in food
and nutritional intakes of French adults from 1999 to 2007: results from the INCA surveys. Br J Nutr 103, 1035–1048.
18. Paturi M, Tapanainen H, Reinivuo H, et al. (2008) Finravinto
2007 – tutkimus (The National FINDIET 2007 Survey). Helsinki: National Public Health Institute.
19. van Rossum C, Fransen H, Verkaik-Kloosterman J, et al.
(2011) Dutch National Food Consumption Survey
2007 – 2010: Diet of Children and Adults Aged 7 to 69 years. Bilthoven: National Institute for Public Health and the Environment (RIVM).
20. Leclercq C, Arcella D, Piccinelli R, et al. (2009) The Italian
National Food Consumption Survey INRAN-SCAI 2005 – 06: main results: in terms of food consumption. Public Health Nutr 12, 2504 – 2532.
21. Whitton C, Nicholson SK, Roberts C, et al. (2011) National
Diet and Nutrition Survey: UK food consumption and nutri-ent intakes from the first year of the rolling programme and comparisons with previous surveys. Br J Nutr 106, 1899 – 1914.
22. Irala-Estevez J, Groth M, Johansson L, et al. (2000) A
sys-tematic review of socio-economic differences in food habits in Europe: consumption of fruit and vegetables. Eur J Clin Nutr 54, 706 – 714.
23. Hulshof KFAM, Brussaard JH, Kruizinga AG, et al. (2003)
Socio-economic status, dietary intake and 10 y trends: the Dutch National Food Consumption Survey. Eur J Clin Nutr 57, 128 – 137.
24. Rutishauser IH (2005) Dietary intake measurements. Public
Health Nutr 8, 1100 – 1107.
25. van Staveren WA, Ocke´ MC & de Vries JHM (2012)
Esti-mation of dietary intake. In Present Knowledge in Nutrition, 10th ed., pp. 1012 – 1026 [JW Erdman, IA Macdonald and SH Zeisel, editors]. Ames: Wiley-Blackwell.
26. Thompson FE & Subar AF (2013) Dietary assessment
meth-odology. In Nutrition in the Prevention and Treatment of Disease, 3rd ed., pp. 5 – 46 [AM Coulston, CJ Boushey and MG Ferruzzi, editors]. Oxford: Elsevier.
27. Eisinger-Watzl M, Straßburg A, Ramu¨nke J, et al. (2015)
Comparison of two dietary assessment methods by food consumption: results of the German National Nutrition Survey II. Eur J Nutr 54, 343 – 354.
28. Brussaard JH, Lowik MR, Steingrimsdottir L, et al. (2002) A
European food consumption survey method – conclusions and recommendations. Eur J Clin Nutr 56, Suppl. 2, S89 – S94.
29. EFSA (2009) General principles for the collection of national
food consumption data in the view of a pan-European dietary survey. EFSA J 7, 1 – 51.
T. Heuer et al. 1614