Electrophysiological Correlates of Rapid
Spatial Orienting Towards Fearful Faces
Gilles Pourtois1, Didier Grandjean2, David Sander2 and Patrik Vuilleumier1,3
1Neurology & Imaging of Cognition, University of Geneva, Switzerland, 2Geneva Emotion Research Group, University of Geneva, Switzerland and 3Department of Psychology, University of Geneva, Switzerland
We investigated the spatio-temporal dynamic of attentional bias towards fearful faces. Twelve participants performed a covert spatial orienting task while recording visual event-related brain potentials (VEPs). Each trial consisted of a pair of faces (one emotional and one neutral) briefly presented in the upper visual field, followed by a unilateral bar presented at the location of one of the faces. Participants had to judge the orientation of the bar. Comparing VEPs to bars shown at the location of an emotional (valid) versus neutral (invalid) face revealed an early effect of spatial validity: the lateral occipital P1 component (~130 ms post-stimulus) was selec-tively increased when a bar replaced a fearful face compared to when the same bar replaced a neutral face. This effect was not found with upright happy faces or inverted fearful faces. A similar amplifi-cation of P1 has previously been observed in electrophysiological studies of spatial attention using non-emotional cues. In a behav-ioural control experiment, participants were also better at discrim-inating the orientation of the bar when it replaced a fearful rather than a neutral face. In addition, VEPs time-locked to the face-pair onset revealed a C1 component (~90 ms) that was greater for fearful than happy faces. Source localization (LORETA) confirmed an extra-striate origin of the P1 response showing a spatial validity effect, and a striate origin of the C1 response showing an emotional valence effect. These data suggest that activity in primary visual cortex might be enhanced by fear cues as early as 90 ms post-stimulus, and that such effects might result in a subsequent facilitation of sensory processing for a stimulus appearing at the same location. These results provide evidence for neural mechanisms allowing rapid, exogenous spatial orienting of attention towards fear stimuli. Keywords: emotion, face perception, fear, human electrophysiology, source
localization, spatial attention
Introduction
Different lines of evidence suggest that threat-related signals are rapidly and efficiently processed by specialized emotion mechanisms (LeDoux, 1996; Öhman and Mineka, 2001; Adolphs, 2003) and that our attention tends to be prioritized towards threat rather than neutral stimuli (Fox, 2002; Vuil-leumier, 2002). Behavioural studies have used a variety of para-digms borrowed from cognitive psychology to explore the effects of emotion on spatial attention, including covert orienting in dot-probe tasks (Mogg and Bradley, 1999; Mogg et al., 2000), visual search (Hansen and Hansen, 1988; Fox et al., 2000; Eastwood et al., 2001; Öhman et al., 2001), stroop inter-ference (Pratto and John, 1991; Williams et al., 1996) and atten-tional blink experiments (Anderson and Phelps, 2001). Most of these studies found that negative or threat-related stimuli may summon attention more readily than neutral stimuli. Thus, people are quicker at detecting fearful or angry faces among
neutral distracters than vice versa (Hansen and Hansen, 1988; Fox, 2002), quicker at identifying probes replacing the loca-tion of threatening rather than neutral faces or words (Mogg et al., 1997), and better at perceiving words with aversive meaning than neutral words (Anderson and Phelps, 2001). Such attentional biases might be particularly pronounced in anxious individuals as compared with matched non-anxious control subjects (e.g. Fox, 1993, 2002; Mogg et al., 1994). Simi-larly, studies in brain-damaged patients with impaired spatial attention and hemi-neglect have shown that their detection of stimuli in the contralesional visual field is better for emotional pictures (Vuilleumier and Schwartz, 2001a) or emotional faces (Vuilleumier and Schwartz, 2001b; Fox, 2002) than for neutral stimuli with similar visual complexity.
Consistent with these behavioural findings, brain-imaging results in normal volunteers have revealed increased responses to threat-related pictures (e.g. fearful faces) in several areas of visual cortex, in addition to limbic regions such as the amygdala (Vuilleumier et al., 2001; Pessoa et al., 2002). These increases are thought to reflect enhanced attention towards emotional stimuli (Lane et al., 1998; Vuilleumier, 2002). However, the exact time-course and neural bases of attentional orienting towards emotional stimuli has yet to be determined. The current study used evoked potentials and source localiza-tion methods with the aim of identifying electrophysiological correlates of emotional biases in attention on a millisecond scale, and comparing these emotional effects with the results of previous studies manipulating spatial orienting with neutral cues (Clark and Hillyard, 1996; Hillyard and Anllo-Vento, 1998).
A classical paradigm extensively used to examine both behavioural and neurophysiological effects of spatial attention is derived from Posner’s covert orienting task (Posner et al., 1980; Navon and Margalit, 1983), in which a target stimulus is preceded by a brief cue correctly predicting the location of the target (valid cue) or incorrectly predicting another location (invalid cue). Evidence for involuntary, reflexive, exogenous orienting is demonstrated by a facilitation of stimulus processing after valid cues and an interference after invalid cues, typically arising with stimulus onset asynchronies as short as 100 ms post-cue (Jonides, 1981; Egeth and Yantis, 1997). Variants of this paradigm have been used in behavioural (e.g. Fox, 1993; Bradley et al., 1997) and brain-imaging studies (Armony and Dolan, 2002) that have examined emotional influences on spatial attention. Thus, when a peripheral dot-probe is presented randomly in either the right or left visual field, preceded by a brief display with an emotional stimulus at one location and a neutral stimulus at the other location, subjects are quicker and/or more accurate at making judgments on the dot-probe if it appears on the same side as an emotionally
nega-tive stimulus (a ‘valid’ cue), rather than on the opposite side at the location of a neutral stimulus (an ‘invalid’ cue). In other words, visual selection of the probe is facilitated by the emotional value of the preceding visual stimulus, based on the common spatial location. A recent functional magnetic reso-nance imaging (fMRI) study using a similar task (Armony and Dolan, 2002) also demonstrated that target probes presented at the location of neutral face paired with an aversively (sound) conditioned face at another location elicited a stronger activa-tion in fronto-parietal areas implicated in spatial attenactiva-tion in the latter as compared with the former condition, suggesting an involuntary capture of attention by the aversive stimulus that required subsequent reorienting towards the probe at the neutral location.
Variants of Posner’s paradigm have also been used exten-sively in visual event-related potential (VEP) studies of spatial attention but employing simple non-emotional visual stimuli, such as chequerboards or gratings. Very consistent observa-tions have been obtained via such electrophysiological work over the last 20 years (Luck, 1995; Mangun, 1995; Clark and Hillyard, 1996; Eimer, 1998; Luck et al., 2000; Martinez et al., 2001). In many of these VEP studies (see Hillyard and Anllo-Vento, 1998), spatial attention was cued towards one visual field (e.g. endogenously by central cues), while bilateral grating stimuli were presented with a target appearing on the side that was either correctly cued (valid trials, e.g. 70%) or incorrectly cued (invalid trials, e.g. 30%). The typical results indicate that (i) selective spatial attention can produce early effects on the response to peripheral visual stimuli (within 200 ms post-onset); (ii) these effects are mainly manifested on the scalp as an increased amplitude of exogenous visual compo-nents (P1 and N1 waves), with greater responses on valid versus invalid trials (but no changes in latency or topography); (iii) the neural sources of these effects take place in extrastriate visual cortex, presumably corresponding to enhanced sensory processing. Depending on the task, attentional effects on the P1 component can be dissociated from those on the N1, with the latter being less modulated during bilateral than unilateral visual stimulation (Heinze et al., 1990; Luck et al., 1990; Lange et al., 1999) and more sensitive to attentional manipulations demanding feature discrimination rather than detection (Luck et al., 1990; Mangun and Hillyard, 1991; Vogel and Luck, 2000; Hopf et al., 2002). Another consistent finding has been that electrical activity of the primary visual cortex, indexed by the C1 component, does not seem to be involved in spatial atten-tion within this initial time-range of visual responses (Martinez et al., 1999), although primary visual cortex might be modu-lated at a later delay through feedback mechanisms from higher cortical areas (Martinez et al., 1999; Noesselt et al., 2002).
To our knowledge, no VEP study has directly investigated similar neurophysiological indices of attention using threat-related stimuli (e.g. fearful faces) in such a classical paradigm. Previous VEP studies have always presented emotional faces centrally, at an attended location (see Halgren et al., 2000; Campanella et al., 2002; Pizzagalli et al., 2002; Eger et al., 2003), although one study tested for effects of spatial attention on the response to emotional stimuli presented in the peri-pheral visual field (Holmes et al., 2003), and another study presented facial expressions unilaterally in each hemifield to examine hemispheric asymmetries (Pizzagalli et al., 1999). However, no study has directly tested for the effects of
emotional cues on spatial attention. This was the aim of our current study, by using high-density EEG recording and source localization in normal observers during covert spatial orienting in a dot-probe task, where emotional and neutral faces served as valid and invalid cues, respectively.
We used a typical version of this task, adapted from Mogg et al. (1994). On each trial, two faces were briefly presented, one in each visual field, one neutral and one with an emotional expression (fearful or happy). The two faces were then replaced by a small bar-probe at the position just occupied by one of them, oriented either vertically or horizontally (Fig. 1). Partici-pants were asked to judge the bar orientation as quickly as possible. The bar unpredictably appeared on the side of the emotional face (valid condition) or on the side of the neutral face (invalid condition), but importantly, both neutral faces and emotional expressions were entirely irrelevant to the participants’ task. Only short time intervals (100–300 ms) between the face pair and the bar onset were used in order to tap exogenous mechanisms of spatial orienting (Jonides, 1981; Egeth and Yantis, 1997). In comparison with previous behav-ioural studies using emotional dot-probe tasks, we introduced three important methodological changes. (i) The two faces in the pair were always of two different individuals in our para-digm, whereas the majority of previous studies used faces with the same identity but either the same or different expressions. The former design makes it easier to disentangle attentional biases due to image differences or true emotion-specific effects, since emotional expression is the only facial dimension systematically associated with the spatial validity manipulation, rather than other changing or deviant properties of a particular stimulus within the pair. (ii) Both faces and the bar probe were presented in the upper visual field in our study, such that they could elicit a robust C1 component in the EEG, reflecting early V1 activity, i.e. with a negative wave corresponding to retin-otopic responses for the upper field stimulation (Jeffreys and Axford, 1972a,b). Previous studies presented faces on the hori-zontal meridian, which would cancel out the upper and lower field components of C1 and make difficult to differentiate the C1 from the P1. By contrast, the peripheral presentation of our stimuli in upper quadrants enabled us to test whether any effects of attention or emotion would affect the primary visual cortex (Clark et al., 1995). (iii) We opted for a go/no-go matching task in which participants had to judge, on each trial, whether the orientation of the bar probe (in the left or right upper visual field) matched that of a thick line segment within the fixation cross. The task was to press a button only when the bar orientation was the same as the thicker line of the cross (rare go trials), but to withhold responses otherwise (more frequent no-go trials). This task ensured that participants main-tained their gaze on the central fixation cross and that all stimuli were indeed presented in the upper visual field while we recorded VEPs to the face pair and to the bar probe. More-over, the choice of a go/no-go paradigm rather than a simple detection response was backed up by behavioural studies showing that attentional biases towards threat stimuli can persist across a variety of different tasks (see Mogg and Bradley, 1999). A go/no-go detection task was also more appropriate to record VEP uncontaminated by any motor-related activity. Thus, in the current EEG experiment, only VEPs generated on the no-go trials were analysed.
Our hypothesis was that the sensory processing of bar probes should be enhanced when replacing a fearful face, if
spatial attention was involuntarily oriented towards that partic-ular location, as compared with the location of a neutral face. Therefore, we expected that VEPs elicited by the bars should differ as a function of the spatial validity defined by the posi-tion of preceding faces. We had two main predicposi-tions. First, spatial validity should modulate the P1 component previously identified as a marker of selective focusing of attention during bilateral visual stimulation, more than the N1 component that is sensitive to other attentional conditions (Luck et al., 1990; Hopfinger and Mangun, 1998). Secondly, any biases in spatial attention might be either specific, stronger or faster for bars replacing fearful faces, as compared with happy faces, in keeping with behavioural data suggesting greater effects of negative than positive stimuli (see Fox, 2002; Vuilleumier, 2002). In addition, we also determined whether a behavioural effect of validity was obtained in our modified dot-probe para-digm, using a separate control experiment with the same stimuli and the same go/no-go task. Since our EEG experiment required a low number of go trials for VEPs uncontaminated by motor artefacts, and therefore provided few reaction time measures, our behavioural control experiment used a higher probability of orientation matching between the bar and the fixation cross as compared with the EEG experiment. Finally, we established that our attentional effects were truly driven by facial expression rather than low-level pictorial cues in another EEG control experiment using inverted faces.
Materials and Methods
Participants
In the main EEG experiment, participants were 14 right-handed intro-ductory psychology and medicine students (nine female, with a mean age of 22 years, SD 2.5 years) from the University of Geneva. Two participants were excluded from statistical analyses because of exces-sive alpha band in the EEG contaminating the signal by occurring within the same frequency band (∼10 Hz) as the VEPs of interest. Six other students (five female, mean age of 23 years, SD 1.6 years) parti-cipated in an EEG control experiment, and another 16 volunteers (13 female; mean age 23 years, SD 2 years) who did not participate in the EEG experiments took part in the behavioural control experiment. All participants had normal or corrected to normal vision, and were free of neurological or psychiatric history.
Materials
The face stimuli were pairs of grey-scale photographs of ten different individuals (four males and six females), all taken from the stand-ardized Ekman series (Ekman and Friesen, 1976). Each face pair consisted of two different identities with the same gender, one portraying an emotional expression (fearful or happy) and the other a neutral expression. Four pair conditions were used: fear–neutral, neutral–fear, happy–neutral and neutral–happy (Fig. 1). Each emotion expression appeared equally often to the left or right of the neutral expression. Thus, thirty faces (3 emotions × 10 identities) were used, and for each condition 30 pairs were constructed by combining each individual with three other individuals.
Each face stimulus was trimmed to exclude the hair and non-facial contours, and enclosed within a rectangular frame measuring 8 × 10 cm, subtending 6.5° × 8.2° of visual angle at a 70 cm viewing distance (227 × 285 pixels on a 256 grey-level scale). Each face stim-ulus was analysed in Matlab (Fig. 1) to extract the mean pixel lumi-nance, contrast range, surface size occupied by the face and value of central spatial frequency (Nasanen, 1999; Bex and Makous, 2002). Non-parametric analyses of variance on these measures revealed that neutral, fearful and happy faces did not differ in average pixel lumi-nance [Kruskal–Wallis test, H(2) = 2.99, P = 0.22], lumilumi-nance contrast [Kruskal–Wallis test, H(2) = 0.22, P = 0.90], face size [Kruskal–Wallis
test, H(2) = 0.41, P = 0.82] or central spatial frequency [Kruskal–Wallis test, H(2) = 3.91, P = 0.14].
All stimuli were presented on a black background, on a 17 in. computer screen with a PC Pentium 2 running Stim. The vertical position of the screen was adjusted for each subject so that the level of the fixation cross was at the horizontal meridian. A fixation cross meas-uring 2 × 2 cm (thickness 0.1 cm) was presented centrally in the lower part of the computer screen. The faces were presented in the upper visual field at an eccentricity of 4.1°: the distance between the hori-zontal meridian and the outer edge of the face was 5 cm. The faces were equidistant from the vertical meridian, and each face centres were 18 cm apart (14.7°).
The probe was a white rectangular bar (either horizontal or vertical) measuring 6 × 0.4 cm (4.9° × 0.33°). It was presented on either the left or right side of the screen, its centre being 9 cm (lateral) Figure 1. (a) Procedure used in all our EEG and behavioural experiments, showing the sequence of events within a trial. (b) The four different face pair conditions (fear–neutral, neutral–fear, neutral–happy and happy–neutral) that served as exog-enous cues. The spatial distance and coordinates of the face relative to the fixation cross are shown. (c) The mean face images for fearful (left), happy (middle) and neutral (right) conditions as computed by overlapping and averaging all faces with the same expression (n =10). There was no conspicuous difference in low-level properties (e.g. luminance, size and spatial frequency) for the different emotional face conditions, as confirmed by further quantitative analyses (see Materials and Methods).
× 10 cm (above the horizontal meridian) from the position of the fixa-tion cross, at the locafixa-tion previously occupied by one of the faces.
Procedure
Participants were seated in a shielded room in front of the computer screen (viewing distance 70 cm). Behaviour was monitored by closed-circuit television. The experiment consisted of one practice block of 16 trials, followed by nine experimental blocks of 80 trials (total 720 trials). Each block contained 10 presentations of each face condition in each visual field. Each of the 30 face pairs was randomly presented three times. Each emotional face appeared equally often in the left visual field (LVF) and the right visual field (RVF). Moreover, the type of probe (horizontal or vertical) and location of the probe (LVF or RVF) were fully counterbalanced across the experiment, resulting in a 2 (visual field) × 2 (emotion) × 2 (probe type) factorial design. The order of experimental blocks was counterbalanced across subjects.
Each trial began with a fixation cross for 250 ms, followed after a 250 ms delay by a brief presentation of the face pair for 100 ms. Following offset of the face pair, a dark screen was presented randomly for 100, 150, 200, 250 or 300 ms, followed by the rectan-gular bar probe appearing at the location of one of the faces for 150 ms (Fig. 1). Inter-trial interval was 1 s. This range of delays between the face pair and the bar probe was dictated by two reasons. First, using short intervals (as opposed to longer ones) enabled us to test specifically for an exogenous orienting of attention (as opposed to endogenous or deliberate attention effects; for a review, see Egeth and Yantis, 1997). Secondly, using various and randomly chosen delays between the face pair and the bar yielded a stable baseline in the average EEG time-locked to the bar onset, cancelling out mid-latency potentials (occurring from 200 ms post-onset) time-locked to the preceding face pair.
Participants were instructed to press the button of the response box using the index finger of their right hand, only when orientation of the bar presented in the left or right upper visual field matched that of the thicker segment of the fixation cross. On each trial, the thick-ness of one segment within the cross (either the horizontal or vertical line) was slightly increased (from 0.1 to 0.4 cm) at the time of the probe onset, to indicate the relevant orientation. The orientation of the thick line at fixation varied from trial to trial and matched that of the bar (50% horizontal and 50% vertical) in the periphery in 10% of the cases. Only matching trials required a button press (go trials).
In each block, 8 go trials (4 face conditions × 2 probe locations) and 72 no-go trials (4 face conditions × 2 probe locations × 9 repetitions) were randomly presented. Participants were instructed to focus their gaze on the relatively small fixation cross and to concurrently monitor the orientation of the peripheral bar. Reaction time (RT) was recorded from bar onset. Thus, our stimulus parameters and task requirements ensured that participants maintained fixation on the cross throughout the experiment, and oriented covertly to the bar probes presented in the upper right or upper left visual field. In this situation, any system-atic eye movement towards the side with the fearful face is unlikely given the task to perform as well as the duration and sequence of visual events.
In the behavioural experiment, stimuli and task settings were the same as in the EEG experiment. The only difference was an increase in the number of go trials (50% instead of 10%). The behavioural experiment consisted of one practice block of 20 trials, followed by six experimental blocks of 80 trials (total 480 trials). In each block, 40 go trials (4 face conditions × 2 probe locations × 5 repetitions) were randomly presented with 40 no-go trials (4 face conditions × 2 probe locations × 5 repetitions).
Data Acquisition
VEPs were recorded and processed using a Neuroscan 64 channel device (Synamps). Horizontal and vertical EOGs were monitored using four facial bipolar electrodes placed on the outer canthi of the eyes and in the inferior and superior areas of the left orbit. Scalp EEG was recorded from 62 Ag/AgCl electrodes mounted in a quickcap (extended 10–20 System) with a linked-mastoids reference, amplified with a gain of 30 K and bandpass filtered at 0.01–100 Hz with a 50 Hz notch filter. Impedance was kept below 5 kΩ. EEG and EOG were continuously acquired at a rate of 500 Hz and stored for off-line
aver-aging. EEG was corrected for eye blinks by the subtraction of PCA-transformed EOG components for each electrode, weighted according to VEOG propagation factors. After removal of EEG and EOG artefacts (epochs with EEG or EOG exceeding 70 µV were excluded from the averaging), epoching was made 100 ms prior to visual stimulus onset and for 350 ms after stimulus presentation. Data were low-pass filtered at 30 Hz.
Data Analysis
We only reported and analysed VEP components for no-go trials, uncontaminated by any motor-related activities. Amplitudes of the most prominent VEP components with a posterior topography were quantified in terms of mean voltage within a specified latency window (centred on the component’s peak), with respect to a 100 ms pre-stimulus baseline. Latency analyses of these VEP components are not reported because no significant time shifts were produced by the main factors manipulated in this experiment (Visual Field, Emotion and Validity); or when latency differences were observed, they could always be explained by a concomitant amplitude effect.
Three clear-cut VEP components time-locked to bar onset were first identified and analysed: the occipito-parietal C1 (Clark et al., 1995) peaking at the midline electrode POZ in the 80–100 ms time window, the lateral occipital P1 (Luck et al., 1990) and the N1 components (Vogel and Luck, 2000). P1 (120–150 ms) was maximal at lateral posterior electrodes PO7/PO5 in the left hemisphere and PO8/PO6 in the right hemisphere. N1 (200–250 ms) was maximal at more medial posterior leads, PO5/PO3 in the left hemisphere and PO6/PO4 in the right hemisphere. For each component, these sites were selected on the basis of related effects in previous studies (for a recent overview, see Di Russo et al., 2003). For each emotion and each side of presen-tation, we analysed the significance of spatial validity effects by comparing the mean amplitude of each component evoked by a bar replacing the emotional versus neutral face of the pair. We were therefore able to compare amplitude changes of the VEP generated by the same physical stimulus according to the preceding facial context. Validity effects were evaluated by repeated-measures analyses of vari-ance (ANOVAs) with three within-subject factors: Visual Field, Emotion and Validity.
Three exogenous VEP components time-locked to face pair onset were also analysed: the occipito-parietal C1 (Clark et al., 1995) peaking at the midline electrode POZ, the lateral occipital P1 (Luck et al., 1990), and the occipito-temporal N170 components (Bentin et al., 1996). The N170 (160–180 ms), as expected, was maximal at CP5/TP7 in the left hemisphere and CP6/TP8 in the right hemisphere. For each component and each side of presentation, we analysed the effect of emotional valence by comparing the mean amplitude in the happy versus fear condition. Valence effects were evaluated by a 2 (Visual Field) × 2 (Emotion) within-subject ANOVA. Student’s paired t-tests were also computed as post hoc analyses.
Finally, for each emotion, we examined the relationship between the amplitude of C1 (as recorded at the reference electrode POZ) time-locked to the face pair and the validity effect (amplitude differ-ence between valid and invalid trials) for the P1 evoked by the subse-quent bar (recorded at electrodes PO5/PO7 and PO6/PO8), using a measure of correlation (Pearson correlation coefficient).
Source Localization
Low-resolution brain electromagnetic tomography (LORETA, version 3, Pascual-Marqui et al., 1994), an inverse solution method, was used to estimate the putative neural sources of electrical brain activity recorded at the level of the scalp. LORETA is a modified weighted minimal norm solution that searches for the smoothest distribution by minimizing the norm of the Laplacian of the current vectors. LORETA refers to a three-shell spherical model registered to the Talairach human brain atlas (Talairach and Tournoux, 1988). The source loca-tions were therefore given as (x,y,z) coordinates (x from left to right; y from posterior to anterior; z from inferior to superior), after being corrected by the MNI to Talairach transformation (Brett et al., 2002) since the head model used in LORETA corresponds to the digitized MNI template. LORETA solutions were calculated within a regular grid of 1152 nodes, lying within the upper hemisphere of a sphere. Compared to dipole solutions, LORETA has the advantage to estimate
the underlying generators without any a priori assumption on the number and locations of the sources. The calculation of all reconstruc-tion parameters was based on the computed common average refer-ence. LORETA units are scaled to amperes per square meter (A/m2).
Results
Behavioural Performance in the Control Experiment
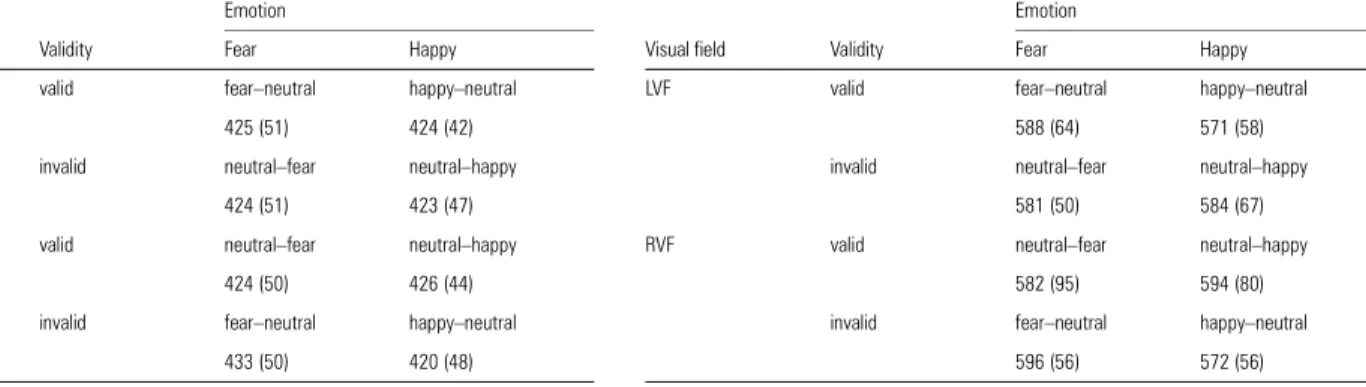
Despite the modified parameters compared with previous behavioural experiments (e.g. Mogg and Bradley, 1999), we found that our version of the dot-probe task produced signifi-cant effects on spatial attention. Both accuracy and RT meas-ures indicated that participants were generally better at detecting the orientation of a bar replacing a fearful face than a happy face. These effects were larger in the RVF than LVF.
Thus, RTs (on go trials) revealed a spatial validity effect specific to fear, but restricted to the RVF (Table 1), with slower responses on invalid (433 ms) than valid trials (424 ms) following a fearful face [t(15) = 1.8, P = 0.05], whereas valid trials (426 ms) were not faster than invalid trials (420 ms) following a happy face [t(15) = 0.79, P = 0.22]. A repeated-measures ANOVA with two within-subject factors (Validity and Emotion) confirmed a significant interaction between these two factors [F(1,15) = 5.39, P = 0.04]. Main effects of Validity [F(1,15) = 0.08, P = 0.78] and Emotion [F(1,15) = 2.57, P = 0.13] were not significant.
To evaluate accuracy quantitatively (i.e. misses on go trials and false alarms on no-go trials), we calculated a discrimination measure (d′) using the signal detection theory (Green and Swets, 1966). Higher d′ values indicate that the signal (compared to the noise) is more salient and more easily recog-nized. Based on this measure of sensitivity to signal (d′), our participants were found to discriminate the orientation of the bar significantly better when it replaced a fearful face, rather than a neutral or a happy face (Fig. 2). This was confirmed by statistical analyses on d′. The 2 (Visual Field) × 2 (Validity) × 2 (Emotion) ANOVA revealed a significant effect of validity [F(1,15) = 4.84, P = 0.04], a significant effect of emotion [F(1,15) = 13.45, P = 0.002], and a significant Visual Field × Validity interaction [F(1,15) = 5.88, P = 0.03]. In the LVF, Validity interacted with Emotion [F(1,15) = 6.21, P = 0.03], indicating a higher d′ on valid (4.40, SD 0.36) than invalid trials (4.28, SD 0.41) specifically in the fear condition. In the happy condition, d′ on valid trials (4.14, SD 0.39) was not different from invalid trials (4.29, SD 0.32). In the RVF, both Validity
[F(1,15) = 9.57, P = 0.007] and Emotion [F(1,15) = 9.29, P = 0.008] produced main effects but did not interact [F(1,15) = 0.62, P = 0.45]. Post-hoc tests on the RVF responses showed that performance on valid trials (4.44, SD 0.21) was significantly better than invalid trials (4.27, SD 0.54) following a fearful face, and a similar effect was observed following a happy face (valid: 4.29, SD 0.41; invalid: 3.95, SD 0.40). However, when pooling d′ values from LVF and RVF together (Fig. 2), valid trials in the fear condition were significantly better than valid trials in the happy condition [t(15) = 3.2, P = 0.006].
In sum, these behavioural data confirm an advantage when participants discriminated the orientation of a bar-probe that appeared at the same location as an emotional face, particularly after a fearful expression, suggesting that a reliable facilitation in processing the bar-probe was induced by the preceding facial context in our modified paradigm.
Behavioural Performance in the EEG Experiment
We also calculated the mean RT as well as the percentage of misses and false alarms during EEG recordings (Table 2), although we did not expect reliable differences given the small number of go trials (maximum of nine deviant RTs in each condition and each participant). Indeed there was no signifi-cant RT effects across conditions [all F(1,11) < 1, P = NS]. The number of false alarms (<0.3% in all conditions) and misses (<5% in all conditions) was very low and similar across all trial types [all F(1,11) < 1, P = NS], indicating that participants could match accurately the orientation of the peripheral bar-probe with that of the fixation stimulus in all experimental condi-tions.
Table 1
Results (mean RTs ± SD) in the behavioural control experiment (n = 16) Emotion
Visual field Validity Fear Happy
LVF valid fear–neutral happy–neutral
425 (51) 424 (42)
invalid neutral–fear neutral–happy
424 (51) 423 (47)
RVF valid neutral–fear neutral–happy
424 (50) 426 (44)
invalid fear–neutral happy–neutral
433 (50) 420 (48)
Figure 2. Mean d′ values (± SE) for the four conditions in the control behavioural experiment (n = 16 participants).
Table 2
Behavioural results (mean RTs ± SD) in the main EEG experiment (n = 12) Emotion
Visual field Validity Fear Happy
LVF valid fear–neutral happy–neutral
588 (64) 571 (58)
invalid neutral–fear neutral–happy
581 (50) 584 (67)
RVF valid neutral–fear neutral–happy
582 (95) 594 (80)
invalid fear–neutral happy–neutral
VEP Waveforms Time-locked to the Onset of the Line Bar
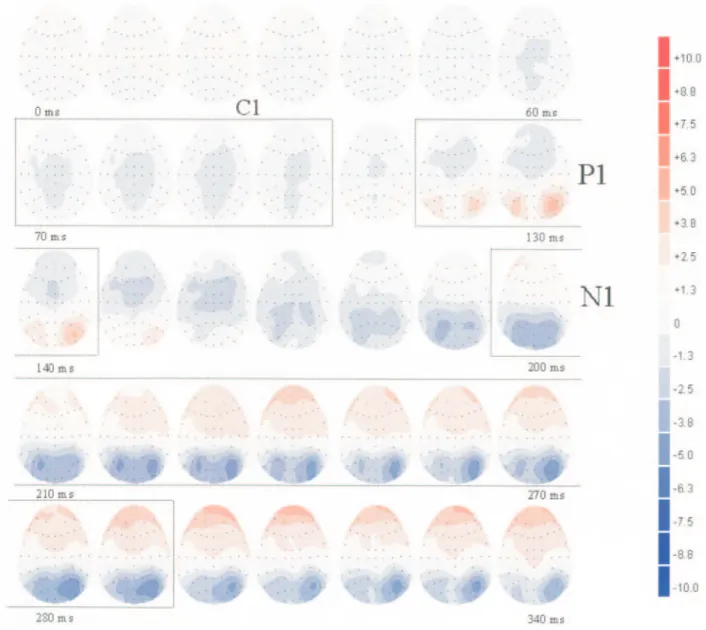
The main goal of our study was to examine the effect of the different face pairs on the potentials evoked by a subsequent unilateral bar-probe (Fig. 3). We obtained two important results (Fig. 4 and Table 3). First, there was a clear difference in VEPs to the bar following fearful and happy faces, with validity effects that were obvious for the former but not the latter. Secondly, these spatial validity effects in the fear condition mainly concerned the lateral occipital P1 component, which was consistently larger for valid than invalid trials, irrespective of the side of presentation of the bar-probe. No validity effect was observed for the preceding C1 or subsequent N1 compo-nents. These effects were confirmed by statistical analyses on each of these VEP components.
The 2 (visual field) × 2 (validity) × 2 (emotion) ANOVA performed on the mean amplitude of the C1 component recorded at POZ (Table 3) did not reveal any significant effect of visual field, validity or emotion [all F(1,11) < 2, P = NS].
The 2 (Visual Field) × 2 (Validity) × 2 (Emotion) × 2 (Hemi-sphere) × 2 (Electrode Position) ANOVA performed on the mean amplitude of the lateral occipital P1 component (mean latency 135.7 ms), measured at two pairs of electrodes (PO7/ PO5 in the left hemisphere and PO8/PO6 in the right hemi-sphere), disclosed a significant interaction of Validity × Emotion [F(1,11) = 14.5, P = 0.03]. This indicated that the amplitude of P1 was larger for valid trials (3.58 µV) than invalid trials (2.8µV) in the fear condition only, irrespective of the side of the bar (Fig. 4; Table 3). Mean amplitude of the P1 was 3.25 µV for both valid and invalid trials in the happy condition. In the fear condition, the validity effect was significant at three out of four posterior electrodes [PO7, t(11) = 3.2, P = 0.008; PO6, t(11) = 2.2, P = 0.05; PO8, t(11) = 3.08, P = 0.01]. In the happy condition, this validity effect was absent at all four electrodes [all t(11) < 0.2].
The ANOVA also disclosed a significant Visual Field × Hemi-sphere × Electrode Position interaction [F(1,11) = 6.56, P = 0.03]. Figure 3. Horizontal voltage maps in the fear valid condition from bar-probe onset (0 ms) until 340 ms post-stimulus onset. Each map is for 10 ms. Distinct C1, P1 and N1 compo-nents were clearly defined.
This interaction indicated that the P1 was larger in the right hemisphere than left hemisphere, a difference that was maximum at the lateral electrode PO8 for bars presented in the left visual field.
The 2 (Visual Field) × 2 (Validity) × 2 (Emotion) × 2 (Hemi-sphere) × 2 (Electrode Position) ANOVA performed on the mean amplitude of the occipital N1 component (mean latency 249.3 ms), measured at two pairs of electrodes (PO5/PO3 in
the left hemisphere and PO6/PO4 in the right hemisphere), did not reveal any significant effect of Validity or Emotion (Table 3).
VEP Waveforms Time-locked to the Onset of the Face Pair
Although our main goal was to study the modulation of responses to the bar probes (see previous section), we also examined amplitude differences in VEPs from the 0–200 ms time range following onset of the face pair (i.e. before presen-Figure 4. (a) Grand averaged waveforms evoked by the bar-probes at electrode PO8, for valid versus invalid trials in the fear condition. The horizontal scalp topography correspond-ing to the P1 in the fear valid condition is presented (i.e. voltage map computed in the 130–140 ms time interval). The amplitude scale goes from –10 µV (blue) to +10 µV (red). (b) No such effect is seen for valid versus invalid trials in the happy face condition. Similar validity effects on the P1 following fearful but not happy faces were observed at PO7 on the opposite hemisphere (see Fig. 7a,c). (c) LORETA solution in the 120–140 ms time-interval for the P1 component (all conditions pooled together) time-locked to bar-probe onset. This solution is superimposed on three horizontal slices (from –13 mm below the AC-PC line to 1 mm above this line) of a normalized human brain. (d) Same Loreta solution super-imposed on a 3D computerized human brain (lateral view of the left hemisphere).
Table 3
Mean amplitude in µV (± SD) of the three occipital components (C1–P1–N1) time-locked to bar-probes onset recorded in the main EEG experiment (n = 12). LVF and RVF presentations are pooled together
Emotion Validity Components
C1 P1 N1
POZ PO7 PO5 PO6 PO8 PO5 PO3 PO4 PO6
Happy valid –2.4 (0.9) 2.6 (1.9) 2.6 (1.9) 3.7 (2.6) 4.0 (2.8) –6.7 (3.7) –7.0 (3.3) –7.5 (3.2) –7.3 (3.2)
invalid –2.4 (1.2) 2.6 (1.7) 2.7 (1.7) 3.7 (2.3) 4.1 (2.5) –6.7 (4.1) –6.7 (3.4) –6.7 (2.9) –6.5 (2.9)
Fear valid –2.6 (1.2) 3.0 (2.3) 2.8 (2.0) 4.1 (2.5) 4.3 (2.9) –6.8 (4.1) –6.5 (3.6) –7.0 (3.9) –6.7 (3.6)
tation of the bar), in order to assess any effects of facial expres-sion itself.
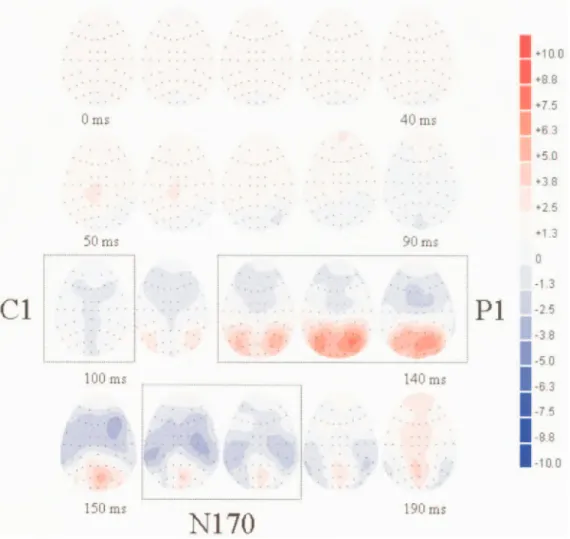
We identified three clear successive VEP components (Fig. 5): an occipito-parietal C1 maximal at POZ; a lateral occip-ital P1 maximal at PO7/PO8; and an occipito-temporal N170 maximal at CP5/CP6. The topography of the N170 was slightly more anterior compared with previous reports concerning this face-sensitive component (Bentin et al., 1996; George et al., 1996), but our bilateral presentation in the upper visual field (as opposed to a single central face stimulus) may explain this difference. The amplitudes of P1 (mean latency 135.2 ms) and N170 (mean latency 169.2 ms) components time-locked to the onset of the face pair were similar across conditions and did not vary according to the valence or side of emotional faces. However, around 90 ms post-stimulus onset, fearful faces elic-ited a higher C1 component (as measured on the reference electrode POZ) than happy faces, irrespective of the side of presentation (Fig. 6).
The 2 (Visual Field) × 2 (Emotion) ANOVA performed on the mean amplitude of the C1 (mean latency 90.6 ms) at POZ confirmed a significant effect of Emotion [F(1,11) = 7.18, P = 0.02], indicating a greater negative occipito-parietal C1 response to the fear condition (–2.32 µV) than the happy condition (–1.87 µV). This effect was not modulated by the side of
pres-entation [F(1,11) = 1.60, P = 0.232], and remained significant when two supplementary neighbouring electrodes (PO3 in the left hemisphere and PO4 in the right hemisphere) were added in the analysis of variance [F(1,11) = 4.85, P = 0.05]. Nine subjects out of 12 showed this effect on the C1 component.
By contrast, the 2 (Visual Field) × 2 (Emotion) × 2 (Hemi-sphere) × 2 (Electrode Position) ANOVA on the mean ampli-tude of the P1 component, measured at two pairs of electrodes (PO7/PO5 in left hemisphere and PO8/PO6 in right hemi-sphere), did not disclose any significant effect of visual field, emotion, or interaction between these two factors [all F(1,11) < 2, P = NS].
Finally, the 2 (Visual Field) × 2 (Emotion) × 2 (Hemisphere) × 2 (Electrode Position) ANOVA on the mean amplitude of the occipito-temporal N170 component, measured at two pairs of electrodes (TP7/CP5 in the left hemisphere and TP8/CP6 in the right hemisphere), showed no effect of Emotion [all F(1,11) < 2, P = NS]. However, there was a significant Hemisphere × Elec-trode Position interaction [F(1,11) = 6.57, P = 0.03], indicating that the N170 was greater at CP6 than TP8 in the right hemi-sphere [t(11) = 2.23, P = 0.05] but not different between CP5 and TP7 in the left hemisphere [t(11) = 1.01, P = 0.34]. This interaction reflected the fact that the N170 was generally larger and more localized in the right than left hemisphere.
Figure 5. Horizontal voltage maps in the fear condition from face-pair onset (0 ms) until 190 ms post-stimulus onset. Each map is for 10 ms. Distinct C1, P1 and N170 components were clearly visible.
Correlation Analysis
To examine whether the early effect of fearful faces on C1 responses might be related to the subsequently enhanced processing of bar-probes presented on the same side, we performed a correlation analysis (using the Pearson coefficient, two-tailed) between the amplitude of the C1, time-locked to the onset of the faces, and the validity effect of the P1, time-locked to the onset of the bar. The C1 amplitude was measured at POZ, and the P1 amplitude difference between valid and invalid trials was averaged at PO7/PO5 in the left hemisphere and PO8/PO6 in the right hemisphere.
This analysis revealed a significant positive correlation in the fear condition (Fig. 6d), but restricted to the left hemisphere (r = 0.70, P = 0.01). There was no significant correlation in the right hemisphere (r = 0.20, P = 0.54). There was no significant correlation between the amplitude of the C1 and the P1 validity effect with happy faces in either hemisphere (left, r = 0.46, P = 0.14; right, r = 0.14, P = 0.66). In addition, a direct comparison of the C1–P1 correlations for each emotion condi-tion (Tabachnik and Fidell, 2000) showed a significant differ-ence [t(11) = 2.08, P = 0.03] due to a better fit with a linear
regression function between C1 and P1 in the fear condition (mean of residuals 0.48) than in the happy condition (mean of residuals 0.83) for the left hemisphere response. In the right hemisphere, this comparison was not significant [t(11) = 0.58, P = 0.29].
Taken together, these correlation data suggest that, even though the time interval between the two stimuli varied randomly, the larger the C1 response to a fearful face in the peripheral visual field, the larger the subsequent validity effect on the occipital P1 evoked by a bar-probe appearing at the same location (Fig. 6d). However, this correlation was signifi-cant only for electrodes in the left hemisphere and we consider it as a tentative result, suggesting a possible functional relation-ship between the magnitude of responses to faces and the enhanced processing of bar-probes on valid trials.
Control EEG Experiment with Inverted Faces
Since our data suggested that fearful faces can produce very early effects in the VEPs and enhance a C1 component thought to reflect the initial feedforward response in primary visual cortex (Noesselt et al., 2002), we wanted to establish that Figure 6. (a) Grand averaged waveforms evoked by face pairs at electrode POZ, for fearful versus happy trials. The horizontal scalp topography corresponding to the C1 in the fear condition is presented (i.e. voltage map computed in the 90–100 ms time interval). The amplitude scale goes from –10 µV (blue) to +10 µV (red). (b) LORETA solution in the 80–100 ms time-interval for the C1 component (all conditions pooled together) time-locked to face-pair onset. This solution is superimposed on a 3D computerized human brain (lateral view of the left hemisphere). (c) The same Loreta solution is superimposed on three horizontal slices (from –6 mm below the AC-PC line to 8 mm above this line) of a normalized human brain. (d) Scatterplot in the fear condition for the correlation between C1 (time-locked to face pair and recorded at POz) and P1 spatial validity effect (time-locked to bar probe and recorded at PO7 and PO5 in the left hemisphere). The regression equation is displayed on the chart.
these effects were truly driven by facial expression rather than low-level pictorial cues. A quantitative pixelwise analysis of our face stimuli (see Materials and Methods) showed no significant differences in the mean luminance, contrast, surface or spatial frequency content between fearful, happy and neutral faces. However, we double-checked this issue by repeating our main EEG experiment using inverted faces (i.e. the two faces of the pair were rotated 180°) with a new group of six participants, while all other parameters remained the same. These inverted faces contain exactly the same visual features but convey perceptually less distinctive information about emotional expression (Searcy and Bartlett, 1996).
Unlike in our EEG experiment with upright faces, there was no valence effect on the C1 in this control experiment when examining the VEPs time-locked to the face pair [F(1,5) = 0.23, P = 0.66]. For all six subjects there was a clear negative C1 component at POZ but it was not increased for fear (mean amplitude –2.8 µV) versus happy faces (mean amplitude –2.6µV), whereas it was found in 9 out of 12 subjects in the previous experiment with upright faces (χ2 = 6.25, P = 0.01). Moreover, the P1 component time-locked to the bar-probe (Fig. 7 and Table 4) showed no significant effect of spatial
validity following either fearful or happy faces [Validity, F(1,5) = 0.11, P = 0.75; Validity × Emotion, F(1,5) = 0.23, P = 0.65]. Therefore, inversion of the faces can not only impair the explicit recognition of emotional expression in faces (Searcy and Bartlett, 1996), but also suppress the more involuntary emotional effects on attentional orienting that were indexed by the P1 component in response to a subsequent bar-probe. These results confirm that our results for both C1 and P1 above were genuinely driven by emotional information in faces, rather than just pictorial cues.
Source Localization
We used source localization by LORETA (Figs 4 and 6; Table 5) to determine the likely generators of the main surface compo-nents identified above (C1, P1, N1 and N170). Source esti-mation was performed on a 20 ms time range (10 time samples) centred on the maximum amplitude of each component from the grand average waveforms (all conditions pooled together). For the C1 component time-locked to the onset of the face pair, a cluster of sources was found in two regions of the primary visual cortex, namely the cuneus and lingual gyrus (Fig. 6 and Table 5). Likewise, estimation performed on the C1
Figure 7. (a, b) Grand averaged waveforms at electrode PO7 for valid versus invalid trials in the fear condition when faces are in the upright orientation (a, n = 12) and when faces are inverted (b, n = 6). (c, d) Grand averaged waveforms at electrode PO7 for valid versus invalid trials in the happy condition when faces are in the upright orientation (c, n = 12) and when faces are inverted (d, n = 6). The horizontal scalp topographies corresponding to the P1 are presented (i.e. voltage map computed in the 130–140 ms time interval). The amplitude scale goes from –10 µV (blue) to +10 µV (red).
component time-locked to the onset of the bar probe revealed similar generators, with a main cluster of sources slightly more lateralized that peaked in the middle occipital gyrus of the right hemisphere. At 14 mm from this maximum, LORETA esti-mation also identified a source falling in the primary visual cortex (–10x, –95y, –13z) in the medial occipital lobe (Brod-mann area 17), contributing to the C1 response. These sources accord entirely with previous reports on the neural generators of this early visual component (see Clark et al., 1995; Di Russo et al., 2001, 2003).
Source estimations performed on the P1 revealed different foci, all localized within extrastriate visual cortex (Fig. 4 and Table 5), mainly in occipito-temporal regions (middle occipital gyrus and inferior temporal gyrus). Sources corresponding to the P1 component time-locked to the face pair were stronger in the right than left hemisphere, whereas this pattern was reversed for sources corresponding to the P1 component time-locked to bar onset.
Finally, LORETA identified maximal sources in the inferior temporal gyrus for the scalp potential corresponding to the N170 component evoked by faces, and in the angular gyrus for the N1 component time-locked to the onset of the bar (Table 5). Overall, this pattern is fully consistent with previous attempts to localize the neural generators of the P1, N1 and N170 components in other VEP studies (Heinze et al., 1994; Clark and Hillyard, 1996; Mangun et al., 1997; Shibata et al., 2002; Pizzagalli et al., 2002).
Discussion
Based on the idea that threat-related stimuli may capture atten-tion in an involuntary and exogenous way (Öhman et al., 1999), we recorded EEG in normal viewers to examine on a millisecond basis the temporal dynamic of spatial attention in a covert orienting paradigm (Mangun, 1995; Rugg and Coles, 1996). Exogenous cueing was systematically manipulated using brief bilateral display with an emotional face (fearful or happy) in one visual field and a neutral face in the other visual field. Exogenous spatial orienting towards fear-related stimuli has been demonstrated in previous behavioural studies (Bradley et al., 1997) by facilitated detection of targets appearing at the same location as a fear-related stimulus, in comparison with targets appearing on the opposite side. This facilitation is similar to the spatial validity effect observed in classical studies of covert orienting using simple visual cues, such as sudden flashes, or endogenous orienting by instructed strategies (Hill-yard and Anllo-Vento, 1998). These behavioural effects suggest that an involuntary spatial orienting of attention towards the location of a threat stimulus may enhance the processing of subsequent visual inputs at the same location, and contribute to the mobilization of cerebral and somatic resources allowing the organism to cope with biologically important events (Halgren and Marinkovic, 1995).
Our study adapted this classical behavioural paradigm to determine the electrophysiological correlates of attentional orienting elicited by fearful faces. Our bar-probes were physi-cally similar across conditions and presented at a non-predic-tive location in either the left or right upper visual field. Nevertheless, our VEP results showed that neural responses to a bar-probe were enhanced when the preceding face pair displayed a fearful stimulus at the same location. These VEP effects were demonstrated by a greater amplitude of the lateral occipital P1 component on valid versus invalid trials. This increased P1 response to the bar-probes was independent of the side of the fearful face or the side of the bar, but occurred specifically when the bar replaced the location of a fearful face. Furthermore, such an exogenous spatial validity effect was not found following happy faces, as shown by a significant validity × emotion interaction on the mean amplitude of P1. These results suggest a dissociation between fearful versus happy faces in their capability to capture spatial attention in an exog-enous way.
Behaviourally, these attentional effects led to an improved discrimination of the bar orientation, as demonstrated by higher d′ values on valid than invalid trials. Thus, our partici-Table 4
Mean amplitude in µV (± SD) of the three occipital components (C1–P1–N1) time-locked to bar-probes onset recorded in the control EEG experiment (n = 6). LVF and RVF presentations are pooled together
Emotion Validity Components
C1 P1 N1
POZ PO7 PO5 PO6 PO8 P05 PO3 PO4 PO6
Happy valid –2.5 (1.9) 2.9 (1.8) 3.2 (2.1) 2.6 (1.8) 1.8 (1.1) –6.9 (2.5) –5.7 (2.8) –6.8 (3.6) –7.6 (2.7)
invalid –2.6 (1.8) 2.8 (2.5) 3.1 (3.0) 2.1 (1.9) 1.8 (1.0) –6.3 (2.5) –5.4 (3.3) –6.2 (4.6) –6.9 (3.1)
Fear valid –2.4 (2.1) 3.0 (3.2) 3.1 (4.0) 2.2 (2.6) 1.6 (1.2) –7.1 (2.1) –5.7 (3.0) –6.9 (3.9) –7.6 (2.8)
invalid –2.3 (1.7) 3.1 (2.6) 3.1 (3.4) 2.1 (3.1) 1.9 (1.8) –6.6 (2.6) –5.5 (3.1) –6.5 (3.5) –7.1 (2.5)
Table 5
Solutions provided by LORETA for three successive visual components (C1–P1–N1). For each solution, the coordinates of the maximal source and corresponding brain region are provided as well as the localization of the other cortical sources that are close (<5 mm) to the maximum Stimulus Components x, y, z Close regions
(d < 5 mm)
Brodmann area
Face pair C1 (80–100) 4, –81, 1 lingual gyrus 18
cuneus 17
P1 (120–140) 32, –88, 1 middle occipital gyrus 18, 19 N170 (160–180) 53, –74, –6 inferior temporal gyrus 19, 37
inferior occipital gyrus 18
Bar probe C1 (80–100) 32, –88, 1 middle occipital gyrus 18, 19 P1 (120–140) –52, –67, –6 inferior temporal gyrus 19, 37 N1 (200–250) –45, –74, 29 angular gyrus 39
pants were more accurate at judging the bar orientation when it replaced a fearful face than a neutral face in both visual fields, and this spatial validity effect was significantly greater for fearful than happy faces. Spatial validity effects were also observed in RTs, with faster responses to bars following a fearful face, but not following a happy face, although such RT effects were restricted to the right visual field. The latter asym-metry contrasts with previous behavioural studies that found a greater RT facilitation in the left visual field (Mogg and Bradley, 1999; Fox, 2002), in agreement with a right hemisphere domi-nance in processing emotions, especially when negative (Borod et al., 2002). However, such hemispheric asymmetries are not always reliably observed in healthy individuals, and a role of the left hemisphere in the control of attention towards negative stimuli has already been reported (e.g. Anderson and Phelps, 2001; Phelps et al., 2001). Further work is needed to clarify whether differences in the design and stimuli between our study and earlier behavioural experiments (Mogg and Bradley, 1999; Fox, 2002) may account for this discrepancy in the RT pattern. Moreover, whereas our d′ analyses clearly indi-cated a better discrimination of the bar probe on valid trials following a fearful face, consistent with a facilitation in spatial attention and enhanced sensory processing, the RT data from our control experiment (Table 1) suggested that participants were particularly slower on invalid trials rather than faster on valid trials, consistent with the recent proposal that emotional stimuli might produce a difficulty in disengaging attention from their location (Fox et al., 2001), rather than just a facilita-tion in orienting there (Mogg and Bradley, 1999; Mogg et al., 2000). Further research seems required to explore this apparent dissociation between RT and accuracy measures.
Altogether, our data are therefore consistent with the view that the brain may have specific mechanisms to respond effi-ciently to fear-related stimuli and prioritize attention to them (see LeDoux, 1996; Öhman et al., 1999; Vuilleumier, 2002). Fear signals from faces may constitute a highly relevant stim-ulus since they alert the observer to the presence of a potential threat. Such findings are also consistent with appraisal theories of emotion, according to which relevant affective information can be detected during a rapid and coarse evaluation of the stimulus, in order to elicit appropriate behavioural responses (see Scherer et al., 2001; Sander et al., 2003).
Spatial Validity Effect on the P1 Component
Our validity effect on P1 is very similar to that repeatedly reported in ERP studies of endogenous spatial attention using classical Posner paradigms (Clark and Hillyard, 1996). In these studies, valid trials (targets appearing at a location indicated by a visual cue) typically generate a larger P1 component (and sometimes a larger N1 component) compared with invalid trials (targets appearing at the opposite spatial position). Simi-larly, exogenous spatial orienting by non-predictive cues can produce a selective enhancement of the P1 responses to targets on valid trials, whereas N1 is not affected by exogenous cues (Hopfinger and Mangun, 1998). Thus, the P1 component, unlike the N1, primarily reflects a reflexive mechanism. In our study, we observed a comparable amplitude modulation of the P1 component in a design where the location of the target stim-ulus (bar-probes) was completely non-predictive. Only a task-irrelevant emotional face within a bilateral stimulus pair defined validity. Our results therefore indicate that a fearful face, like an abrupt luminance change, may control the
alloca-tion of attenalloca-tion by involuntary spatial orienting mechanisms. Moreover, since we used short time intervals (<300 ms) between the cue (faces) and the target (bar), our spatial validity effect is likely to correspond to a process characterized as exogenous, rather than endogenously driven (see Egeth and Yantis, 1997). In addition, the time intervals between the face pair and the bar probe were randomised and unpredictable (between 100 and 300 ms), a manipulation further supporting the role of exogenous factors in spatial attention.
The likely generator of our lateral occipital P1 component was confirmed using a distributed source model (LORETA) performed on the corresponding time-range, without any a priori assumption on the number and locations of generators. These source data suggested an origin of P1 in extrastriate visual areas, mainly in lateral occipital and inferior temporal cortex. This is highly consistent with previous attempts to localize the neural generators of this early occipital compo-nent, using different mathematical algorithms (Clark et al., 1995; Di Russo et al., 2003). These data further suggest that the facilitation of processing for targets presented at the location of fearful faces in our paradigm arose from neural mechanisms that correspond at least partly to those implicated in spatial attention in other traditional orienting paradigms.
Our results converge with the recent event-related fMRI study (Armony and Dolan, 2002) that examined covert orienting of spatial attention in a dot-probe task during a fear conditioning procedure. In this study, a face pair was presented bilaterally, one being aversively conditioned by previous pairing with sound bursts and the other unconditioned, followed by a target probe replacing one or the other face. Trials where spatial attention was covertly biased towards the side of the fear-conditioned face produced an increased activation of frontal and parietal regions implicated in spatial attention, as well as activation in amygdala and orbitofrontal cortex. Our results extend these findings by providing new information about the temporal dynamic of exogenous orienting to fear-related stimuli, and confirm the similarity with mechanisms of exog-enous spatial orienting in other situations. A greater amplitude of P1 activity in extrastriate visual cortex in response to emotional cues also extend the related findings by Stormark and collaborators (Stormark et al., 1995) who used emotion words (rather than facial expressions) and found enhanced P1 and P3 components for invalid trials, but with a longer time interval between the cue and the target (i.e. 600 ms) as compared with the present study.
Valence Effect on the C1 Component
Unexpectedly, our results also demonstrate that the C1 time-locked to the onset of the face pair was significantly modulated by emotional expression: the C1 had a higher amplitude for displays with a fearful face than a happy face. This valence effect was restricted to the early C1 response and not observed for the subsequent P1 or N170 component elicited by faces. Whereas a lack of emotional effects on P1 and N170 responses to faces is consistent with previous studies (e.g. Campanella et al., 2002; Holmes et al., 2003), an effect of fear on the C1 has not yet been reported. However, a previous MEG study (Halgren et al., 2000) did report a short latency (∼100 ms) occipital response located near the calcarine fissure distinguishing happy from sad faces.
The polarity, latency, amplitude and topography of this C1 component are compatible with those found in previous
studies of visual attention (Clark et al., 1995), and LORETA source localization performed on the time-range corresponding to our C1 confirmed a cluster of sources in the primary visual cortex, as previously suggested for this early retinotopic component (Clark et al., 1995). Our bilateral presentation of faces in the upper visual field concurrently with a fixation cross at the centre of the screen might account for the fact that the C1 was slightly later in our study (peaking at 90 ms) compared with the latency found in earlier reports (e.g. 50–80 ms, Jeffreys and Axford, 1972a,b; Butler et al., 1987; Aine et al., 1995). However, the time-range of C1 in our study is very similar to that reported in other recent studies with simple unilateral stimuli (see Di Russo et al., 2001, 2003 for a direct comparison). Therefore, we conclude that our findings of an effect of fearful faces on early VEPs can be convincingly ascribed to the modulation of a genuine C1 responses arising from primary visual cortex. Furthermore, a control experiment repeated with the same procedure but inverted faces found no effects of fear on the C1 responses to faces, or on the P1 responses to bar-probes replacing a fearful face on valid trials. This converges with the pixelwise quantitative analysis of our face stimuli showing no physical differences between pictures of fearful versus other faces, and reinforces our conclusion that the early enhancement of VEPs with fearful faces was due to emotional significance rather than other low-level pictorial properties.
In contrast, previous electrophysiological studies did not find any modulation of the striate C1 component by traditional manipulation of spatial attention using endogenous cueing or unstructured, meaningless exogenous cues (Hillyard and Anllo-Vento, 1998; Luck et al., 2000). In these studies, the C1 ampli-tude for valid or attended trials was similar to that for invalid or unattended trials. Likewise, in the current paradigm we did not find any modulation of this component in response to the bar-probes, as a function of the preceding facial context. Only the P1 but not the C1 evoked by the bar appeared enhanced by the spatial shift of attention induced by a preceding fearful face (as for spatial shifts in other traditional paradigms). Therefore, this early C1 response to a fearful face might reflect a very rapid differential activation of the primary visual cortex due to the emotional valence of the face, possibly due to an interaction with other brain regions responsible for detecting potential threat signals in the display. In keeping with this, previous fMRI studies in humans have shown increased activation of visual cortex for fearful compared to neutral or happy faces, including in V1 (Vuilleumier et al., 2001; Pessoa et al., 2002). These brain-imaging data add to earlier reports showing that directing visual attention towards a stimulus position can increase neural activity in several retinotopic regions of visual cortex, including V1 (e.g. Tootell et al., 1998). Moreover, anatomical studies in primates have shown that V1 and other visual areas receive strong projections from the amygdala (Amaral et al., 2003), a structure that is critically involved in fear processing and may receive direct inputs from subcortical pathways partly independent of striate cortex (LeDoux, 1996; Morris et al., 1999; Vuilleumier et al., 2003). Rapid projections from amygdala (or other limbic regions) might act to enhance and/or sustain visual responses of primary visual cortex to fear-related stimuli, and thus account for an early modulation of the C1 component.
Interestingly, our results also showed that the amplitude of the C1 component elicited by fearful faces was positively
correlated with the magnitude of the validity effect on the lateral occipital P1 component that was subsequently elicited by the bar-probe, although this correlation was significant only over the posterior left hemisphere. This might suggest an important functional significance of this enhancement of C1 by fearful faces, leading to a subsequent facilitation of processing for the probes presented at the same location. Moreover, here again, a dissociation was noted between threat-related versus positive stimuli since this correlation was significant in the fear condition only. It is not clear why the C1–P1 correlation was found for the left but not the right occipital P1, even though our VEP results indicated a significant spatial validity effect on P1 amplitude for both hemispheres. Further work is required to establish whether this asymmetry might relate to the larger RT effect that was observed behaviourally in the RVF.
An early response to fearful faces, arising around 120 ms post-stimulus onset, was also observed at frontal sites in recent studies using EEG recordings over the scalp (Holmes et al., 2003) or depth electrodes (Kawasaki et al., 2001). In these studies, faces were presented centrally or at positions aligned on the meridians, such that any early retinotopic effect in the C1 component could not be seen. By contrast, in our paradigm all stimuli where presented in the upper visual field. None-theless, early frontal responses would be consistent with some information about a face stimulus (e.g. emotional expression) being available quickly post-onset (i.e. before 100 ms; Seeck et al., 1997; Halgren et al., 2000; Braeutigam et al., 2001; Liu et al., 2002; Eger et al., 2003; see Thorpe et al., 1996 with objects), and then influencing subsequent stages of processing through feedback interactions (Damasio, 1989). A similar scheme is thought to mediate mechanisms of spatial attention, with rapid responses in some frontal and parietal areas that can then send signals back to primary visual cortex in order to guide further stimulus processing in the ventral visual stream (Bullier, 2001). However, attentional feedback from fronto-parietal may occur later than emotional influences (Martinez et al., 1999; Noesselt et al., 2002), since C1 is usually not modu-lated by endogenous or exogenous spatial attention. Alto-gether, these data suggest that emotional signals may produce specific effects on visual processing, as reflected by an early enhancement of the C1 response to fearful faces, whereas other effects on subsequent orienting towards the location of an emotional stimulus appear shared with traditional effects of spatial attention, as produced by other non-emotional cues, and reflected by a similar enhancement of P1 responses to the target probes.
Conclusions
In summary, our study provides direct evidence that fearful faces elicit an involuntary orienting of spatial attention towards their location, with the time-course of this process being rapid, modulating an early exogenous VEP in the P1 component, and presumably arising from neural sources in the extrastriate visual cortex. These effects of fear on P1 are very similar to those induced by other traditional manipulations of spatial attention. Further research is needed to test whether compa-rable effects can be elicited in the VEPs by non-face stimuli signalling threat (e.g. conditioned stimuli, snakes, spiders or other aversive pictures) and whether these effects would be generalized to other kinds of signals that are highly relevant for the organism (see Sander et al., 2003), such as ambiguous