Plant Ecology
VolumE 8, NumbEr 5, PagEs 549–557 oCTobEr 2015 doi:10.1093/jpe/rtu043 advance access publication 18 December 2014 available online at www.jpe.oxfordjournals.org© The Author 2014. Published by Oxford University Press on behalf of the Institute of Botany, Chinese Academy of Sciences and the Botanical Society of China. All rights reserved. For permissions, please email: journals.permissions@oup.com
selection in monoculture vs.
mixture alters plant metabolic
fingerprints
Debra Zuppinger-Dingley
1,*
, Dan F. B. Flynn
1,2, Helmut Brandl
1and Bernhard Schmid
11 Institute of Evolutionary Biology and Environmental Studies, University of Zurich, Winterthurerstrasse 190, CH-8057
Zurich, Switzerland
2 The Arnold Arboretum of Harvard University, 1300 Centre Street, Boston, MA 02131, USA
*Correspondence address. Institute of Evolutionary Biology and Environmental Studies, University of Zurich, Winterthurerstrasse 190, CH-8057 Zurich, Switzerland. Tel: +41-(0)44-635-49-99; Fax: +41 (0)44 635 57 11; E-mail: debra.zuppinger@ieu.uzh.ch
Abstract
AimsIn grassland biodiversity experiments, positive biodiversity effects on primary productivity increase over time. recent research has shown that differential selection in monoculture and mixed-species communities leads to the rapid emergence of monoculture and mix-ture types, adapted to their own biotic community. We used eight plant species selected for 8 years in such a biodiversity experiment to test if monoculture and mixture types differed in metabolic pro-files using infrared spectroscopy.
Methods
Fourier transform infrared spectroscopy (FTIr) was used to assess metabolic fingerprints of leaf samples of 10 individuals of each spe-cies from either monocultures or mixtures. The FTIr spectra were analyzed using multivariate procedures to assess (i) whether indi-viduals within species could be correctly assigned to monoculture or mixture history based on the spectra alone and (ii) which parts of
the spectra drive the group assignment, i.e. which metabolic groups were subject to differential selection in monocultures vs. mixtures. Important Findings
Plant individuals within each of the eight species could be classified as either from monoculture or mixture selection history based on their FTIr spectra. Different metabolic groups were differentially selected in the different species; some of them may be related to defense of patho-gens accumulating more strongly in monocultures than in mixtures. The rapid selection of the monoculture and mixture types within the eight study species could have been due to a sorting-out process based on large initial genetic or epigenetic variation within the species. Keywords: biodiversity, plant evolution, selection, FTIr spectroscopy, metabolic fingerprint
received: 15 october 2014, revised: 9 December 2014, accepted: 11 December 2014
INTroDuCTIoN
Greater biodiversity in plant communities positively affects productivity and this effect can increase over time (Reich et al.
2012; Tilman et al. 2006). Positive biodiversity effects on
pro-ductivity are often interpreted in terms of more complemen-tary resource uptake (HilleRisLambers et al. 2004; Schnitzer et al. 2011; Tilman et al. 2001) as plants separate along envi-ronmental niche axes (Silvertown 2004). Additionally, plant–soil feedbacks may contribute to positive biodiversity effects on productivity by regulating plant species coexistence in plant communities (Bever 1994, 2003; Mills et al. 1998;
Petermann et al. 2008), leading to lower productivity at the
lower end of the biodiversity gradient (Kulmatiski et al. 2012;
Schnitzer et al. 2011). Given that there is variation in
popula-tions in ability to survive and reproduce over a range of spe-cies richness levels, it can be deduced that selection processes may occur in monocultures and mixed-species communities, which result in plant types adapted to each type of commu-nity. Recent work has demonstrated that plants can become adapted to the diversity of the community in which they grow
(Lipowsky et al. 2011). Furthermore, a glasshouse study has
shown that selection processes can drive biodiversity effects, as reflected by cultivation of offspring derived from field mon-ocultures (monoculture types) or mixtures (mixture types)
(Zuppinger-Dingley et al. 2014).
These recent findings indicate the potential for plant adap-tation to the biotic environment and, consequently, should be reflected in phenotypic differences among the selected mono-culture and mixture types. We propose the novel hypothesis of selection for plant types adapted to biodiversity to explain increases in biodiversity effects over time (Zuppinger-Dingley et al. 2014). In the present study, we assessed metabolic fin-gerprints of leaf tissues with Fourier transform infrared spec-troscopy (FTIR) as an indication of phenotypic differences between monoculture and mixture types in eight grassland species that had been growing for 8 years in monoculture or mixed-species communities in a large grassland biodiversity experiment in Jena, Germany. We refer to the two types of communities as selection history.
Previously FTIR spectroscopy has been used extensively to investigate biochemical and molecular responses of algae to changes in environmental conditions (Giordano et al. 2001, 2007) as such fingerprints give an indication of the macromolecular composition of cells (Wagner et al. 2014). Although this technique has rarely been used in plant com-munity ecology (Gidman et al. 2003), FTIR fingerprinting has been used successfully to differentiate between plant genera
(Gorgulu et al. 2007; Kim et al. 2004), to detect endophytic
fungal infections in grasses (Brandl 2013), to identify major alterations in biochemical pathways of mutant collections
(Sardans et al. 2011) and to determine metabolic alterations
within species subjected to changes in environmental condi-tions (Domenighini and Giordano 2009; Gidman et al. 2003;
Harmanescu et al. 2012; Jones et al. 2012; Lazar et al. 2012;
Scherling et al. 2010). Plant individuals have been shown to
adapt to the local biotic environment in a study focusing on plant traits across the experimental plant species richness gra-dient of the above-mentioned Jena Experiment (Lipowsky et al. 2011). The phenotypic changes in response to the local biotic environment could have been due to genetic, epigenetic or maternal effects (Roach and Wulff 1987; Rossiter 1996). FTIR is a promising tool to determine phenotypic changes at the level of plant biochemistry. Such changes in biochemical pathways should be linked to underlying genetic or epigenetic alterations (Fiehn 2002).
FTIR produces a biochemical signature of a selected sample
(Fiehn 2001; Johnson et al. 2003) providing a snapshot of the
biochemical composition of a cell (Domenighini and Giordano 2009). This metabolic fingerprint can be used to discriminate not only between species but also between genotypes within species (Schulz and Baranska 2007). Furthermore, because absorption peaks in FTIR spectra are due to the particular chemical bonds making up materials (Ammann and Brandl 2011), there is the possibility to assign peaks to specific groups of compounds such as nucleic acids, lipids or carbohydrates
(Griffiths and de Haseth 1986).
We tested whether metabolic changes occurred in response to selection history of either monoculture or mixture diversity over 8 years in the Jena Experiment, Germany, using the dis-tinct biochemical fingerprints produced by FTIR spectroscopy.
Differences in the FTIR spectra between monoculture types or mixture types could be used as an indication of phenotypic differences via alterations in biochemical composition of the leaf samples. Furthermore, we tested whether specific wave-number regions drove the differences between monoculture and mixture types within species.
mETHoDs
The Jena Experiment was our source of plants from commu-nities with a selection history of either monocultures (mono-culture types) or mixtures (mixture types) in the field. This experiment was established in 2002 at a field site in Jena, Germany (50°55′N, 11°35′E, 130 m a.s.l.), using 60 com-mon Central European grassland species. Sown plant species richness ranged from 1 to 60 species per plot (see Roscher et al. 2004 for details). We chose 8 of the 60 species based on their occurrence both in plots of monocultures or mix-tures for 8 years in the Jena Experiment to test if meta-bolic changes (changes in biochemical composition) had occurred in response to selection in monocultures vs. mix-tures. Two species from each of four plant functional groups were chosen: grasses (Festuca pratensis, Poa pratensis), legumes (Onobrychis viciifolia, Trifolium repens), tall herbs (Crepis biennis, Galium mollugo) and small herbs (Plantago lanceolata, Prunella vulgaris). We collected plant cuttings from the experimental plots in Jena in April 2010 and replanted them into pots with GVZ Tref GO PP 7000 (BF4; GVZ; De Baat, Holland) sub-stratum under glasshouse conditions to acclimatize them to the new environment before transplanting them into plots in our experimental garden at the University of Zurich with the same species combinations as found in the original Jena plots. We propagated the plant material as cuttings of cuttings so that the material used in the study was not directly taken from the field.
Using a JASCO 4200-FTIR instrument (Brechbühler AG, Schlieren, Switzerland) in attenuated total reflection (ATR) mode with an ATR accessory equipped with a zinc selenide (ZnSe) prism, we measured metabolic fingerprints. Whole mature leaf samples were randomly taken from plant indi-viduals of the study species and placed onto the ATR accessory and spectra were collected (Hsu 1997). For each leaf sample, an average of 50 scans were taken with a resolution of 4 cm−1 using the ZnSe prism and saved for further chemometrical analyses. We used a measurement range of 650–4000 cm−1. For each study species, leaf samples were taken from 10 indi-viduals derived from 10 cuttings of different plants selected in monocultures and the same number was taken from individu-als derived from plants selected in mixtures. Raw spectral data were processed with JASCO Spectra Manager 2.02.02. Each spectrum was adjusted using baseline correction (linear), ATR correction, smoothing (Savitzky–Golay, width = 15; Susi and
Byler 1983, truncation (1900–650 cm−1) and normalization
(highest value = 1, lowest value = 0)). As mentioned in many biological studies (e.g. Kim et al. 2004), post-measurement
data treatment is needed to compare spectra and minimize inconsistencies, in particular when applying second deriva-tives of spectra. Baseline correction eliminates baseline drifts, smoothing reduces noise and normalization is applied to cor-rect spectra regarding peak heights because these depend on the pressure applied by the device and might vary between different samples.
Linear discriminant analysis (LDA; Ripley 1994) was used to calculate classification functions and assign leaf samples to their respective selection history (monocultures vs. mix-tures) in a single analysis of all species (R, version 2.15.3, R Development Core Team 2013). Canonical variate analysis
(Hotelling 1936) was used to estimate multivariate intergroup
distances for each species with the Mahalanobis D2 distance measure (with GenStat version 16, VSN International Ltd). We used stepwise multiple regression (Hocking 1976) to deter-mine the selected wavenumber regions that drove the differ-ences between monoculture and mixture types for all species in a single analysis (R, version 2.15.3, R Development Core Team 2013). Multidimensional scaling (MDS), a multivari-ate method for data visualization of hidden relations among objects in data (Borg and Groenen 2005), in the form non-metric multidimensional scaling (NMDS), was applied on the combined spectral range to determine dissimilarities among samples between each selection history (‘Q-mode’ analysis) for each individual species and in a single analysis of all spe-cies (R, version 2.15.3, R Development Core Team 2013). Low stress values in NMDS analysis reflect a good fitting solution with a high degree of correspondence between the observed inter-object distances and the distances predicted by the dis-similarities. The correlation between fitted values and ordina-tion distances was very close (R2 = 0.99 for both linear and non-metric fit), with stress values ranging from 0.013 to 0.079. More detailed analyses were done in the following spectral regions broadly assigned to four groups of compounds: Aromatic = 650–910 cm–1 (Hsu 1997)
Carbohydrate = 750–1200 cm–1 (Ami et al. 2013) Protein = 1500–1700 cm–1 (Amiali et al. 2011) Lignin = 1590–1610 cm–1 (Allison 2011).
Information on peak assignments when investigating biomass derived from cyanobacteria or plants has been published ear-lier (see Gorgulu et al. 2007; Kansiz et al. 1999). We focused on these spectral regions to determine if specific wavenum-ber regions could be associated with monoculture or mixture selection history. Applying the two orthogonal ordination axes from the NMDS analysis of all species with selection his-tory as binary response variable in generalized mixed models
(Breslow and Clayton 1993; Wolfinger and O'Connell 1993;
GenStat, version 16, VSN International Ltd), we tested if plants selected in either monoculture or mixture communities over 8 years showed distinct metabolic fingerprints. The results, calculated for the full range of wavenumbers (‘Fingerprint’) and for the four specific regions listed above, were summa-rized in analyses of variance tables. Significance tests were
based on approximate F-tests using appropriate error terms and denominator degrees of freedom. The fixed terms in the models were selection history (monocultures vs. mixtures), species and the interaction between these. Species and plant sample were used as random terms.
The second derivative of the corrected spectra, allowing for band narrowing and therefore distinguishing more fea-tures, was then calculated (Savitzky–Golay, width = 15; Susi
and Byler 1983). Hierarchical cluster analysis, using the
com-plete linkage method with Euclidean distance (Everitt 1974;
Hartigan 1975; R, version 2.15.3, R Development Core Team
2013), was used to determine which samples were most alike and therefore would cluster together and how well these clus-ters represented the selection history of the species.
rEsulTs
Selection history clearly altered the metabolic fingerprints of the species in our study. The matrix produced using LDA showed that plant individuals were 99% correctly classified as belonging to either monoculture or mixture selection his-tory (Table 1). Two of the species, P. lanceolata and P. pratensis, accounted for the 1% failures in the assignment of individu-als to monoculture or mixture selection history. Using spe-cific wavenumber regions related to proteins, carbohydrates or aromatics (Fig. 1), we obtained similar levels of accuracy, i.e. 99% correct assignment to monoculture or mixture selec-tion history. Only the wavenumber region associated with lignin (Fig. 1; online supplementary Table S1) assigned a lower number of individuals correctly to the respective selec-tion history. Certain specific wavenumbers with significantly different absorption between monoculture and mixture plant types could tentatively be associated with specific biochemical compounds (Table 2).
Additional evidence for a shift in metabolic fingerprints with selection history was provided by the separate analyses for each species using Mahalanobis distances for the four wavenumber groups mentioned above, showing that the maximum distance was always between plant individuals from different selection histories (Table 3; online supplementary Figure S1). The great-est distance between the two selection histories was found across all wavenumbers combined or in the protein ber region in P. vulgaris; in the aromatic and lignin wavenum-ber regions, T. repens and O. viciifolia, respectively, showed the greatest distance between monoculture and mixture types. In the carbohydrate wavenumber region, G. mollugo showed the greatest distance between the two selection histories.
NMDS ordinations based on Euclidean distance dissimilari-ties calculated between the 20 individuals of each of the eight species showed that individuals with monoculture selection history were clearly separated from individuals with mix-ture selection history in the ordination plots for each of the eight species (Fig. 2). Stress values of <0.075 indicate a high degree of correspondence between the observed inter-object distances and the distances predicted by the dissimilarities.
T
able 1:
LDA matrix of a single analysis of eight grassland species, using absorbance values in the range of wavenumbers from 650 to 1900 cm
–1 derived from
FTIR spectroscopy Species
History Crepis biennis Festuca pratensis Galium mollugo Onobrychis viciifolia Plantago lanceolata Poa pratensis Prunella vulgaris Trifolium repens Mixture Monoculture Mixture Monoculture Mixture Monoculture Mixture Monoculture Mixture Monoculture Mixture Monoculture Mixture Monoculture Mixture Monoculture C. biennis Mixture 9 1 0 0 0 0 0 0 0 0 0 0 0 0 0 0 Monoculture 1 9 0 0 0 0 0 0 0 0 0 0 0 0 0 0 F. pratensis Mixture 0 0 10 0 0 0 0 0 0 0 0 0 0 0 0 0 Monoculture 0 0 0 10 0 0 0 0 0 0 0 0 0 0 0 0 G. mollugo Mixture 0 0 0 0 10 0 0 0 0 0 0 0 0 0 0 0 Monoculture 0 0 0 0 0 10 0 0 0 0 0 0 0 0 0 0 O. viciifolia Mixture 0 0 0 0 0 0 10 0 0 0 0 0 0 0 0 0 Monoculture 0 0 0 0 0 0 0 10 0 0 0 0 0 0 0 0 P. lanceolata Mixture 0 0 0 0 0 0 0 0 10 0 0 0 0 0 0 0 Monoculture 0 0 0 0 0 0 0 0 0 10 0 0 0 0 0 0 P. pratensis Mixture 0 0 0 0 0 0 0 0 0 0 10 0 0 0 0 0 Monoculture 0 0 0 0 0 0 0 0 0 0 1 9 0 0 0 0 P. vulgaris Mixture 0 0 0 0 0 0 0 0 0 0 0 0 10 0 0 0 Monoculture 0 0 0 0 0 0 0 0 0 0 0 0 0 10 0 0 T. repens Mixture 0 0 0 0 0 0 0 0 0 0 0 0 0 0 10 0 Monoculture 0 0 0 0 0 0 0 0 0 0 0 0 0 0 0 10
Mixed effects models using the combined data set of all eight species (Table 4) showed that all species differed significantly in their FTIR spectra (P < 0.001). Differences between mono-culture and mixture selection history were in part common to all species (significant main effects of selection history,
Table 4) but additionally highly species specific (significant
interactions, Table 4). These results show that 8 years of selec-tion in monocultures vs. mixtures has led to clearly differ-entiated metabolic fingerprints in the eight studied grassland species.
Finally, cluster analysis on the second derivative of spectra for each species again clearly differentiated between monocul-ture types and mixmonocul-ture types for most species, with individu-als of common selection history generally clustering together
(Fig. 3; online supplementary Figure S2). Monoculture types
clustered strongly into single groups for the two tall herbs G. mollugo and C. biennis as well as for the two legumes O. vicii-folia and T. repens. In contrast, mixture types clustered strongly for the two grasses F. pratensis and P. pratensis. The small herb P. vulgaris showed the weakest separation between monocul-ture and mixmonocul-ture types, whereas the other small herb P. lan-ceolata showed stronger clustering for monoculture history.
DIsCussIoN
We determined metabolic alterations occurring after 8 years of selection in plant communities of monocultures or mixed-species diversity in the Jena Experiment, Germany. These met-abolic alterations show that plants with different biochemical features have been selected in monoculture vs. mixed-species communities. Currently, we cannot say whether the response to selection was based on different plant genotypes occurring
in the populations of the study species or if the phenotypic differences reflect differential epigenetic or maternal carryo-ver effects. Independent of the mechanisms, it also appeared that selection was stronger in monocultures than in mixtures because clustering of spectra was tighter among plant individu-als with monoculture than with mixture selection history. This may have been related to larger population sizes in experimen-tal plots harboring only one rather than several species or to stronger selection pressures exerted, e.g. by pathogen accumu-lation in monocultures (Magarey 1999; Petermann et al. 2008). Similar alterations in metabolic responses of vascular plants to environmental conditions have been reported in other studies. FTIR spectroscopy identified metabolic differences in tomato fruits from plants that were grown either under nor-mal conditions or subject to salinity stress (Johnson et al. 2003;
Smith et al. 2003). Additionally, tomato plants showed
meta-bolic alterations of leaf tissue in response to nitrogen nutrition under two different light intensities (Urbanczyk-Wochniak
and Fernie 2005). In grassland plants, alterations in metabolic
fingerprints have been observed in response to different types of fertilizer (Harmanescu et al. 2012). Metabolic fingerprints can also reflect biotic interactions, as the effects of grazing on the grass Deschampsia flexuosa could be detected using FTIR
(Jones et al. 2012). The above studies mainly reflect plastic
responses of genotypes to growth in different environments, whereas in our study, the metabolic changes reflect differ-ences among plants with different selection history but grown in a common environment. This indicates that the described changes are heritable although this heritability may be due to genetic or epigenetic differences or to persistent maternal car-ryover effects. Recently, evidence for variation in metabolic patterns associated with species richness was found for three plant species, Lotus corniculatus, Bellis perennis and Leontodon autumnalis, after 6 years in the Jena Experiment in plots of 1, 2, 4, 8, 16 and 60 species (Scherling et al. 2010). Although in this case the plants were observed in situ in the different biotic environments and differences could therefore have been purely plastic, these results are consistent with our find-ings. Thus, for those three species, it is conceivable that the responses reflected more than plastic adjustments of individ-ual genotypes, namely selection of different genotypes in the different environments.
Genetically caused differences in FTIR fingerprints have been reported between Arabidopsis thaliana mutants and wild-types (Fiehn 2002) and in the same species, metabolomics have been used to differentiate genotypes (Macel et al. 2010). In a study with Acantholimon, Astragalus and Ranunculus spe-cies, not only were clusters representing the three genera produced using FTIR fingerprints of their leaves but also such fingerprints differentiated subgroups of species accord-ing to the source geographical regions (Gorgulu et al. 2007). Similarly, in a field study using the Douglas fir, Pseudotsuga menziesii, a strong signal environmental variation could be shown in metabolite profiling despite a weak signal of genetic variation (Robinson et al. 2007).
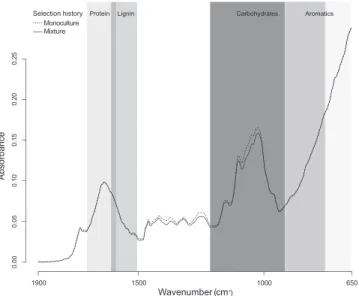
xn 0.00 0.05 0. 10 0. 15 0. 20 0. 25 Wavenumber (cm - 1 ) 1900 1500 1000 650 Mi ture Selection history r Mo ocultu e Aromatics Carbohydrates Lignin Protein Absorbanc e
Figure 1: mean FTIR spectra wavenumber of eight European grass-land species selected in monocultures or mixtures (n = 80 each) over 8 years in a biodiversity experiment in Jena, Germany, showing the variation in the metabolic fingerprint between monoculture and mix-ture selection history.
Although we tentatively assigned compounds to the wave-numbers significantly contributing to variation between the two selection histories of monocultures vs. mixtures, further
studies are needed to identify specific compounds underlying the possible adaptations to the specific biotic environments. Furthermore, despite hypothesizing that the differences we
Table 2: the most significant wavenumbers (P < 0.001 without correction for multiple testing) in the range 650–1900 cm−1 differentiating
plant individuals from monoculture vs. mixture selection history in a single analysis of eight grassland species using FTIR, with biochemical compounds tentatively assigned to these wavenumbers (Baseri and Baker 2011; Coates 2000; Movasaghi et al. 2008; Stuart 1996)
Wave number (cm–1) Difference in absorbance values Standard error of difference t-Value Compound
756 −4.31 1.24 −3.47 Aliphatic chloro
804 3.40 0.95 3.60 Left-handed helix DNA
814 −3.70 1.06 −3.48 Epoxy and oxirane rings
872 2.77 0.76 3.65 Epoxy and oxirane rings
881 −4.91 1.07 −4.60 Epoxy and oxirane rings
1016 −5.22 1.39 −3.76 Glycogen 1026 7.58 2.21 3.43 Glycogen 1036 −6.04 1.38 −4.39 Glycogen 1065 5.29 1.40 3.79 Protein amide I 1084 8.44 2.30 3.67 Protein amide I 1257 −11.68 3.18 −3.68 Phospholipids 1267 13.90 3.49 3.98 Phospholipids 1277 −12.00 3.16 −3.80 Phospholipids 1315 −4.99 1.23 −4.05 Aromatic amine 1325 12.21 2.04 5.99 Aromatic amine 1335 −12.82 2.51 −5.11 Polysaccharides, pectin
1431 −9.85 2.50 −3.93 Methylene, methyl groups
1450 10.03 1.71 5.87 Methylene 1460 −4.99 1.15 −4.35 Benzene ring 1489 −10.06 2.32 −4.33 Amide II 1566 17.61 3.80 4.63 Aromatic ring 1576 −13.95 3.53 −3.95 Adenine 1662 16.89 4.50 3.75 Alkenyl (lipids) 1720 −5.15 1.25 −4.10 Ester group
1730 12.25 2.01 6.10 Fatty acid ester
1740 −18.05 3.36 −5.37 Aliphatic ester
1749 15.63 3.18 4.92 Aliphatic ester
1759 −7.68 1.90 −4.03 Alkyl carbonate
1884 −4.54 0.61 −7.50 Carbonyl
1894 4.09 0.57 7.12 Carbonyl
Table 3: maximum Mahalanobis (D2) distance between individuals selected in monocultures vs. mixtures in a biodiversity experiment
in Jena, Germany Species Crepis biennis Festuca pratensis Galium mollugo Onobrychis viciifolia Plantago lanceolata Poa pratensis Prunella vulgaris Trifolium repens FTIR wavenumber (cm−1) 650–1900 17.88 7.81 33.19 17.92 20.34 7.60 26.58 17.88 650–910 4.98 8.42 9.08 13.24 4.88 3.94 8.88 23.42 750–1200 10.01 7.40 33.19 17.92 4.88 3.29 18.36 4.68 1500–1700 5.41 9.88 8.31 14.63 14.63 7.60 23.38 1.82 1590–1610 2.59 5.29 6.10 17.98 2.63 5.61 5.79 3.71
The eight species were analyzed separately using canonical variate analysis with absorbance values from FTIR spectra for wavenumbers in the regions assigned to aromatics (650–910 cm–1), carbohydrates (750–1200 cm–1), proteins (1500–1700 cm–1) and lignins (1590–1610 cm–1).
Table 4: results of mixed effects ANOVA for plants selected in monocultures vs. mixtures over 8 years in a biodiversity experiment in Jena, Germany
Fixed term numDf denDf
Fingerprint Aromatics Carbohydrates Proteins Lignin
F P F P F P F P F P MDS1 Species (Sp) 7 72 94.36 <0.001 118.27 <0.001 56.04 <0.001 174.70 <0.001 56.04 <0.001 Selection history (SH) 1 72 10.97 0.001 0.02 0.879 11.73 0.001 0.69 0.407 11.73 0.001 Sp × SH 7 72 9.83 <0.001 2.89 0.010 8.91 <0.001 11.25 <0.001 8.91 <0.001 MDS2 Species (Sp) 7 72 90.50 <0.001 35.31 <0.001 185.72 <0.001 142.56 <0.001 185.72 <0.001 Selection history (SH) 1 72 3.53 0.064 1.13 0.291 3.33 0.072 2.50 0.118 3.33 0.072 Sp × SH 7 72 6.27 <0.001 8.66 <0.001 0.83 0.564 25.54 <0.001 0.83 0.564
MDS axes (‘MDS1’, ‘MDS2’) calculated from FTIR absorbance values using NMDS analysis were used as dependent variables. Abbreviations: denDf = degrees of freedom of error term, F statistic = variance ratio, numDf = degrees of freedom of term, P = significance level. Significant effects highlighted in bold.
-0.4 -0.2 0.0 0.2 -0.3 -0.1 0. 1 0. 3 NMDS 2
Festuca pratensis Stress = 0.032
-0.2 0.0 0.2 0.4 0.6
-0.4
-0.2
0.
0
Poa pratensis Stress = 0.03
-1.0 -0.5 0.0 0.5
-0.6
-0.2
0.
2
Plantago lanceolata Stress = 0.013
-0.2 -0.1 0.0 0.1 0.2 -0.1 50 .0 00 .1 0
Prunella vulgaris Stress = 0.079
-0.3 -0.1 0.0 0.1 0.2 -0.2 0. 00 .1 0. 2 NMDS1 NMDS 2
Crepis biennis Stress = 0.061
-0.4 -0.2 0.0 0.2 0.4 0.6 -0.2 0. 00 .2 0. 4 NMDS1
Galium mollugo Stress = 0.073
-0.6 -0.4 -0.2 0.0 0.2 -0.3 -0.1 0. 10 .3 NMDS1
Onobrychis viciifolia Stress = 0.073
-0.2 -0.1 0.0 0.1 0.2 0.3 -0.2 0-0.05 0.10 NMDS1
Trifolium repens Stress = 0.044 Monoculture
Mixture Selection History
Figure 2: NMDS ordination plot based on Euclidean distance dissimilarities of FTIR spectra of leaves from individuals for each of eight central European grassland species selected in monocultures or mixtures over 8 years in a biodiversity experiment in Jena, Germany.
observed may be due to epigenetic or maternal effects, we suggest that they are more likely based on differential selec-tion of genotypes. As our study species were all perennials with rare establishment of new plants from seeds, the result implies that the original plant material used to establish the Jena Experiment contained a large amount of standing genetic (or epigenetic) variation from which preadapted gen-otypes (or epigenetic variants) could be selected by a sorting process. Together with the occasional recombination event during sexual reproduction and subsequent seedling recruit-ment, this would then have allowed for the rapid evolution of monoculture and mixture types.
An important selection factor in monocultures could have been negative plant–soil feedbacks. Soil organisms affect
plant performance (Bever et al. 1997) and plant associations with the soil microbial community via plant–soil feedback mechanisms can alter soil community composition (Kardol et al. 2007; van der Putten 1997). Because such plant–soil and plant–plant interactions are considered key for the maintenance of species diversity in grassland ecosystems
(Petermann et al. 2008), we suggest that the observed
dif-ferences in biochemical composition between monoculture and mixture types may have resulted from co-evolution of the plants with soil biota.
We demonstrated that alterations in biochemical composition can change the metabolic fingerprint of eight species selected in monocultures or in mixtures over 8 years. Plant individuals within each of the eight species could be classified as either from
monoculture or from mixture selection history based on their FTIR spectra, indicating that within such communities, there may be selection for different biochemical features.
suPPlEmENTarY maTErIal
Supplementary material is available at Journal of Plant Ecology online.
FuNDINg
Swiss National Science Foundation (130720 to B.S.).
aCKNoWlEDgEmENTs
We thank Daniel Trujillo Villegas, Leigh Oesch, Theres Zwimpfer, Matthias Furler, René Husi, the gardeners of the Jena Experiment and student helpers for technical assistance.
Conflict of interest statement. None declared.
rEFErENCEs
Allison GG (2011) Application of Fourier transform mid-infrared spectroscopy (FTIR) for research into biomass feed-stocks. In Kikolic G (ed). New Analytical Approaches and FTIR Strategies. Rijeka, Croatia: InTech, 71–88.
Ami D, Mereghetti P, Doglia SM (2013) Multivariate analysis for Fourier transform infrared spectra of complex biological sys-tems and processes. In: de Freitas V and de Freitas APBR (eds.).
Multivariate analysis in management engineering and the sciences. Rijeka,
Croatia: InTech, 189–220.
Amiali NM, Golding GR, Sedman J, et al. (2011) Rapid identification of community-associated methicillin-resistant Staphylococcus aureus
by Fourier transform infrared spectroscopy. Diagn Microbiol Infect
Dis 70:157–66.
Ammann AB, Brandl H (2011) Detection and differentiation of bacte-rial spores in a mineral matrix by Fourier transform infrared spec-troscopy (FTIR) and chemometrical data treatment. BMC Biophys 4:14.
Baseri MK, Baker S (2011) Identification of cellular components of medicinal plants using FTIR. Rom J Biophys 21:277–84.
Bever JD (1994) Feedback between plants and their soil communities in an old field community. Ecology 75:1965–77.
Bever JD (2003) Soil community feedback and the coexistence of competitors: conceptual frameworks and empirical tests. New
Phytol 157:465–73.
Bever JD, Westover KM, Antonovics J (1997) Incorporating the soil community into plant population dynamics: the utility of the feed-back approach. J Ecol 85:561–73.
Borg I, Groenen PJF (2005) Modern Multidimensional Scaling: Theory
and Applications. New York: Springer.
Brandl H (2013) Detection of fungal infection in Lolium
per-enne by Fourier transform infrared spectroscopy. J Plant Ecol 6:
265–9.
Breslow NE, Clayton DG (1993) Approximate inference in general-ized linear mixed models. J Am Stat Assoc 88:9–25.
Coates J (2000) Interpretation of infrared spectra, a practical approach. In Meyers RA (ed). Encyclopedia of Analytical Chemistry. Chichester: John Wiley & Sons Ltd, 10815–37.
Domenighini A, Giordano M (2009) Fourier transform infrared spec-troscopy of microalgae as a novel tool for biodiversity studies, spe-cies identification, and the assessment of water quality. J Phycol 45:522–31.
Everitt B (1974) Cluster Analysis: An SSRC Review of Recent Research. London: Heinemann Educational Books.
Fiehn O (2001) Combining genomics, metabolome analysis, and bio-chemical modelling to understand metabolic networks. Comp Funct
Genomics 2:155–68.
Fiehn O (2002) Metabolomics – the link between genotypes and phe-notypes. Plant Mol Biol 48:155–71.
Gidman E, Goodacre R, Emmett B, et al. (2003) Investigating plant-plant interference by metabolic fingerprinting. Phytochemistry 63:705–10.
Giordano M, Kansiz M, Heraud P, et al. (2001) Fourier transform infra-red spectroscopy as a novel tool to investigate changes in intracel-lular macromolecular pools in the marine microalga Chaetoceros
muellerii (bacillariophyceae). J Phycol 37:271–79.
Giordano M, Norici A, Gilmour DJ, et al. (2007) Physiological responses of the green alga Dunaliella parva (volvocales, chloro-phyta) to controlled incremental changes in the N source. Funct
Plant Biol 34:925–34.
Gorgulu ST, Dogan M, Severcan F (2007) The characterization and differentiation of higher plants by Fourier transform infrared spec-troscopy. Appl Spectrosc 61:300–8.
Griffiths PR, de Haseth JA (1986) Fourier Transform Infrared
Spectrometry. New York: John Wiley and Sons.
Harmanescu M, Alexandru M, Gergen I (2012) FTIR spectroscopy – a nondestructive method to monitor the impact of different Mixture 10 Monoculture 1 Monoculture 2 Monoculture 5 Monoculture 3 Monoculture 4 Monoculture 7 Monoculture 10 Monoculture 9 Monoculture 6 Monoculture 8 Mixture 4 Mixture 7 Mixture 3 Mixture 6 Mixture 9 Mixture 5 Mixture 8 Mixture 1 Mixture 2 2.0e-06 1.2e-05 Plantago lanceolata Mixture 1 Mixture 2 Mixture 10 Mixture 8 Mixture 9 Mixture 6 Mixture 7 Monoculture 10 Monoculture 9 Monoculture 1 Monoculture 5 Monoculture 2 Monoculture 3 Monoculture 6 Monoculture 8 Monoculture 4 Monoculture 7 Mixture 3 Mixture 4 Mixture 5 0.0000 0.0008 Height Galium mollugo
Figure 3: dendrogram of individuals for two of eight grassland spe-cies selected in monocultures or mixtures over 8 years in a biodi-versity experiment in Jena, Germany, based on values of the second derivative of FTIR spectra (dendrograms for the other six species are presented in online supplementary Figure S2).
fertilizers on the floristic matrix of permanent grassland. Environ
Eng Manage J 11:351–7.
Hartigan JA (1975) Clustering Algorithms. New York: John Wiley & Sons.
HilleRisLambers J, Harpole WS, Tilman D, et al. (2004) Mechanisms responsible for the positive diversity-productivity relationship in Minnesota grasslands. Ecol Lett 7:661–8.
Hocking RR (1976) Analysis and selection of variables in linear-regression. Biometrics 32:1–49.
Hotelling H (1936) Relations between two sets of variates. Biometrika 28:321–77.
Hsu S (1997) Infrared spectroscopy. In Settle AF (ed). Handbook of
Instrumental Techniques for Analytical Chemistry. Arlington, VA: National
Science Foundation Prentice Hall PTR (ECS Professional), 247–83. Johnson HE, Broadhurst D, Goodacre R, et al. (2003) Metabolic
fin-gerprinting of salt-stressed tomatoes. Phytochemistry 62:919–28. Jones R, Causton D, Emmett B, et al. (2012) Latent soil effects of grazing
and ammonium deposition on Deschampsia flexuosa tillers inserted and grown in heather moorland soil. Environ Exp Bot 81:72–8. Kansiz M, Heraud P, Wood B, et al. (1999) Fourier transform infrared
microspectroscopy and chemometrics as a tool for discrimination of cyanobacterial strains. Phytochemistry 52:407–17.
Kardol P, Cornips NJ, van Kempen MML, et al. (2007) Microbe-mediated plant-soil feedback causes historical contingency effects in plant community assembly. Ecol Monogr 77:147–62.
Kim SW, Ban SH, Chung H, et al. (2004) Taxonomic discrimination of flowering plants by multivariate analysis of Fourier transform infrared spectroscopy data. Plant Cell Rep 23:246–50.
Kulmatiski A, Beard KH, Heavilin J (2012) Plant-soil feedbacks pro-vide an additional explanation for diversity-productivity relation-ships. Proc R Soc Biol Sci 279:3020–6.
Lazar G, Ureche D, Ifrim IL, et al. (2012) Effects of the environmental stress on two fish populations revealed by statistical and spectral analysis. Environ Eng Manage J 11:109–24.
Lipowsky A, Schmid B, Roscher C (2011) Selection for monoculture and mixture genotypes in a biodiversity experiment. Basic Appl Ecol 12:360–71.
Macel M, Van Dam NM, Keurentjes JJ (2010) Metabolomics: the chemistry between ecology and genetics. Mol Ecol Resour 10:583–93. Magarey RC (1999) Reduced productivity in long term monoculture:
where are we placed? Australas Plant Pathol 28:11–20.
Mills KE, Bever JD (1998) Maintenance of diversity within plant communities: soil pathogens as agents of negative feedback.
Ecology 79:1595–601.
Movasaghi Z, Rehman S, Rehman IU (2008) Fourier transform infrared (FTIR) spectroscopy of biological tissues. Appl Spectrosc Rev 43:134–79. Petermann JS, Fergus AJF, Turnbull LA, et al. (2008) Janzen-Connell
effects are widespread and strong enough to maintain diversity in grasslands. Ecology 89:2399–406.
R Core Team (2013). R: A language and environment for statis-tical computing. Vienna, Austria: R Foundation for Statisstatis-tical Computing. http://www.R-project.org/
Reich PB, Tilman D, Isbell F, et al. (2012) Impacts of biodiversity loss escalate through time as redundancy fades. Science 336:589–92. Ripley BD (1994) Neural networks and related methods for
classifica-tion. J R Stat Soc Ser B Methodol 56:409–37.
Roach DA, Wulff RD (1987) Maternal effects in plants. Annu Rev Ecol
Syst 18:209–35.
Robinson AR, Ukrainetz NK, Kang KY, et al. (2007) Metabolite profil-ing of Douglas-fir (Pseudotsuga menziesii) field trials reveals strong environmental and weak genetic variation. New Phytol 174:762–73. Roscher C, Schumacher J, Baade J, et al. (2004) The role of biodiver-sity for element cycling and trophic interactions: an experimental approach in a grassland community. Basic Appl Ecol 5:107–21. Rossiter MC (1996) Incidence and consequences of inherited
envi-ronmental effects. Annu Rev Ecol Syst 27:451–76.
Sardans J, Penuelas J, Rivas-Ubach A (2011) Ecological metabo-lomics: overview of current developments and future challenges.
Chemoecology 21:191–225.
Scherling C, Roscher C, Giavalisco P, et al. (2010) Metabolomics unravel contrasting effects of biodiversity on the performance of individual plant species. PLoS One 5:9.
Schnitzer SA, Klironomos JN, Hillerislambers J, et al. (2011) Soil microbes drive the classic plant diversity-productivity pattern.
Ecology 92:296–303.
Schulz H, Baranska M (2007) Identification and quantification of val-uable plant substances by IR and Raman spectroscopy. Vib Spectrosc 43:13–25.
Silvertown J (2004) Plant coexistence and the niche. Trends Ecol Evol 19:605–11.
Smith AR, Johnson H, Hall M (2003) Metabolic fingerprinting of salt-stressed tomatoes. Bulg J Plant Physiol Special 29:153–163.
Stuart BH (1996) A Fourier transform infrared spectroscopic study of P2 protein in reconstituted myelin. Biochem Mol Biol Int 39:629–34. Susi H, Byler HD (1983) Protein structure by Fourier transform infra-red spectroscopy: second derivative spectra. Biochem Biophys Res
Commun 115:391–7.
Tilman D, Reich PB, Knops J, et al. (2001) Diversity and productivity in a long-term grassland experiment. Science 294:843–5.
Tilman D, Reich PB, Knops JM (2006) Biodiversity and ecosystem sta-bility in a decade-long grassland experiment. Nature 441:629–32. Urbanczyk-Wochniak E, Fernie AR (2005) Metabolic profiling reveals
altered nitrogen nutrient regimes have diverse effects on the metabolism of hydroponically-grown tomato (Solanum
lycopersi-cum) plants. J Exp Bot 56:309–21.
van der Putten WH (1997) Plant-soil feedback as a selective force.
Trends Ecol Evol 12:169–70.
Wagner H, Jungandreas A, Fanesi A, et al. (2014) Surveillance of C-allocation in microalgal cells. Metabolites 4:453–64.
Wolfinger R, O'Connell M (1993) Generalized linear mixed models: a pseudo-likelihood approach. J Stat Comput Simul 48:233–43. Zuppinger-Dingley D, Schmid B, Petermann JS, et al. (2014) Selection
for niche differentiation in plant communities increases biodiver-sity effects. Nature 515:108–11.